OPEN ACCESS
Ripping is an environmental friendly rock excavation technique and commonly used in surface mines. The present study was conducted in iron ore mines of Goa, where different type of rock material was present like laterite, manganiferous clay, phyllitic clay, banded hematite quartzite/banded magnetite quartzite (BHQ/BMQ), quartz chlorite schist (QCS), dolomite, limonite, kynite etc which requires different excavation method and machineries. Hard lateritic cover and lumpy lateritic ore is common in iron ore mines Goa, which is generally removed by deploying ripper dozers of different capacities mainly depending on the rippability of lateritic boulders buried inside the rock-soil mixture. The study was mainly focusing on lateritic rock material, and an attempt was made to characterize lateritic rock material in four different types, namely indurated laterite (ILT), laterite (LT), laterite clay (LTC) and lumpy laterite (LLT), and research embody the effect of rock properties on rippability of these lateritic rock materials. Rock material properties such as uniaxial compressive strength (UCS) [5.09 – 22.65 MPa] , point load strength (PLS) [0.5–3.35 MPa], indirect tensile strength (ITS) [0.76 – 2.81 MPa] , sonic wave velocity (P-wave) [1250–3115 m/s], cerchar abrasivity index (CAI) [0.40–2.55], in-situ density [1.58 – 3.20 g/cc], moisture content [1.74 – 4.76 %], slake durability index [72.44–90.25 %], schmidt rebound number [13 – 37], discontinuity spacing [15 – 37 cm], core recovery [18 – 64 %], rock quality designation (RQD) [14–35] were determined to understand their effect on ripper production. Introduction of cerchar abrasivity index (CAI) concept to relate rippability and ripper performance in lateritic rock material is the new contribution. Direct ripping run by Komat’su D275 and Komat’su D355A-3 single shank giant ripper dozer was observed for volume-time calculation and results ranging between 169 – 408 m3/hr. From the study it is observed that lateritic rock material can be categorized into four different ways to understand rippability in laterite and ripper production.
rippability, ripper performance, laterite, rock properties
Iron ore mining is the major industry and is concentrated along the ghat section in the east of Goa where a mining belt extends 65 km from southeast to northwest spanning about 700 km2. A large number of iron ore mines are concentrated in a small area. The iron ore is excavated by conventional open cast mining method forming systematic benches using heavy earth moving ripper dozers, shovel - dumper combination and the pits are laterally extended in stages in all directions with increasing depths. The sequence of mining operations involves systematic removal of hard laterite over burden dozing and mining of lumpy ore zone followed by powdery ore zone.
With the resumption of mining activities in Goa from Oct 2015 more than 50 ripper dozers were deployed in about 30 iron ore mine for ripping operations and number of ripper dozer may increase as more number of mines will be operating soon. After three years long mining ban on state of Goa from Sept. 2012 to Sept. 2015, as the excavation activities are beginning, as reported by mine officials now mining industry have to face new challenges in the form of a global price drop of low grade iron ore (from 100 US$ to 20 US$ approx.) and increased state government taxes (45-60%), so one of the potential factors for sustainable mining and increasing profit will be minimized mining cost. Based on the discussion with mine officials regarding excavation cost of hard laterite, cost of ripping is about 2 to 3 times as compared to blasting, but still ripping is preferred over blasting because of positive features like environment friendly method and selective mining option. Improper selection of ripper dozer and unscientific deployment can lead to high production cost, so ripper selection & performance prediction is an important issue for a successful ground ripping which deals with exposed rock mass properties and ripper machine parameters [1].
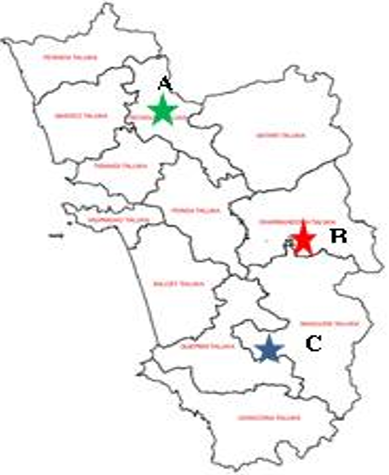
The iron ore deposits in Goa state are mainly hematite and extend in North-North West, South-South East directions from North to the South occupying nearly one-fifth area of the total territory. The iron ore deposits of Goa can be broadly divided into three sectors; Northern Sector (Area to the north of river Madei), Central Sector (Area between the river Madei in the north and Sanvordem railway station in the south), Southern Sector (Area to the south of sanvordem railway station). To understand rippability three iron ore mines were chosen each from northern, central and southern sector as shown in Figure 1. All three iron ore mines are operated by open pit mining method and managed by private companies. Specifications of ripper dozer observed for study are shown in Table 1.
Table 1. Ripper Dozer Machine specifications
|
Ripper Dozer Machine |
Type |
kW |
HP |
Weight (Tonne) |
Shank Length (m) |
Gear while ripping |
|
KOMAT’SU D275A |
Adjustable Parallelogram |
337 |
452 |
5.08 |
1 |
1 |
|
KOMAT’SU D355A-3 |
Adjustable Parallelogram |
315 |
420 |
4.95 |
1 |
1 |
First mine “A” is from the northern sector, situated in Bicholim Taluka, North Goa. Ripper dozer operations were observed at four different places within the mine. Second mine “B” is from central section, and in Dharbandora Taluka, South
Goa. Ripper dozer operations were observed at four different places within the mine. Third mine “C” is from the southern sector, situated at Sanguem & Quepem taluka, South Goa, Goa.
Figure 1. Location map showing three study Sites [2]
Ripper dozer operations were again observed at four different places within the mine. All studied mines are covered by rocks of the Goa Group of Dharwar Super Group, Archaean-Proterozoic age and stratigraphic succession of the rocks is shown in Table 2.
Iron Ore in Goa was formed from banded hematite quartzite’s and ferruginous phyllites through a specific process which cannot be attributed, the process of leaching away silica, replacement by iron concentration [3].
Table 2. The stratigraphic succession of the rocks of Goa region [3]
|
Sub-Recent to Recent |
|
Sea Sand & Laterite |
|
|
Upper Cretaceous to Lower Eocene |
Deccan Trap |
Basalt |
|
|
Proterozoic |
Acid Intrusives |
Pegmatite, vein quartz |
|
|
Porphyritic Granite |
|||
|
Hornblende Granite |
|||
|
Felspathic Gneiss |
|||
|
Granite Gneiss |
|||
|
Archaean to Proterozoic. |
Goa Group |
Vageri Formation |
Meta-basalt |
|
Meta-greywacke |
|||
|
Bicholim Formation |
Banded Ferruginous Quartzite |
||
|
ManganiferousChert Breccia |
|||
|
With Pink Ferruginous Phyllite |
|||
|
Limestone |
|||
|
Pink Ferruginous Phyllite |
|||
|
Qzt-Chlorite-Amphibole Schist |
|||
|
Sanvordem Formation |
Argillite, Quartzite, Tilloid, |
||
|
Metagreywacke. |
|||
|
Barcem Formation |
Metagabbro, Peridotite, Talc-Chlorite Schist |
||
|
Variegate Phyllite Quartz-Chlorite Schist |
|||
|
Quartzite |
|||
|
Quartz-Sericite Schist |
|||
|
Red Phyllite Quartz Porphyry |
|||
|
Schistose And Vesicular Metabasalt. |
|||
Location, general description and regional geology of all three mines are explained in paragraphs below.
Mine A: This mine belongs to Bicholim-Sirigao deposit. The rock in this area comes under the Goa group of rocks of the Dharwar super group. This deposit is situated between Bicholim-Dobdobo in the south-east and Sirigao in North-west. The iron ore deposits are enclosed within pink phyllites and manganiferous clay lenses. The whole unit is capped by hard laterite and lumpy laterite on the surface followed beneath by friable ore and soft phyllitic and manganiferous clays. Lenses of intercalated clays are also present within friable ore body. Further below the water table friable ore is continued as BHQ and BMQ sandwiched between quartz chlorite schist. Dolomite is found deep and beneath it there is no mineralization. The iron ore deposits are strata bound deposits wherein the concentration of iron ore is mainly because of weathering, the principal processes being supergene enrichment by leaching of silicates and other associated gangue from banded ferruginous quartzite.
Mine B: Most of lease area is covered by laterite and except in low lying areas having a soil cover. The laterite exposures have hematitic/magnetic/martite and limonitic ore with ore pieces. Ore body strikes almost in N 90°- N 270° with medium to steep Northerly and Southerly dips. The main constituents of exposed rocks are oxides, and hydrated oxides of iron, silica, and aluminum hydroxide.
The ore body is associated with phyllitic clays and limonitic clays along bands of Manganiferous clays within the normal ore body. Banded Hematite/Magnetite quartzite is on the foot wall side. The over-burden and side-burden generally consist of varying thickness of laterite, enriched lumpy laterite, phyllitic & manganiferous clays and altered intrusive rocks / clays.
Mine C: In Mine C, two ore bands are present. Both bands have laterite, lumpy laterite ore outcrops and form gently dipping synclinal basins with siliceous manganiferous clay as the footwall. The thickness of the ore body is around 30 m on an average and is interspersed with phyllite intercalations. The formations are traversed by igneous intrusions showing both concordant and discordant relations. The intrusives have been altered to clay and show sharp contacts with ore.
The geological succession is seen in pit exposures and confirmed by core drilling data; Laterite 3m – 10 m, Lumpy Iron Ore 2 m – 15 m, Phyllite/Limonitic clay 3 m – 30 m, Powdery Ore (blue dust) 4m – 50 m and Manganiferous Clay as Footwall.
In surface iron ore mines of Goa different type of rock materials were present such as Laterite, Manganiferous clay, Phyllitic clay, Banded Hematite Quartzite/Banded Magnetite Quartzite (BHQ/BMQ), Quartz Chlorite Schist (QCS) Dolomite and limonite.
Among above mentioned rocks materials Banded Hematite Quartzite/Banded Magnetite Quartzite (BHQ/BMQ), Quartz Chlorite Schist (QCS) Dolomite generally excavated by drilling and blasting; Laterite and lumpy lateritic ore requires ripping by ripper dozers; and manganiferous clay, phyllitic clay and other type clay can be excavated by digging through hydraulic shovels.
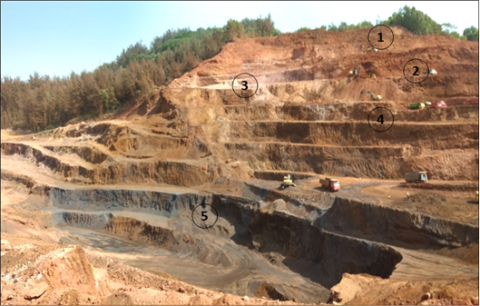
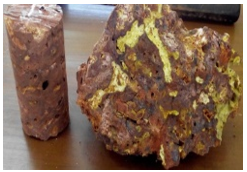
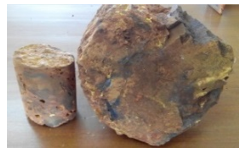
Rock material considered for the present study are laterite or iron containing lateritic rocks of different types such as indurated laterite, vesicular laterite, vermicular laterite and lumpy laterite with varying physical and mechanical properties. It was observed during field visits in different mines that there is variation in the production performance of the ripper dozer in lateritic rock material, so four different types of laterite rock mass were categorized and considered for investigation, namely Indurated Laterite (ILT), Laterite (LT), Laterite-clay (LTC) and Lumpy Laterite (LLT) as shown in Figure 2 and Table 3.
Figure 2. Different type of rock material 1- Indurated laterite (A1 location), 2-Laterite (A2 location), 3- Laterite Clay (A3 location), 4- Lumpy laterite (A4 location), and 5- Powdery ore/Blue Dust
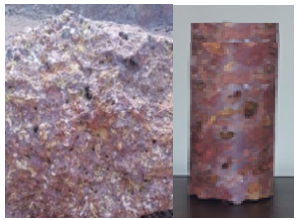
Table 3. General lateritic rock material description considered for rippability study
|
Sl. No. |
Rock Material Types |
Depth from Surface |
Properties |
Rock sample and cylindrical core sample |
|
1 |
Indurated Laterite (ILT) |
0-5 meter |
Indurated in nature, Porous structure with vugs and fissures placed randomly. Major cracks and discontinuities were also present with an average spacing of about 22 cm, ferruginous dense iron matrix with a skeleton type structure mainly of iron containing minerals goethite, magnetite and haematite with traces of washed off clay at the cavity walls, dark brown to black in color, hardness and strength increases considerably with exposure to environment for long. |
|
|
2 |
Laterite (LT) |
2-10 meter |
Vesicular structure of laterite consisting of an interlocking framework of Fe-Al-Si oxyhydroxides, porous skeleton structure mainly contributing to strength of rock material, In-filling are washed out, but some remnants can be seen with average discontinuity spacing of about 15 cm, weathered in nature , dark brown, brick red or cherry red in color. |
|
|
3 |
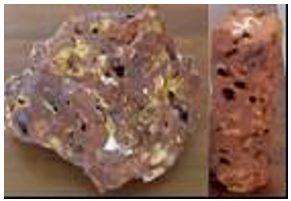
Laterite-clay (LTC) |
2-15 meter |
The Vermicular structure of laterite filled with phyllitic, limonitic or manganese clay with average discontinuity spacing of about 8 cm. In fillings are moist and can be squeezed by fingers and nails. The Interlocked skeleton structure was strong |
|
|
4 |
Lumpy Laterite (LLT) |
5-20 meters |
Reddish brown to steel gray in color, weathered, containing chips of hematite, skeleton structure with presence of visible lumps of iron increasing the overall strength of rock material, average discontinuity spacing of about 25 cm presence of few clay material. |
|
Field study, including investigations of rock material, in terms of location, rock type, depth of excavation is provided in Table 4. Different rock type as mentioned in Table 3 has been characterized in the laboratory as per ISRM 2008 standards.
Table 4. Field information of in-situ rock properties, ripper production performance and rippability observed at studied site
|
Mine |
Location |
Rock type |
Depth from surface in m |
Schmidt hammer value |
Moh’s hardness value |
#Discontinuity spacing in cm |
Exploration Core Information |
Ripper Dozer |
Shank Penetration Depth (m) |
Ripping Production (m3/hr) |
Comment on field Rippability. |
||
|
Core Rec. % |
RQD % |
||||||||||||
|
A
|
A1 |
ILT |
2 |
29 |
5-6 |
37 |
50 |
32 |
D275A |
0.55 |
208.40 |
Difficult |
|
|
A2 |
LT |
5 |
21 |
3-4 |
24 |
34 |
24 |
D275A |
0.61 |
258.80 |
Fair |
||
|
A3 |
LTC |
8 |
15 |
2-3 |
18 |
22 |
16 |
D275A |
0.70 |
408.80 |
Easy |
||
|
A4 |
LLT |
15 |
31 |
5-6 |
33 |
64 |
35 |
D275A |
0.46 |
169.80 |
Very Difficult |
||
|
B
|
B1 |
ILT |
1 |
33 |
4-5 |
33 |
45 |
28 |
D275A |
0.55 |
215.30 |
Difficult |
|
|
B2 |
LT |
4 |
18 |
3-4 |
19 |
30 |
20 |
D275A |
0.64 |
296.90 |
Fair |
||
|
B3 |
LTC |
7 |
13 |
2-3 |
15 |
18 |
14 |
D275A |
0.74 |
406.40 |
Easy |
||
|
B4 |
LLT |
14 |
28 |
4-5 |
32 |
51 |
30 |
D275A |
0.50 |
195.90 |
Very Difficult |
||
|
C
|
C1 |
ILT |
2 |
21 |
5-6 |
26 |
42 |
25 |
D355A-3 |
0.54 |
210.00 |
Difficult |
|
|
C2 |
LT |
6 |
16 |
3-4 |
18 |
33 |
18 |
D355A-3 |
0.61 |
256.80 |
Fair |
||
|
C3 |
LTC |
10 |
13 |
2-3 |
15 |
20 |
16 |
D355A-3 |
0.68 |
340.00 |
Easy |
||
|
C4 |
LLT |
12 |
22 |
4-5 |
25 |
40 |
28 |
D355A-3 |
0.52 |
172.60 |
Very Difficult |
||
|
#[2]. |
|||||||||||||
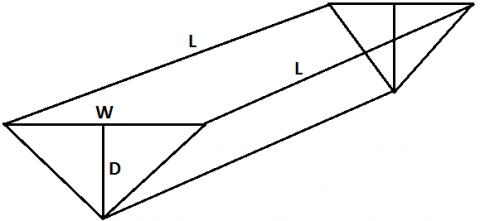
Ripper production was calculated based on volume by cross-sectioning method [4] in which area is first cross-sectioned, then time spent during ripping is recorded. After removing the ripped material, the ripped area was cross-sectioned again and the volume of ripped material was calculated. The ratio between the ripped volume and the ripping time gives the hourly production as shown in Table 4. The shape of the ripped cross section area assumed to be triangular and measurements were taken for average width of cut (W), average depth of cut (D) and cut length (L) to estimate ripper production as shown in Figure 3. The hourly ripper production (m3/hr) is calculated from the data and shown in Table 4. using the following formula [5];
$Q_{r}=\frac{\mathbf{q}_{\mathbf{r}} \times 60 \times \mathbf{E}_{\mathbf{r}}}{\mathbf{C}_{\mathbf{r}}}$ (1)
where; Qr = Ripper Production (m3/hr), qr: production during a cycle (m3),
Cr = Cycle time in minute, (ripping and manoeuvring time), and Er = Operators efficiency (90%)
Performed tests were uniaxial compressive strength (UCS) and young’s modulus as per ISRM 1979, indirect tensile strength (ITS) as per ISRM 1978, point load strength as per ISRM 1985, density determination as per ISRM 1977, and determination of moisture content as per ISRM 1977, slake durability as per ISRM 1972, sonic P-wave velocity of intact rock samples was determined by Sonic Viewer 170 equipment of OYO International, Japan, cerchar abrasivity test as per ISRM 2013. Three to four tests were performed for a particular rock type to arrive at an average test value. Among performed tests, few test results were utilized to understand the effect of rock properties on rippability of lateritic rocks containing iron ore as shown in Table 5.
Figure 3. Simplified Geometry of ripping cut for volume calculation [4]
Table 5. Intact Rock properties tested in laboratory
|
Mine |
Location in mine |
Rock type |
Samples |
UCS* (MPa) |
Samples |
Young’s Modulus MPa)
|
Samples |
PLS, (MPa) |
Samples |
ITS (MPa) |
Samples |
Sonic P-wave velocity (m/s ) |
Samples |
CAI |
Samples |
Density, g/cc |
MC % |
Slake Durability% |
||
|
In-situ |
Dry |
First cycle |
Second cycle |
|||||||||||||||||
|
A
|
A1 |
ILT |
4 |
15.09 |
4 |
2065.62 |
4 |
2.65 |
4 |
2.08 |
4 |
2510 |
2 |
1.40 |
4 |
1.74 |
1.70 |
2.16 |
90.25 |
88.10 |
|
A2 |
LT |
4 |
9.37 |
4 |
934.41 |
4 |
1.9 |
4 |
1.50 |
4 |
2220 |
2 |
1.0 |
4 |
2.30 |
2.22 |
3.94 |
82.42 |
79.84 |
|
|
A3 |
LTC |
4 |
5.04 |
4 |
380.84 |
4 |
0.90 |
4 |
0.86 |
4 |
1440 |
2 |
0.45 |
4 |
1.86 |
1.78 |
4.76 |
73.27 |
69.84 |
|
|
A4 |
LLT |
4 |
22.65 |
4 |
3384.73 |
4 |
3.35 |
4 |
2.82 |
4 |
2990 |
2 |
2.55 |
4 |
3.20 |
3.15 |
1.74 |
87.29 |
86.13 |
|
|
B
|
B1 |
ILT |
4 |
12.18 |
4 |
1868.58 |
4 |
2.21 |
4 |
1.66 |
4 |
2210 |
2 |
1.35 |
4 |
1.73 |
1.70 |
1.97 |
85.08 |
83.83 |
|
B2 |
LT |
4 |
9.89 |
4 |
983.43 |
4 |
1.7 |
4 |
1.31 |
4 |
1840 |
2 |
0.95 |
4 |
1.94 |
1.88 |
3.29 |
78.87 |
74.26 |
|
|
B3 |
LTC |
4 |
6.40 |
4 |
572.28 |
4 |
0.6 |
4 |
0.77 |
4 |
1250 |
2 |
0.55 |
4 |
1.72 |
1.66 |
3.93 |
72.44 |
67.08 |
|
|
B4 |
LLT |
4 |
19.23 |
4 |
2385.17 |
4 |
2.8 |
4 |
2.35 |
4 |
3115 |
2 |
2.25 |
4 |
3.12 |
3.06 |
1.79 |
89.51 |
87.24 |
|
|
C
|
C1 |
ILT |
4 |
11.11 |
4 |
1485.20 |
4 |
2.1 |
4 |
1.43 |
4 |
1640 |
2 |
1.25 |
4 |
1.67 |
1.64 |
1.93 |
83.52 |
83.12 |
|
C2 |
LT |
4 |
8.08 |
4 |
827.62 |
4 |
1.5 |
4 |
1.10 |
4 |
1980 |
2 |
0.90 |
4 |
1.76 |
1.71 |
3.02 |
75.69 |
71.33 |
|
|
C3 |
LTC |
4 |
6.43 |
4 |
391.84 |
4 |
0.5 |
4 |
0.82 |
4 |
1260 |
2 |
0.40 |
4 |
1.58 |
1.53 |
3.50 |
69.87 |
63.10 |
|
|
C4 |
LLT |
4 |
17.81 |
4 |
2186.44 |
4 |
2.55 |
4 |
1.97 |
4 |
2810 |
2 |
2.10 |
4 |
2.92 |
2.87 |
1.85 |
85.81 |
81.22 |
|
|
ILT- Indurated Laterite, LT- Laterite, LTC- Laterite-Clay, LLT- Lumpy Laterite, UCS- Uniaxial compressive strength, PLS- Point load strength, ITS-Indirect tensile strength, CAI – Cerchar abrasivity Index MC- Moisture Content *[2]. |
||||||||||||||||||||
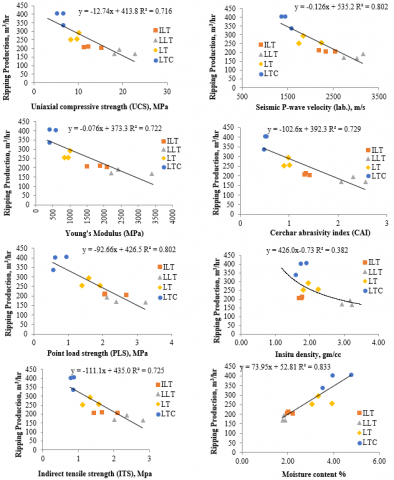
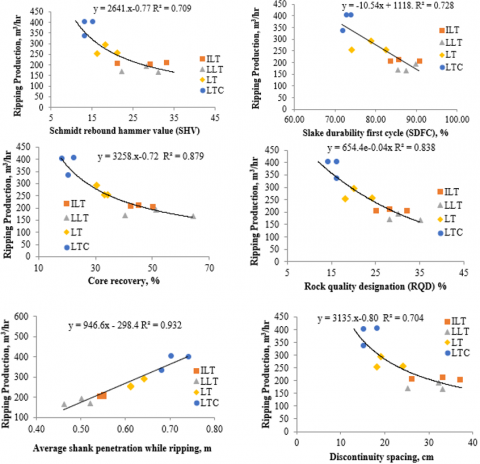
Influence of each rock parameter is observed on the ripping performance and shown in Figure 4 and Figure 5. Selection of influencing parameter was also inspired from the research study conducted on surface miners [6].
Each graph contains rock property on x-axis, ripping production on y-axis and plotted values are differentiated by color legends assigned to each type of rock such as ILT, LLT, LT and LTC.
Figure 4. Relation between ripper production and various rock mass properties
Figure 5. Relation between ripper production and various rock mass properties
Uniaxial compressive strength (UCS), young’s modulus, point load strength (PLS), indirect tensile strength (ITS), seismic wave velocity, cerchar abrasivity index (CAI), in-situ density, slake durability first cycle (SDFC), schmidt rebound hammer value (SHV), discontinuity spacing (DS), core recovery (CR), rock quality designation (RQD) are negatively associated with ripping production i.e. increase in value of above mentioned property will decrease the ripping
production. On the other hand moisture content and average shank penetration are positively associated with ripping-production.
Practically it may be difficult for site engineers and mine planners to determine all rock properties to understand ripper production, for that purpose empirical relation between various lateritic rock properties are determined to get an estimate about other rock properties as shown in Table 6.
Rock property cerchar abrasivity index (CAI) is rarely discussed for analyzing rippability or ripper production, so in present study a new parameter is added to redefine the rippability based on the cerchar abrasivity index (CAI) of rock material and the identified laterite types are also shown in Table 7.
Table 6. Relation between various rock properties for lateritic rock
|
Vp = 101.7UCS + 953.8 |
R² = 0.906 |
Where; Vp = Seismic Wave Velocity (m/sec), UCS = Uniaxial Compressive Strength (MPs), PLS = Point Load Strength (MPa), SDFC = Slake durability First Cycle (%), CAI = Cerchar abrasivity index, RQD= Rock Quality Designation (%), ITS = Indirect Tensile Strength (MPa), DI = Insitu Density (gm/cc). |
|
Vp= 651.2PLS + 1009 |
R² = 0.786 |
|
|
SDFC = 1.040UCS + 68.81 |
R² = 0.728 |
|
|
SDFC = 7.602PLS+ 67.69 |
R² = 0.824 |
|
|
CAI= 0.748PLS - 0.059 |
R² = 0.756 |
|
|
RQD= 1.142UCS + 10.19 |
R² = 0.845 |
|
|
ITS= 0.112UCS + 0.215 |
R² = 0.952 |
|
|
DI= 0.090UCS+ 1.052 |
R² = 0.703 |
|
|
SDFS = 8.833CAI + 66.76 |
R² = 0.686 |
Table 7. Classification of lateritic rock based on CAI [7]
|
Mean CAI |
Classification |
Rock Material |
|
0.1–0.4 |
Extremely low |
Laterite Clay (LTC) |
|
0.5–0.9 |
Very low |
Laterite (LT), Laterite Clay (LTC) |
|
1.0–1.9 |
Low |
Indurated laterite (ILT) |
|
2.0–2.9 |
Medium |
Laterite Lumpy (LLT) |
|
3.0–3.9 |
High |
- |
|
4.0–4.9 |
Very high |
- |
|
≥ 5 |
Extremely high |
- |
Rippability and ripper production study was conducted for about three years between 2015 to 2017 in three private iron ore surface mines of Goa, mainly in the lateritic rock material. Rock material characterization was done for four different types of lateritic rock material, namely indurated laterite (ILT), laterite (LT), laterite clay (LTC) and lumpy laterite (LLT), from each mine four locations were identified where above mentioned rock type was present.
Field investigation regarding ripper production and other necessary information was collected from mines, physical and mechanical properties of intact rock were determined. Different rock material properties like uniaxial compressive strength (UCS), point load strength (PLS), indirect tensile strength (ILT), sonic wave velocity (P-wave), cerchar abrasivity index (CAI), in-situ density, moisture content, slake durability index, schmidt rebound number, discontinuity spacing, core recovery, rock quality designation (RQD) were determined, tabulated and presented in graphical form to understand their effect on ripper production. Introduction of cerchar abrasivity index (CAI) concept to relate rippability and ripper performance of rock material is the new contribution.
Direct ripping run were observed by almost same capacity ripper dozer Komat’su D275 and Komat’su D355A-3. At excavation sites, condition of ripper dozer, and operator skill were maintained same at all the sites to minimize the effect of man and machine variation.
[1] MacGregor F, Fell R, Mostyn G, Hocking G, McNally, AG. (1994). The estimation of rock rippability. Quarterly Journal of Engineering Geology 27: 123-144. http://dx.doi.org/10.1144/GSL.QJEGH.1994.027.P2.04
[2] Avchar ABS. (2017). Applicability of size strength rippability classification system for laterite excavation in iron ore mines of Goa. ASME Journal-ASME IIETA Publication Series Modelling, Measurement and Control C 78: 378-391.
[3] Antonio Mascarenhas GK. (2009). Natural Resources of Goa: A Geological Perspective. Goa, India: Geological Society of Goa, Goa, India.
[4] Basarir HA. (2004). A rippability classification system for marls in lignite mines. Engineering Geology 74: 303–318. http://doi.org/10.1016/j.enggeo.2004.04.004.
[5] Bozdag, T. (1988). Indirect rippability assessment of coal measure rocks: Ankara. Turkey: METU: 86.
[6] Michael Alber OY. (2013). ISRM suggested method for determining the abrasivity of rock by the cerchar abrasivity test. Rock Mechanics and Rock Engineering. http://doi.org/10.1007/s00603-013-0518-0
[7] Prakash AMV. (2013). Rock excavation using surface miners: An overview of some design and operational aspects. International Journal of Mining Science and Technology 23(1): 33-40. http://doi.org/10.1016/j.ijmst.2013.01.006