Arunava Chatterjee* | Sankar Das | Debashis Chatterjee
OPEN ACCESS
This paper studies modelling and simulation for an inverter coupled transformer and the effects caused by source side harmonics on it. It also provides an insight to smart analysis and control of the same. These harmonics are present in most power electronic sources alike an inverter which is frequently used in renewable applications. The extended effect of source side harmonics on transformer primary can be shown on the transformer core hysteresis curve. The effect of harmonics is observed on the magnetization cycle with an electronic integrator circuit. The research uses a modified hysteresis model for the core with the effect of source harmonics taken in to consideration. The simplified hysteresis curve is plotted without removing the transformer from operation with measured data of voltages. Internet-of-things based smart control is proposed for remote operation and control of the transformer especially for use in remote microgrids and wind-farms. The proposed research is an operative tool for measurement and analysis of source harmonic effects on the core of the transformer. The outcome can be used for taking safety measures for extending the operating life of the transformer. The MATLAB/Simulink made simulations along with suitable experiments authenticate the proposed research.
harmonics, hysteresis, internet-of-things (IoT), piecewise-mixed model, smart controller
Harmonics and its effect in source voltage of different electrical systems is already a popularly studied subject. The source harmonics also have some distinct effects on a transformer apart from the load harmonics. In general, the effect of harmonics is mainly the harmonic current flow which causes increased losses. This leads to the transformer core internal temperature rise leading to insulation breakdown [1]. Thus, it is of utmost importance to determine and mitigate the harmful effects of source harmonics on transformers.
Multiple studies were conducted mainly to study the effect of harmonics on the transformers. Effect of voltage harmonics on the transformers for high-power and low voltage cores is proposed by Ioniţă et al. [2]. Result of harmonic pollution for distribution transformers is studied [3] with simple transformer lab tests. But using such open and short circuit tests will lead the transformer to be removed from its operation which is not always feasible. Measurement and required compensation of core losses in transformer is presented by So et al. [4]. Distorted supply voltage is mainly considered in this paper which will contain harmonics. Core loss estimation when the flux has a single odd harmonic is studied typically [5]. Different core sample materials are also considered for the core loss estimation with change in harmonics. Core loss forecast from very low frequency obtained quantities is studied extensively in the study Zhang et al. [6]. It is shown to be quite effective for thin laminations. No-load loss and its prediction during presence of sub-harmonics is studied [7] using two-dimensional finite element model (2D-FEM) analysis for power transformers. With distorted or non-sinusoidal supply, the core losses can be foretold using modified core loss formula as derived from the study of Amar and Kaczmarek [8]. The same formula with minimal changes can be used with pulsed wave power supplies. On similar lines of study, the core loss for brushless DC machine drives can also be predicted [9]. With excessive core loss due to non-sinusoidal supply, the transformer is loaded at a below rated value or in general it is operated in derated condition [10]. Transformer excitation current with non-sinusoidal supply is studied by Ece and Ackay [11]. Method for measurement and loss compensation under no-load conditions with inaccurate sinusoidal supply is also studied for power transformers [12]. Harmonic current impact for distribution transformers is also studied for determining no-load losses [13]. Innovative methods for measuring no-load losses for different transformers is studied [14-16]. This type of core loss modelling is also vital for usage in precise applications like fault current limiters as studied in the Refs. [17, 18]. A similar study is also conducted for transformer but smart control is not presented [19].
In this paper, analysis of effect of harmonics is made on single-phase transformers which can be extended for multi-phase transformers connected to power electronic power sources. The effect of harmonics is observed on the magnetization cycle of the transformer which is measured with an electronic integrator circuit. The research uses a modified hysteresis model for the core with the effect of source harmonics taken in to consideration. The simplified hysteresis curve is plotted without removing the transformer from operation with measured data of voltages. Internet-of-things based smart control is proposed for remote operation and control of the transformer especially for use in remote microgrids and wind-farms. As shown in Figure 1, this type of transformer with an inverter connection is used generally in wind farms for usual voltage level conversion. The inverter provides non-sinusoidal voltage at output due to high frequency switching which contain harmonics. This study provides an unpretentious yet decisive basis on transformer operation when the source contains supply with harmonics. In this study, supply is non-sinusoidal and the effect can be observed on the obtained hysteresis curve for the transformer core. By analyzing the hysteresis loop, idea about the proper control for the transformer operation can be made. An internet-of-things (IoT) based controller is used for the same, also, an idea about the transformer core loss is also made. The model-based simulation study is protracted to laboratory based experimental setup for validation purpose.
This paper is organized as follows, Section 2 describes the research motivation, Section 3 defines the proposed modelling technique, measurement and control while Section 4 details the obtained results with discussion and finally the study is concluded in Section 5.
Transformers mostly used in microgrids or with renewable sources for providing stable voltage often faces the problem of harmonic pollution. Also, transformers are always operated on load and testing or measurements during offline is at all times quite difficult. Most of the research papers for harmonic mitigation in transformers target the transformer study using offline methods where it has to be removed from operation. The proposed research is aimed at its online testing and measurement transformers. The effect of sub-harmonics is ignored in the study for source harmonics and it only considers the dominant lower order harmonics from the supply. From the results, appropriate measures may be taken for operation of the transformer when the sources contain harmonics. Derated operation or a tuned filter may be used along with the transformer for operation with source harmonics which may increase the transformer operating life.
3.1 Proposed technique
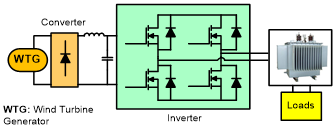
The per-phase system connection is of transformer with inverter which is used with a wind turbine generator for providing stable voltage to loads shown in Figure 1.
Figure 1. Per phase system connection of transformer with inverter which is used with a wind turbine generator for providing stable voltage to loads
(a) Block diagram of the proposed technique
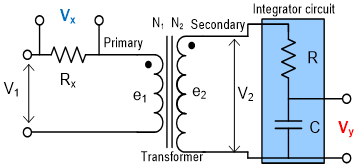
(b) Measurement technique for plotting hysteresis curve
Figure 2. Proposed technique
Block diagram of the proposed technique is detailed in Figure 2(a) and the transformer with the measurement technique for hysteresis curve derivation is shown in Figure 2(b) [19]. From Figure 2(b), the transformer magnetic field strength H of the core material can be derived [19] as:
$H=\left(N I_{m}\right) / l$ (1)
where, N is number of turns with l as the length of core material. Im is the transformer magnetizing current. N and l are having constant values for a particular transformer having fixed core. For accurate measurement of magnetizing current, a resistance Rx is connected in series with the primary as it will be required for hysteresis curve derivation. The voltage across this resistor is proportional to the magnetizing current which is yet proportional to the core magnetic field strength. Thus:
$V_{x}=I_{m} R_{x}$ (2)
For plotting the transformer core hysteresis curve, the magnetic flux density is a compulsory quantity. The flux density B is found as:
$B=\phi / A$ (3)
where, ϕ is the magnetic flux (webers) and A is the cross-sectional area of the transformer core whose value is constant. The rate of change of magnetic flux is directly proportional to the induced emf as per Faraday’s law. This is also proportional to the output voltage. Thus, the magnitude of, induced emf e2, is:
$e_{2}=N_{2} \frac{d \phi}{d t}$ (4)
also, from (4):
$\frac{1}{N_{2}} e_{2} d t=d \phi$ (5)
Now applying integration on both sides of (5):
$\phi=\frac{1}{N_{2}} \int e_{2} d t$ (6)
The integrator circuit acts as a passive low-pass filter and voltage across the capacitor can be measured as integrated signal output. From the integrator circuit output:Thus, flux is directly proportional to the integral of the secondary voltage [19]. From (6), it is thus obvious that the secondary voltage can be integrated to form the proportional signal for finding flux density. For this purpose, an electronic integrator circuit is used at the output side of the transformer.
$V_{y}=\frac{1}{R C} \int V_{2} d t$ (7)
3.2 Selection of the parameters
Choosing proper values of the resistors used, Rx and R and capacitor C are essential in the study. The procedure adapted wherein the circuit elements are chosen relative to the transformer physical quantities. For choosing the resistor Rx, let the number of turns in primary be N1 and length of wire for primary be l with radius as r, thus:
$l=2 \pi r N_{1}$ (8)
Replacing value of (8) in (1):
$H=I_{m} / 2 \pi r$ (9)
or,
$H=I_{m} Z_{1}$ (10)
where, Z1 (=1/2πr) is a constant. The value of H can be articulated as (11) using (2) and (10) as:
$H=V_{x} \frac{Z_{1}}{R_{x}}$ (11)
If, Z1=Rx, then H=Vx.
Once the primary side resistor value is chosen, the secondary side resistor and capacitor values are to be selected using the following technique.
For secondary side integrator component values, resistor R and capacitor C to be used from (3) and (6) are found [19]:
$B=\frac{1}{A N_{2}} \int e_{2} d t$ (12)
Taking Laplace transform on both sides of (12) and neglecting any initial condition, one may find flux density as in (13):
$B(s)=\frac{E_{2}(s)}{s}\left(\frac{1}{A N_{2}}\right)$ (13)
From transfer function of RC network as shown in (14):
$\frac{V_{y}(s)}{E_{2}(s)}=-\frac{1 / C s}{R+1 / C s}=\frac{1}{1+R C s}$ (14)
$B(s)=-\left(\frac{R C}{A N_{2}}\right)\left[1+\frac{1}{R C_{s}}\right] V_{y}(s)$ (15)
The RC << 1, (1/RC) >> 1. Thus, RC terms can totally be neglected from (15).
3.3 MQTT based Internet-of-Things (IoT) controller
Owing to the occurrence of odd harmonic frequencies in the supply, the hysteresis loss value will change which will also be detected in the hysteresis curve. The hysteresis curves thus obtained from subsection 3.2 can be compared with that of a healthy transformer with pure sinusoidal supply to understand the transformer operating behaviour.
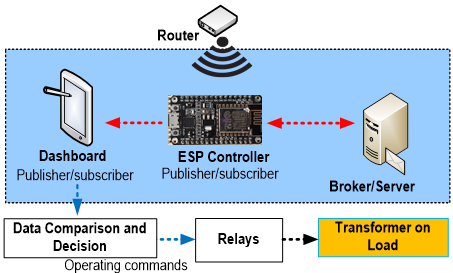
For comparison of the results of hysteresis curve, an internet of things (IoT) based controller is used. The controller uses the popular Message Queuing Telemetry Transport or MQTT protocol for communication and control with the control peripheral devices. The control is instantaneous after detection of the harmonics. The data obtained will be shared with the peripheral device like a controller dashboard for easy visualization. The IoT based controller can control the transformer operation and take decision to switch ON/OFF loads for running in derated mode or to use any other counter mechanism like a filter to mitigate the effect of harmonics. The automated control thus achieved is cost-friendly with only a smart-controller supporting IoT based bidirectional communication structure. The same is depicted in Figure 3. As shown, the controller can make smart decisions regarding the operation of transformer thus helping in control of the transformer. This will be helpful in situations where the renewables are operated far away from the control structure like a wind farm.
Figure 3. IoT based smart controller for controlling transformer operation during source harmonics
The simulations for the proposed technique are carried out using MATLAB/Simulink for single-phase transformers rated at 750VA, 100/200V, 50Hz. The simulations are carried with considering the effect of source harmonics at one time and without source harmonics for the next.
4.1 Without source harmonics
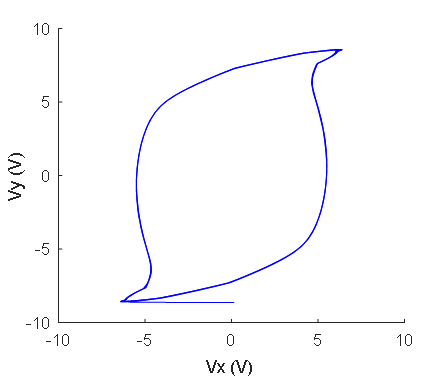
The simulation waveforms of supply voltage and the hysteresis curve for the transformer for pure sinusoidal supply which is free from any harmonics are shown in Figure 3. As observed, the hysteresis curve shows smooth flux reversals which also indicate the absence of any harmonics.
4.2 With source harmonics
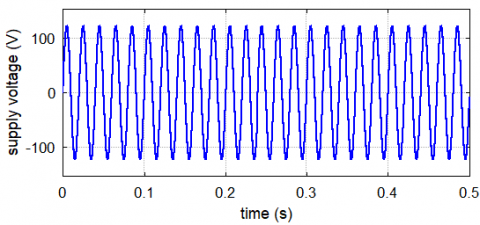
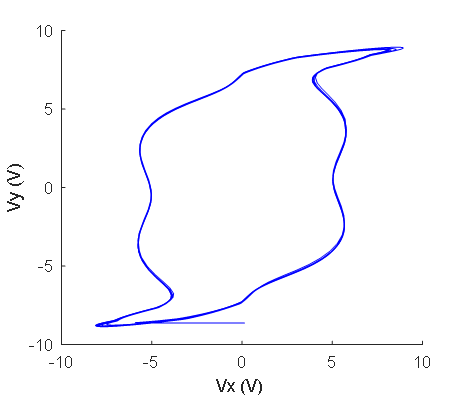
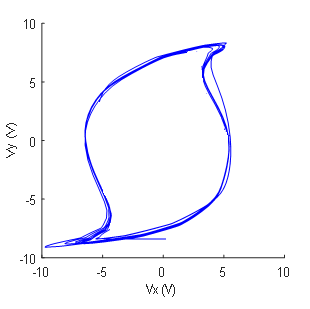
When the supply comprises odd harmonics of 3rd and 5th order, the supply voltage waveform and the hysteresis curves are shown in Figure 4. In dissimilarity to the supply without any harmonics, in this case, the hysteresis curve shows some curvatures indicating distorted flux reversals.
It is thus vibrant than the hysteresis waveform has unusual curvatures than when harmonic free supply is used. This can be also be mathematically verified and analysed using simulated data for further study.
(a) Voltage waveform
(b) Corresponding hysteresis curve
Figure 4. For pure sinusoidal supply
(a) Voltage waveform
(b) Corresponding hysteresis curve
Figure 5. For sinusoidal supply with presence of 3rd and 5th order harmonics
Figure 6. Experimental magnetization characteristics showing the piecewise mixed model with the trendline
Piecewise mixed model equations are used for storage of the hysteresis curve and later for comparison [20, 21]. In this technique, magnetization characteristics is found from laboratory-based measurements and the following data obtained is piecewise broken into linear sets of data for storage and later retrieval. Figure 6 shows such a curve wherein the data is broken into linear divisions for storage in processor memory.
The experimentally obtained hysteresis curve can be broken into this model for further study. For this purpose, the experimentally obtained open circuit characteristics can be found. It is evident that when a transformer is under operation, this characteristic cannot be obtained and thus the proposed measurement technique using the integrator for measurement of hysteresis curve data can be done.
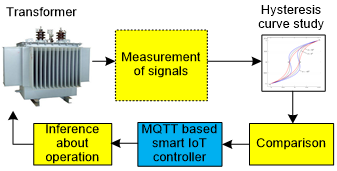
The data obtained for the curve is then used for comparison with data when the transformer is operating with sinusoidal source voltage and the inference about the operating condition can be arrived at. Later, an accurate analysis with the sinusoidal supply operated transformer magnetization characteristics can be made using the above-mentioned IoT based control.
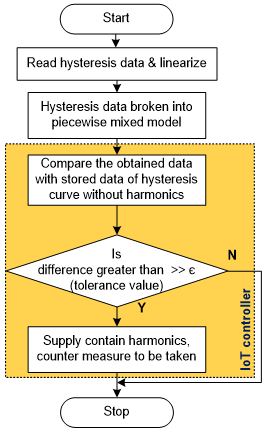
Figure 7. Flowchart for comparison and operation
The subroutine for comparison with the flowchart is shown in Figure 7. As shown in the figure, the magnetization characteristics is first done with breaking the data into the piecewise mixed model for comparison. The obtained data is then compared with the standard data as obtained from sinusoidal supply run transformer magnetization characteristics. The curvature data difference is calculated. If the difference is infinitesimally small than the set tolerance value, the transformer is kept in the normal operating zone. If the difference is larger than the tolerance value, the transformer is suitably operated with lesser loads and thus in a derated mode. For this purpose, the IoT controller will suitably disconnect the non-critical loads form the transformer load end.
The same technique can be used with some other intelligent controller also for operation and for future, a comparison may be drawn with other techniques for smart control. Figure 7 also depicts the utility of using a smart controller and decision will automatically be taken by the controller end with minimal disturbance in the supply side. This is especially advantageous for large renewable plants like wind-farms for power generation.
4.3 Source harmonics mitigation
The effect of source side harmonics can mostly be mitigated by operating the transformer in derated mode. This can be done by switching off the non-critical loads which can be done by the proposed smart controller. A passive inductor-capacitor LC filter can also be used in parallel to the transformer magnetizing circuit which will also effectively tune out the harmonic frequencies thereby reducing the effect of source harmonics. When the source harmonics are mitigated, the flux reversals become smoother as shown in hysteresis curve of Figure 8.
Figure 8. Hysteresis curve obtained with source harmonic mitigation
Figure 9. Signal (p.u. core current) for the transformer with reduction in source harmonics with the proposed technique as shown in top trace
Figure 9 shows the magnetizing current signal for the transformer with mitigated source harmonics with filtering in the magnetizing circuit and without harmonic current mitigation. The corresponding current THD (Total Harmonic Distortion) is shown in Figure 10.
Figure 10. Corresponding current THD after and before mitigation of source harmonics using a filter in the magnetizing circuit
It is detected that such filtering reduces the effect of source harmonics with as shown in the top trace of the figure. Although, such filtering will require the modification the core circuit and thus it may not be always feasible. The same can be maintained with derated mode of operation of the transformer.
This paper an analysis on the source side harmonics and their effects on transformer operation. For this study, the effect of source side harmonics shown on the hysteresis curve of the transformer core. Generally an inverter can be such a source which contain harmonics which is commonly used in renewable power generation connected to a transformer. The study proposes a model for the transformer for easy measurement and detection of such operation with hysteresis. Also, a technique is presented for easy measurement of transformer parameters for plotting the hysteresis curve. During such operation, the control is proposed with a smart MQTT based IoT controller which can efficiently detect such operation. The controller can be used to operate the transformer in derated mode during such operation thereby extending the operational life of the transformer. In future, a closed loop control can be added for more accurate control. Other smart controllers can also be compared in future studies for easier detection with reduced cost. MATLAB/Simulink based simulations with suitable experiments carried out validate the proposed study.
The Authors gratefully thank Electrical Engineering department of Jadavpur University, Kolkata, India, for helping in carrying out the research work in the present form.
[1] Dao, T., Phung, B.T. (2018). Effects of voltage harmonic on losses and temperature rise in distribution transformers. IET Generation Transmission and Distribution, 12(2): 347-354. https://doi.org/10.1049/iet-gtd.2017.0498
[2] Ioniţă, V., Cazacu, E., Petrescu, L. (2018). Effect of voltage harmonics on iron losses in magnetic cores with hysteresis. 18th International Conference on Harmonics and Quality of Power (ICHQP), Ljubljana, pp. 1-5. https://doi.org/10.1109/ICHQP.2018.8378843
[3] Dao, T., Halim, H.A., Liu, Z., Phung, B.T. (2016). Voltage harmonic effect on losses in distribution transformers. International Conference on Smart Green Technology in Electrical and Information Systems (ICSGTEIS), Bali, pp. 27-32. https://doi.org/10.1109/ICSGTEIS.2016.7885761
[4] So, E., Arseneau, R., Hanique, E. (2003). No-load loss measurements of power transformers under distorted supply voltage waveform conditions. IEEE Transactions on Instrumentation and Measurement, 52(2): 429-432. https://doi.org/10.1109/TIM.2003.809910
[5] Lavers, J., Biringer, P., Hollitscher, H. (1977). Estimation of core losses when the flux waveform contains the fundamental plus a single odd harmonic component. IEEE Transactions on Magnetics, 13(5): 1128-1130. https://doi.org/10.1109/TMAG.1977.1059541
[6] Zhang, Y., Pillay, P., Ibrahim, M., Cheng, M. (2012). Magnetic characteristics and core losses in machine laminations: high-frequency loss prediction from low-frequency measurements. IEEE Transactions on Industry Applications, 48(2): 623-629. https://doi.org/10.1109/TIA.2011.2180874
[7] Arslan, E., Sakar, S., Balci, M.E. (2014). On the no-load loss of power transformers under voltages with sub-harmonics. 2014 IEEE International Energy Conference (ENERGYCON), Cavtat, pp. 228-233. https://doi.org/10.1109/ENERGYCON.2014.6850433
[8] Amar, M., Kaczmarek, R. (1995). A general formula for prediction of iron losses under nonsinusoidal voltage waveform. IEEE Transactions on Magnetics, 31(5): 2504-2509. https://doi.org/10.1109/20.406552
[9] Nag, T., Santra, S.B., Chatterjee, A., Chatterjee, D., Ganguli, A.K. (2016). Fuzzy logic-based loss minimisation scheme for brushless DC motor drive system. IET Power Electronics, 9(8): 1581-1589. https://doi.org/10.1049/iet-pel.2015.0714
[10] Faiz, J., Ghazizadeh M., Oraee, H. (2015). Derating of transformers under non-linear load current and non-sinusoidal voltage – an overview. IET Electric Power Applications, 9(7): 486-495. https://doi.org/10.1049/iet-epa.2014.0377
[11] Ece, D.G., Ackay, H. (2002). An analysis of transformer excitation current under nonsinusoidal supply voltage. IEEE Transactions on Instrumentation and Measurement, 51(5): 1085-1089. https://doi.org/10.1109/TIM.2002.806007
[12] Arseneau, R., So, E., Hanique, E. (2005). Measurements and correction of no-load losses of power transformers. IEEE Transactions on Instrumentation and Measurement, 54(2): 503-506. https://doi.org/10.1109/TIM.2004.843407
[13] Kefalas, T.D., Kladas, A.G. (2010). Harmonic impact on distribution transformer no-load loss. IEEE Transactions on Industrial Electronics, 57(1): 193-200. https://doi.org/10.1109/TIE.2009.2030207
[14] Liu, X., Yao, C., Liang, S., Wang, J., Liu, T. (2018). Measurement of the no-load characteristics of single-phase transformer using an improved low-frequency method. IEEE Transactions on Industrial Electronics, 65(5): 4347-4356. https://doi.org/10.1109/TIE.2017.2762624
[15] Zhou, L., Jiang, J., Liu, H., Gao, S., Li, W., Zhang, W. (2019). Homogenisation model for calculating multi-point grounding current of transformer core. IET Electric Power Applications, 13(2): 243-250. https://doi/10.1049/iet-epa.2018.5100
[16] Gao, S., Zhang, C., Zhou, L., Lin, T., Zhou, X., Cai, J. (2020). A homogeneous model for estimating eddy-current losses in wound core of multilevel-circle section. IEEE Transactions on Transportation Electrification, 6(2): 752-761. https://doi.org/10.1109/TTE.2020.2990573
[17] Sarkar, D., Roy, D., Choudhury, A.B., Yamada, S. (2016). Harmonic analysis of a saturated iron-core superconducting fault current limiter using Jiles-Atherton hysteresis model. Modelling, Measurement and Control A, 89(1): 101-117. https://doi.org/10.18280/mmc_a.890101
[18] Sarkar, D., Roy, D., Choudhury, A.B., Yamada, S. (2015). Performance analysis of saturated iron core superconducting fault current limiter using Jiles–Atherton hysteresis model. Journal of Magnetism and Magnetic Materials, 390: 100-106. https://doi.org/10.1016/j.jmmm.2015.04.071
[19] Chatterjee, A., Das, S., Chatterjee, D. (2021) Effective method to measure and inspect the hysteresis loss of a transformer. Journal of Electrical, Electronic, Information and Communication Technology, 3(2): 44-48. https://dx.doi.org/10.20961/jeeict.3.2.50956
[20] Chatterjee, D. (2011). A novel magnetizing-curve identification and computer storage technique for induction machines suitable for online application. IEEE Transactions on Industrial Electronics, 58(12): 5336-5343. https://doi.org/10.1109/TIE.2011.2126539
[21] Chatterjee, A., Roy, K., Chatterjee, D. (2014). A Gravitational Search Algorithm (GSA) based Photo-Voltaic (PV) excitation control strategy for single phase operation of three phase wind-turbine coupled induction generator. Energy, 74: 707-718. https://doi.org/10.1016/j.energy.2014.07.037