Hong Chang* | Lihan Jin
© 2020 IIETA. This article is published by IIETA and is licensed under the CC BY 4.0 license (http://creativecommons.org/licenses/by/4.0/).
OPEN ACCESS
Accompanied by a large amount of heat absorption and release during the phase change process, phase change concrete has the advantages of high energy storage density, low volume expansion ratio and approximate isotherm in the heat exchange. It is widely used in the building field. For this, using steel balls as the carrier material and butyl stearate as the phase change material (PCM), the authors combined the phase change energy storage material with the energy pile to prepare a new type of concrete energy pile enhanced with the PCMs. Then, the tests and numerical simulations were conducted to study the optimal mix ratio and thermal conductivity of the phase change concrete. The results show that adding steel balls (10% of the coarse aggregate volume), and slag and fly ash (5% of the cementitious material mass) to the ordinary concrete C30 can greatly improve the heat transfer efficiency of the energy pile. The research findings provide a guidance for engineering practice.
energy pile, phase change concrete, steel ball, butyl stearate, numerical simulation
Phase change concrete stores and releases energy through phase change materials (PCM) inside, thereby improving the energy storage capacity of the concrete. In 2008, Darkwa [1] conducted a numerical analysis on the air duct system of laminated phase change concrete used for building cooling, and found that the number of transfer units has a greater impact on the thermal performance of the system, and in order to achieve effective thermal response in the mechanical ventilation pipe network system, some form of turbulence must be generated in the structure. In 2011, Entrop et al. [2] studied the application of PCMs in concrete floors by storing solar energy in a mixture of concrete and PCMs, and monitored the temperature of four concrete floor slabs in a closed environment to reflect the relationship between the ambient temperature and solar radiation in the phase change concrete floor. In 2014, Wang et al. [3] prepared paraffin wax/ceramsite PCMs and coated them with epoxy resin and triethylenetetramine; the temperature-time curve test and differential scanning calorimeter analysis show that the PCM has a high paraffin adsorption rate under vacuum conditions and a small leakage during thermal cycling; compared with ordinary concrete, paraffin ceramsite concrete reduces indoor temperature fluctuations and improves living comfort. In 2015, Ji et al. [4] used hollow steel balls with high thermal conductivity and high absorption rate as carrier materials to absorb the octadecane, and combined them with concrete materials to prepare a new type of phase change energy storage concrete. In 2017, Pilehvar et al. [5] prepared the geopolymer concrete (GPC) and Portland cement concrete (PCC) enhanced with different dosages of solid-liquid microcapsule phase change materials (MPCM) and cured at 20℃ and 40℃, and found that with the increase of MPCM content, the compressive strength of GPC and PCC decreased; an air gap was formed between the microcapsules and the surrounding concrete matrix through the scanning electron microscope. In 2018, Ye et al. [6] aimed to study the energy-saving effects of the PCMs with different melting points in different seasons, for which Mg(NO3)2·6H2O and CaCl2·6H2O were mixed with different mass fractions to prepare eutectic materials, and the two composite materials were formed into PCM plates by vacuum compression, to conclude that placing the PCM plates on the roof and south wall can improve indoor energy saving effect. In 2020, Qu et al. [7] developed a new phase change foam concrete with low thermal conductivity and suitable phase-transition temperature, and prepared the composite PCMs by using fumed silica to adsorb paraffin; after the test, it’s found that the composite PCMs with 45% content of paraffin have the best adsorption and coagulation performance, and the phase change foam concrete enjoys good structural stability, low thermal conductivity and high heat storage capacity. Some scholars prepared the paraffin wax- enhanced phase change concrete, and then carried out different tests such as the cubic compressive strength test, axial compressive strength test, static compressive elastic modulus test, and flexural strength test; with the dosage decreased, further tests were conducted on its thermal performance, namely thermal conductivity, thermal conductivity, specific heat, linear expansion coefficient, and adiabatic temperature rise etc. [8].
The energy pile has the dual functions of simultaneously bearing the load of the upper building and installing the buried heat exchanger in the ground source heat pump. The heat storage and exchange performance of the concrete directly affects the heat transfer efficiency of the energy pile to the soil around the pile. When the phase change concrete exchanges heat with the outside, it can ensure high heat transfer efficiency and low energy consumption, and remain the temperature of the material itself unchanged, thereby reducing the temperature stress and deformation of the pile due to cold and heat loads. Meanwhile, PCMs with better heat conduction and storage performance are added to the pile, which can help to reduce the temperature range of the pile and the surrounding stratum, the thermal consolidation and deformation of the soil, and the settlement of the ground and the pile foundation. Therefore, concrete energy piles enhanced with the PCMs have broad application prospects in the field of building energy conservation. In this paper, a certain proportion of phase change steel balls were added to the concrete of the energy pile instead of the coarse aggregates, and fly ash and slags were also mixed. The tests were conducted to determine the optimal mix ratio of the phase change concrete suitable for the energy pile, and then improve the heat storage capacity of the energy pile. This shall provide guidance for engineering practice [9].
2.1 Basic materials
Table 1 lists the relevant parameters of cementitious materials, coarse aggregates, and fine aggregates. Thepolycarboxylate superplasticizer was selected, and the level-2 fly ash and granulated blast furnace slag were used as strength reinforcing agent.
2.2 Phase change materials
The commonly used PCMs in the building field are decanoic acid, stearic acid, pentadecane, hexadecane, and butyl stearate etc. In this paper, preliminary tests were conducted to study the heat transfer performance of materials, and select the butyl stearate with stable performance, large phase change latent heat, non-toxic, and good thermal stability as the PCM. The relevant parameters are shown in Table 2.
The butyl stearate used in the test was produced by Guangdong Aoboshun Chemical Co., Ltd. As an industrial-grade product, it’s a colorless, non-toxic, light yellow oily liquid with a slightly fatty smell.
2.3 Carrier material
The commonly used carrier materials in phase change concrete include ceramsite, hollow steel balls, and phase change microcapsules, etc. Through reviewing related literatures [8], it’s found that hollow steel balls have high PCM adsorption rate, low permeability, and strong fire resistance. Therefore, the hollow steel balls were selected as the carrier materials in this study. Table 3 lists the relevant parameters.
Table 1. Basic material
|
Type |
Name |
Spec. |
Apparent density (kg/m³) |
Packing density (kg/m³) |
|
Cementitious materials |
Cement |
P.O42.5 |
1400 |
1400 |
|
Coarse aggregates |
Normal gravel |
5- 20mm |
2760 |
1420 |
|
Fine aggregates |
Medium sand |
Grade Ⅱ |
2600 |
1510 |
Table 2. Phase change material
|
PCM |
Density (kg/m³) |
Freezing point (℃) |
Boiling point (℃) |
Ignition point (℃) |
Viscosity (cP) |
|
Butyl stearate |
0.8554×10³ |
19 |
343 |
355 |
8 |
|
Carrier material |
Spec. |
Outer diameter(mm) |
Inner diameter(mm) |
Density(kg/m3) |
|
Hollow steel ball |
304# Stainless steel |
16 |
15.5 |
7.93×10³ |
Table 4. Packaging material
|
Packing material |
Description |
Spec. |
|
Rivet |
Aluminum flat round head; core-pulling |
2.4mm×6mm (Diameter × length) |
|
Gasket |
304# stainless steel, flat round shape |
6mm×2mm×0.5mm (Outer diameter × inner diameter×thickness) |
|
AB glue |
7205 AB glue of transparent epoxy |
50ml/piece |
2.4 Packing materials
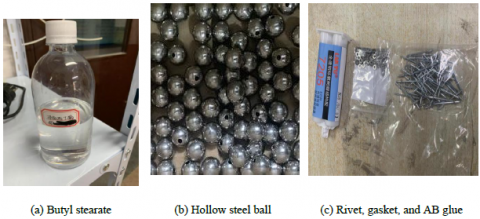
In order to prevent the leakage of the PCMs in the steel ball, the rivets, gaskets, and AB glue were used to package the phase change steel ball, as shown in Figure 1. Table 4 lists the relevant parameters. The rivet can fill the small holes left in the steel ball after the PCM pouring; the gasket is to increase the contact area between the rivet and the steel ball surface, preventing the steel ball from being damaged or the rivet from slipping; AB glue is to prevent the PCMs in the steel ball from leaking. When the AB glue is not in use, the adhesive is placed into the two hoses of A and B; when in use, the adhesive in the two hoses will be mixed and quickly solidified, which is easy to use. The AB glue also has the characteristics of high hardness, good punching resistance, high bonding strength, and good weather resistance.
Figure 1. Test materials
3.1 Packaging test
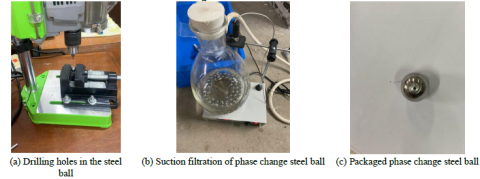
First, drill a small hole with a diameter of 2.5mm on the surface of the hollow steel ball using the bench drill, as shown in Figure 2(a); then put the PCMs and the steel ball into the suction flask for 1h vacuum filtration in Figure 2(b), and use a 95-2 magnetic stirrer to heat up to 40°C and increase the filtration efficiency; afterwards, seal the steel ball holes with gaskets and blind rivets, apply AB glue on the interface, and place it in a cool place to air dry. The packaged steel ball is shown in Figure 2(c).
Figure 2. Packaged steel ball
3.2 PCM absorption rate and phase change steel ball density
50 perforated but unencapsulated steel balls were randomly selected and weighted to be m0. Next, the PCMs were filled in the 50 steel balls for packaging, and then weighed to obtain m1. The PCM absorption rate P1 was calculated, as shown in the formula (1):
$P_{1}=\frac{\mathrm{m}_{1}-m_{0}}{m_{1}} \times 100 \%=40.49 \%$ (1)
where,
P1-absorption rate of phase change material, %;
m0-mass of 50 unpackaged phase change steel balls, g;
m1-the mass of 50 packaged phase change steel balls, g.
The mass of butyl stearate adsorbed by the phase change steel ball was 68.63% of the hollow steel ball. Compared with other carrier materials such as ceramsite and phase change microcapsule, the absorption rate of the steel ball is higher.
The density of the packaged phase change steel ball is shown in formula (3):
$\mathrm{V}=\frac{4}{3} \pi \mathrm{r}^{3}=1.0723 \times 10^{-4} \mathrm{m}^{3}$ (2)
$\rho=\frac{\mathrm{m}_{1}}{50 \mathrm{v}}=1.948 \times 10^{3} \mathrm{kg} / \mathrm{m}^{3}$ (3)
where,
V-Volume of steel ball, m;
r-The radius of the steel ball, m;
p-Density of packaged phase change steel ball, kg/m3.
3.3 Permeability test
In order to test the packaging effect of the steel balls, a permeability test was performed on 50 steel balls that were previously encapsulated. First put the phase change steel balls in an electric blast drying oven and let them stand for 6 hours at the temperature of 50℃; then place them into a biochemical incubator and let them stand for 6 hours, and set the temperature to 0℃; finally, weight the 50 steel balls and obtain m2. The permeability of phase change steel balls is given as shown in formula (4):
$P_{2}=\frac{m_{1}-m_{2}}{m_{1}} \times 100 \%=0.3687 \%$ (4)
where,
P2-Permeability of phase change steel ball, %;
m1-The mass of 50 packaged phase change steel balls, g;
m2-The mass of 50 phase change steel balls after permeability tests, g.
Compared with other carrier materials such as ceramsite and phase change microcapsules, the permeability of steel balls is much lower. Therefore, steel balls encapsulated with rivets, gaskets and AB glue have good sealing performance, which effectively solves the leakage problem of the PCMs.
The preliminary test above showed that the mechanical properties of the concrete itself were reduced after adding the PCMs. According to the related literature [10], the addition of a certain proportion of slag and fly ash to the concrete improve its strength, compactness, and durability. So, slag and fly ash were added to steel ball phase change concrete as strength reinforcing agents in this study. Some scholars conducted a series of experimental studies on the mix ratio of fly ash and slag concrete, and proposed that with the fly ash and slag (5% of the cement mass) added, the mechanical properties and workability of the concrete are relatively good, meeting the strength requirements of the prepared concrete. Therefore, the optimal mix ratio of the slag and fly ash in concrete is determined to be 5% of the cement mass, and the strength grade of the prepared concrete is C30 [11].
To study the influence of the volume rate (the replacement rate of coarse aggregates with steel balls) on the mechanical properties of concrete, it’s found that when the steel ball replacement rate exceeded 30%, the compressive strength grade of the concrete was lower than the requirement of the pre-configured C30 concrete through the preliminary tests about different replacement rates. Thus, the concrete test blocks in this test were prepared in four working conditions according to different volume rates of the phase change steel balls: A, B, C, and D, corresponding to 0%, 10%, 20%, and 30% steel ball replacement rate; water cement ratio (W/C) was 0.6. Table 5 shows the specific mix design of steel ball phase change concrete.
Table 5. Mix design of steel ball phase change concrete
|
Working Condition |
Steel ball replacement rate (%) |
Water (kg/m3) |
Cement (kg/m3) |
Fine aggregate (kg/m3) |
Coarse aggregate (kg/m3) |
Phase change steel ball (kg/m3) |
Fly ash (kg/m3) |
Slag (kg/m3) |
Water reducer (kg/m3) |
|
A |
0 |
185 |
308 |
722 |
1178 |
0 |
15 |
15 |
0.92 |
|
B |
10 |
185 |
308 |
722 |
1060 |
37 |
15 |
15 |
0.92 |
|
C |
20 |
185 |
308 |
722 |
943 |
74 |
15 |
15 |
0.92 |
|
D |
30 |
185 |
308 |
722 |
925 |
111 |
15 |
15 |
0.92 |
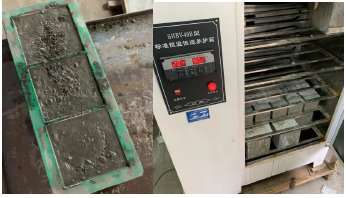
The materials were mixed in an electric concrete mixer. First, dry mix the crushed stone and steel balls for at least 1 min, then put in sand, cement, slag, fly ash and water reducing agent, and dry mix again for at least 2 min. After mixing evenly, add water and wet mix for 35 seconds. The total mixing time was no more than 6 minutes. Next, add the mixture to the mold in 3 times, and vibrate with a concrete vibrator for 1 minute. When vibrating the mixture for three times, flatten the surface of the mold and number them. The mold was released after standing for 48 hours in the room, and then placed in a concrete curing box for 28 days, with the concrete curing box at a set temperature of 20℃ and a set humidity of 90%. The process is shown in Figure 3.
Figure 3. Preparation and maintenance of concrete test blocks
5.1 Compressive strength test
The standard concrete cubic test blocks of 100mm×100mm×100mm were used in the concrete compressive strength test. To reduce the test error, three concrete test blocks of the same mix ratio were poured, and the average compressive strength of the three test blocks was taken in the test (Figure 4).
According to GB/T 50081-2001 Standard for Test Methods of Mechanical Properties on Ordinary Concrete, the concrete axial compressive strength test was carried out on the above test blocks using the numerical control compression testing machine. If the test block is damaged, record the failure load and convert it into the ultimate compressive strength. The test results are shown in Table 6.
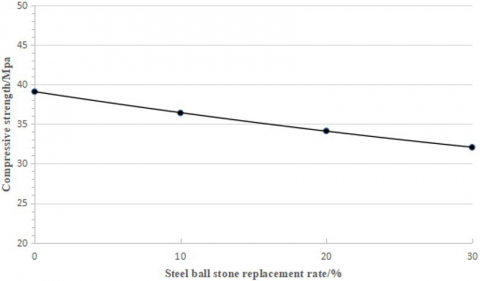
Based on the data in the table above, the P-n curve graph of the relationship between the compressive strength P and the steel ball replacement rate n was drawn (Figure 5), in which the discrete point is the compressive strength of the concrete test block measured in the test, and the curve shows the fitting of discrete points.
Figure 4. Damaged concrete test blocks
Table 6. Compressive strength test
|
Working condition |
Steel ball replacement rate (%) |
Compressive strength of test block 1(Mpa) |
Compressive strength of test block 2 (Mpa) |
Compressive strength of test block 3 (Mpa) |
Average value of compressive strength (Mpa) |
|
A |
0 |
35.24 |
44.51 |
37.61 |
39.12 |
|
B |
10 |
36.97 |
38.13 |
34.16 |
36.42 |
|
C |
20 |
26.62 |
41.01 |
34.96 |
34.14 |
|
D |
30 |
37.26 |
28.52 |
30.41 |
32.06 |
Figure 5. Average compressive strength of phase change concrete with different steel ball replacement rate
Figure 5 shows that the compressive strength of concrete decreased linearly with the increase of the replacement rate of steel ball; when the replacement rate reached 30% in the working condition D, the concrete strength grade can still meet the C30 design strength requirement. The main reason is that the strength of the phase change steel ball itself is not as good as the crushed stone, and the non-directional distribution of the steel ball in the concrete and the low surface roughness of the steel ball lead to poor adhesion to the concrete, thereby reducing the concrete workability and compressive strength.
As above, the relationship between the compressive strength P and the replacement rate n can be fitted. It’s expressed as shown in formula (5):
$P=-0.2344 n+38.952 \\ R^{2}=0.9964$ (5)
where:
P-Compressive strength of steel ball phase change concrete test block, Mpa;
n-Replacement rate with steel balls, %;
R2-Coefficient of determination.
5.2 Thermal conductivity measurement
The standard concrete slabs of 300mm×300mm×300mm were selected as the test blocks of the thermal conductivity. The test blocks were divided into 4 groups according to the different mixing ratios. Each group includes three test blocks with the same mixing ratio, as shown in Figure 6. In order to reduce the test error, the average thermal conductivity of the three blocks in the group was taken in the test.
The thermal conductivity of steel ball phase change concrete was conducted according to the GB10294-2008 Thermal insulation-determination of steady-state thermal resistance and related properties-guarded hot plate apparatus. The test used NETZSCH HFM 436 Lambda heat flow thermal conductivity meter, and set the average temperature to 30°C, and the temperature difference between the upper and lower slabs to 20°C. The test results are shown in Table 7. For the convenience of analysis, the data in Table 7 was drawn into a curve diagram of the steel ball replacement rate and the thermal conductivity of steel ball concrete (Figure 7).
Figure 6. Thermal conductivity test blocks
Figure 7. Curve diagram of thermal conductivity of steel ball phase change concrete
Table 7. Thermal conductivity and thermal resistance of steel ball phase change concrete
|
Working condition |
Steel ball replacement rate (%) |
Thermal conductivity (W/(m·K)) |
Thermal resistance ((m2·K)/W)) |
|
A |
0 |
0.2650 |
0.1416 |
|
B |
10 |
0.2766 |
0.1246 |
|
C |
20 |
0.2431 |
0.1462 |
|
D |
30 |
0.2483 |
0.1341 |
Figure 7 shows that the thermal conductivity of concrete first increased and then decreased with the increase in the replacement rate of ball, while the thermal resistance first decreased and then increased. The reasons are mainly that with a few phase change steel balls added, the steel balls show a good heat conduction effect, causing the thermal conductivity to increase, and the thermal resistance to decrease; with the mixing amount of phase change steel balls increasing, the PCMs inside the steel balls begin to absorb a lot of heat, resulting in the decline of thermal conductivity and increase of the thermal resistance.
5.3 Simulation of heat transfer performance
5.3.1 Model assumptions and heat transfer theory
In order to study the heat transfer efficiency of phase change concrete, this paper simulates the working environment of phase change energy piles in summer of Norther China, i.e., taking the summer room temperature of 35℃ as the inlet water temperature, and the underground soil temperature of 15℃ as the outlet water temperature, and assuming that the pile density of different steel ball replacement rates is the same with the specific heat capacity. Also, the pile body and the upper and lower surfaces of the PE pipe in the pile-soil section are in adiabatic condition, and the soil around the pile can exchange normal heat with the natural environment. The Abaqus software was used to analyze the heat transfer of the pile-soil section within 0.5m below the pile top, and compare the heat transfer efficiency of the phase change energy pile with the ordinary energy pile.
The composite heat transfer model of the pile-soil section was established on the basis of two heat exchange methods such as surface-surface contact and surface heat exchange conditions, in which the former was used on the pile-soil contact surface and the pile-pipe contact surface, and the heat energy exchange is shown in formula (6); the fluid-solid contact surface adopts the latter, and the heat energy exchange is shown in formula (7):
$\rho_{\mathrm{s}} \mathrm{c}_{p} A_{p} \frac{\partial T}{\partial \mathrm{t}}=\mathrm{k}_{1} \nabla \bullet \nabla T$ (6)
$\rho_{\mathrm{f}} c_{p 1} A_{p 1} \frac{\partial T}{\partial t}+\rho_{\mathrm{f}} c_{p 1} A_{p 1} u_{0} \bullet \nabla T \\ \quad=\nabla \bullet A_{p 1} \lambda_{f} \nabla T+f_{D} \frac{\rho_{\mathrm{f}}}{2 d_{h}}\left|u_{0}\right|^{3}+Q_{\text {wall }}$ (7)
where, ρs: solid density, kg/m3; cp: solid specific heat, J/(kg·k); Ap: solid contact surface area, m2; k1: thermal conductivity of solid contact surface; $\nabla T$: heat transfer time, s; ρf: fluid density, kg/m3; cp1: specific heat of fluid, J/(kg·k); Ap1: fluid-solid contact surface area, m2; u0: fluid temperature, K; λf: fluid thermal conductivity, w/(m·K); fD: Darcy friction factor; dh: hydraulic diameter, m; Qwall: heat transfer through the wall of unit pipe length, W/m.
5.3.2 Model establishment and grid division
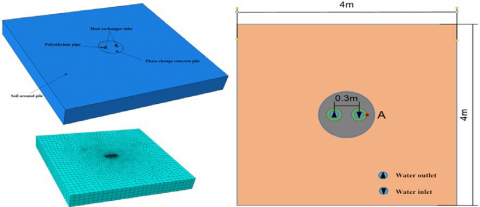
In order to study the specific heat conduction effect of phase change concrete, the single U-shaped buried pipe method was selected for the phase change energy pile model. The entire model used a pile-soil section 0.5m away from the top of the pile. The pile concrete was C30, with the pile diameter of 0.6m; the heat exchange tube used U-shaped polyethylene PE pipe with an outer diameter of 0.1m, a wall thickness of 5mm, and the distance of 300mm between the two limbs of the U- shaped pipe; the soil area around the pile was taken as 4m×4m×0.5m. According to the pile-soil heat transfer characteristics, the model was divided into three independent parts: soil, pile, and PE pipe for grid division. The soil was divided by a hexahedron structure, and the pile body and PE pipe were divided by a hexahedron sweep. The pile-soil contact surface and the pile-pipe contact surface were refined. Since this test was only for the heat transfer conditions of phase change energy piles, the simulation did not involve any mechanical constraints. The pile-soil section and grid division are shown in Figure 8. Point A is the contact point between the inlet pipe wall and the soil.
Figure 8. Schematic diagram of pile-soil section and grid division
5.3.3 Related parameters
This test simulated the working environment of the phase change energy pile in summer of northern China, with the inlet temperature of 35°C and the outlet temperature of 15°C. The relevant parameters of the PCMs used are shown in Table 8. According to assumption (1), the density of phase change concrete is 2.3×10³kg/m3, the specific heat is 0.837×10³J /(kg·k), and the thermal conductivity, as shown in Table 7; the relevant parameters of the soil around the pile and the PE pipe are shown in Table 9.
Table 8. Parameters of phase change materials
|
Name |
Phase change latent heat (J/kg) |
Solidus temperature (℃) |
Liquidus temperature (℃) |
|
Butyl stearate |
1.073×10⁵ |
19 |
20 |
Table 9. Related parameters of phase change energy pile
|
Name |
Density (kg/m3) |
Thermal conductivity (w/(m·K)) |
Specific heat (J/(kg·k)) |
|
Pile soil |
1.74×10³ |
2 |
1.55×10³ |
|
PE pipe |
0.95×10³ |
0.04 |
2.3×10³ |
Table 10. Latent heat of phase change concrete under different working conditions
|
Working condition |
Latent heat of phase change(J/kg) |
|
A |
0 |
|
B |
1.6945×10⁵ |
|
C |
3.389×10⁵ |
|
D |
5.0835×10⁵ |
The latent heat of phase change is the heat absorbed or released by the PCM under the phase change action. In this test, with different ratios of the PCMs, the latent heat of phase change also varied. The latent heat of phase change concrete with different steel ball replacement rates is calculated in formula (8):
$L=\frac{\mathrm{m}_{3}}{\mathrm{m}_{4}} \times L_{0} \times \mathrm{p}_{1}$ (8)
where,
L-Latent heat of phase change steel ball concrete, J/(Kg·m3);
m3-The mass of phase change steel balls per cubic meter of pile, Kg/m3;
m4-The mass of pile per cubic meter, Kg/m3;
L0-Latent heat of butyl stearate phase change, J/kg;
P1-Absorption rate of phase change material, %.
Table 10 lists the latent heat of phase change for phase change concrete under different working conditions.
5.3.4 Result analysis
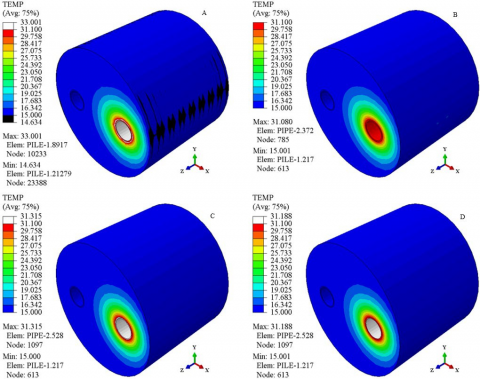
After 12 hours of heat exchange, the pile body in the pile-soil section of the phase change steel-ball concrete with different ball-replacement rates was changed in temperatures, as shown in Figure 9. It can be seen that water flowed in from the right pipe and out from the left pipe.
Figure 9. Temperatures of pile body after heat transfer for 12 hours
The heat transfer process follows the heat conduction test law, as shown in formula (8).
$\frac{\partial Q}{\partial t \partial S}=\mathrm{k}_{2}\left(u-u_{1}\right)$ (9)
where: $\frac{\partial Q}{\partial t \partial s}$ -the heat absorbed by the pile per meter per unit time, J/(s·m); k2-The heat exchange coefficient of fluid-solid contact surface; u-fluid temperature, K; u1-tube wall temperature, K.
Under the previous assumption that the specific heat capacity of the pile body is the same under different working conditions, the temperature change of the pile body is directly proportional to the absorbed heat; with the constant fluid flow rate unchanged, the lower the temperature of the inlet A, the better the heat transfer effect. Therefore, the temperature at point A of the water inlet was regarded as an index to measure the heat transfer efficiency, and record the temperature change at point A of the water inlet within 12 hours, as shown in Figure 10.
It can be seen from Figure 10 that there was little difference between the four working conditions in the first hour of heat exchange. At this stage, the PCM in the pile body underwent a phase change reaction to absorb heat but without reaching the phase change temperature, so no phase change reaction occurred; within 1-2h, the heat transfer efficiency of working condition A was low, and the PCM in the pile body absorbed more heat during the phase change reaction; within 2h to 10h, the heat transfer efficiency was ranked from high to low in terms of working conditions: B , D, A, C; in this stage, the ability of PCMs to absorb heat in the phase change reaction was gradually reduced, and some PCMs changed from solid to liquid; within 10-12h, the heat exchange efficiency was ranked from high to low: B, A, D, and C, the temperature of the pile body was close to a steady state, the temperature change speed was obviously reduced, and almost all the PCMs near the water inlet pipe became liquid. In the whole simulation process, the heat transfer efficiency under the working condition B was better than in other working conditions. Thus, the authors obtained the ball replacement rate of 10% for an optimal mix ratio of phase change steel ball concrete.
(a) 0-1h
(b) 1-2h
(c) 2-10h
(d) 10-12h
Figure 10. 0-12h temperature change at point A of the inlet
(1) The mass of butyl stearate adsorbed by the phase change steel ball was about 68% of the hollow steel ball, and the adsorption rate of the PCM was high. The permeability of the phase change steel ball after 6h cycles of 0℃ and 50℃ was 0.37%, indicating a good anti-permeability;
(2) The strength of phase change steel ball concrete is lower than that of ordinary concrete. The strength of concrete decreased linearly with the increase of phase change steel ball content. When the replacement rate of steel ball reached 30%, the strength decreases by 18%. Adding slag and fly ash can increase the strength.
(3) When the replacement rate of steel balls was 10%, the thermal conductivity of phase change concrete increased by 4%, and the thermal resistance decreased by 12%; when it reached 30%, the thermal conductivity of phase change concrete decreased by 8%, and thermal resistance increased by 3%.
(4) For the new phase change concrete energy pile, the optimal mix ratio is: steel balls replace 10% of the volume of the coarse aggregates, and the slag and fly ash content is 5% of the cementitious material mass respectively.
This paper was supported by Science and Technology Development Plan Project of Jilin Province (Grant No.: 20190303022SF).
[1] Darkwa, J. (2009). Mathematical evaluation of a buried phase change concrete cooling system for buildings. Applied energy, 86(5): 706-711. https://doi.org/10.1016/j.apenergy.2008.06.005
[2] Entrop, A.G., Brouwers, H.J.H., Reinders, A.H. (2011). Experimental research on the use of micro-encapsulated Phase Change Materials to store solar energy in concrete floors and to save energy in Dutch houses. Solar energy, 85(5): 1007-1020. https://doi.org/10.1016/j.solener.2011.02.017
[3] Wang, Q., Zhang, C.B., Ding, Z.Y., Liu, J. (2014). Study on the thermal properties of paraffin/ceramsite phase change concrete. Advanced Materials Research, 838: 91- 95. https://doi.org/10.4028/www.scientific.net/AMR.838- 841.91
[4] Ji, J., Liu, X.S., Tan, S.Y., Wang, M., Ni, W. (2019). Effect of thermal curing on slurry stability and thermal conductivity coefficient of aerated concrete based on industrial solid wastes. International Journal of Heat and Technology, 37(1): 296-302. https://doi.org/10.18280/ijht.370135
[5] Pilehvar, S., Cao, V.D., Szczotok, A.M., Valentini, L., Salvioni, D., Magistri, M., Pamies, R., Kjøniksen, A.L. (2017). Mechanical properties and microscale changes of geopolymer concrete and Portland cement concrete containing micro-encapsulated phase change materials. Cement and Concrete Research, 100: 341-349. https://doi.org/10.1016/j.cemconres.2017.07.012
[6] Ye, R.D., Zhang, C., Sun, W.C., Fang, X.M., Zhang, Z.G. (2018). Novel wall panels containing CaCl2 center dot 6H (2) O-Mg (NO3)(2) center dot 6H(2)O/expanded graphite composites with different phase change temperatures for building energy savings. Energy and Buildings, 176: 407-417. https://doi.org/10.1016/j.enbuild.2018.07.045
[7] Qu, Y., Chen, J., Liu, L., Xu, T., Wu, H., Zhou, X. (2020). Study on properties of phase change foam concrete block mixed with paraffin/fumed silica composite phase change material. Renewable Energy, 150: 1127-1135. https://doi.org/10.1016/j.renene.2019.10.073
[8] Kumar, M., Biswal, R., Kumar, A. (2019). Experimental investigation of solidification and remelting over cryocooled sphere using different concentrations of brine solution as phase change material. International Journal of Heat and Technology, 37(1): 22-32. https://doi.org/10.18280/ijht.370103
[9] Guo, Y., Zhang, G., Liu, S. (2018). Investigation on the thermal response of full-scale PHC energy pile and ground temperature in multi-layer strata. Applied Thermal Engineering, 143: 836-848. https://doi.org/10.1016/j.applthermaleng.2018.08.005
[10] Ramezanianpour, A.A., Malhotra, V.M. (1995). Effect of curing on the compressive strength, resistance to chloride-ion penetration and porosity of concretes incorporating slag, fly ash or silica fume. Cement and concrete composites, 17(2): 125-133. https://doi.org/10.1016/0958-9465(95)00005-W
[11] Wang, X.Y., Lee, H.S. (2010). Modeling the hydration of concrete incorporating fly ash or slag. Cement and concrete Research, 40(7): 984-996. https://doi.org/10.1016/0958-9465(95)00005-W