Mohammed R. Mandeel* | Ihab J. Abdulkadhim
© 2026 The authors. This article is published by IIETA and is licensed under the CC BY 4.0 license (http://creativecommons.org/licenses/by/4.0/).
OPEN ACCESS
Cloud computing provides significant computational and scalability advantages, nevertheless has high latency for delay sensitive applications like smart healthcare, industrial automation and the Internet of Things (IoT). Fog computing addresses this limitation by extending processing resources to the network edge, but faces challenges in resource allocation and task scheduling under heterogeneous and dynamic conditions. Software-defined networking (SDN) enhances fog environments through centralized, programmable control and global network visibility. This paper proposes an SDN-enabled fog computing framework that jointly leverages fog proximity and SDN programmability to minimize processing latency and improve task execution efficiency. The core contribution is an improved Whale Optimization Algorithm (iWOA), which replaces the fixed probability threshold of the classic Whale Optimization Algorithm (WOA) with a dynamic threshold adapted from the fitness improvement rate across iterations. Simulation results using Network Simulator 2 (NS-2) demonstrate that the proposed framework reduces average end-to-end latency by 15–30% over classic WOA and up to 40–50% over baseline methods, achieves balanced fog resource utilization of 75–88%, and maintains task success rates exceeding 94–97% at peak loads.
fog computing, cloud computing, software-defined networking, processing time threshold, load balancing, routing, threshold adaptation, Whale Optimization Algorithm
Software-defined networking (SDN) is a new approach to design networks that allows software applications to manage them in an intelligent and centralized manner. It also changes the way networks operate by splitting the data layer and the control layer into independent layers. This enables manage, control and optimize network resources through software programming. SDN has several advantages, like improved network performance, greater flexibility, and simplified network management. The data layer and the control layer are separated the same in SDN. The control layer makes decisions and collects network information, whereas the data layer forwards network traffic. This separation allows put all of your network control in a centralized controller that can automatically configure and manage network devices according to network requirements. SDN centralizes control so you can obtain a global view of the network at once. As a result, makes it more efficient to control traffic and allocate resources. SDN architecture is composed of three standard tiers: the data, control, and application layers. The application layer consists of the software that communicates with the SDN controller to set rules and requirements for the network. The control layer is responsible for determining how to forward and route network traffic and do other network tasks. The data layer, on the other hand, is in charge of actually sending and receiving network packets based on what the control layer tells it to do. SDN also has a number of benefits over traditional networking methods [1-3].
• It lets network admins change and optimize network resources on the fly based on changing needs, which makes the network work better and uses resources more efficiently. This makes it very hard to balance the load on the network.
• Programmable SDN makes it possible to make new network apps and services. This helps networks quickly come up with new ideas and make changes.
Load balancing is an important aspect of SDN because it allows for efficient distribution of network traffic across multiple devices. In SDN, Artificial Intelligence (AI)-based load balancing approaches have been developed to enhance learning capabilities and enhance network performance. These approaches use AI algorithms to dynamically distribute network traffic across multiple devices, which provides efficient resource utilization and improved application availability. Since SDN is software-based, it is easy to change policies in SDN that are less prone to errors, and since it is programming-based, complex functions in the network can be developed in simpler ways. Numerous research studies have focused on SDN-based load balancing. These studies cover various aspects, including the design and analysis of algorithms, SDN-enhanced load balancing techniques for cloud systems, and a novel SDN approach to load balancing in data center networks. The writers present a platform for discussing load balancing and other SDN-related topics. Overall, SDN-based load balancing is a promising approach to improve network performance and resource utilization, and with the increasing adoption of SDN in various industries, further research and development in this field is expected to enhance the capabilities and effectiveness of SDN-based load balancing [4, 5].
A multi-method load balancing technique [6-9] has been devised for network architectures to accommodate the access capabilities of wireless mobile devices with limited connections and links [10, 11]. These cases and scenarios can equilibrate the user distribution across two distinct bands by utilizing wireless spectrum resources, primarily aimed at alleviating network congestion. Nevertheless, load balancing [12] does not account for task processing in fog networks. This study proposes a dynamic load balancing method, using graph partitioning and repartitioning, to create a specific approach for virtual machine nodes. This method then provides services to users by using graph clustering and partitioning. This can also increase the load on other nodes, potentially impacting overall system performance. Effective performance monitoring and failure management mechanisms are crucial to ensure service continuity. Additionally, there exists a trade-off between network strength and network capacity. In this study, we propose a load balancing model that can reduce the response time and improve the quality of service in SDN. The model uses a new optimization algorithm that effectively implements and uses the load distribution coefficient.
This paper is structured as follows: Section 2 examines the prior studies and investigations pertaining to the topic. Section 3 explains the concept and theoretical framework of software-defined networks, including the principles of load balancing optimization and the proposed algorithm. Following this, Section 4 describes the simulation of the proposed methodology. Finally, Section 5 analyzes the results and offers a conclusion.
2.1 Load balancing mechanisms in software-defined networking
Load balancing methods are important for software networks because they help spread out new client demands across the network. A load balancing method can specifically reduce response time and packet loss rate, as well as increase resource utilization and reduce overhead. This approach can enhance reliability, scalability, packet delivery rate, and network longevity. These methods must be evaluated and contrasted to ascertain the most suitable solution for addressing the load balancing issue and to discern the advantages and disadvantages of each mechanism. Several metrics, referred to as quality parameters, including end-to-end delay, energy consumption, residual energy, and average packet delivery rate, must be assessed during the comparative analysis to ensure dependable results [13, 14].
2.2 Exploring AI-enabled software-defined networking load balancing
Metaheuristics are applied to solve real-world problems in these models. AI is made up of several areas such as deep learning, natural language processing, neural networks and AI-based decision-making methods such as binary search, decision theory. AI-based load balancing solutions enhance the learning capabilities and decision-making ability in SDN. This section of the paper reviews the methods proposed by authors and researchers in terms of implementation challenges and results. This paper also includes the distinctive characteristics of load balancing methods, including the protocol or algorithm, and explains the strengths and weaknesses of each. Moreover, existing load balancing solutions for SDN networks are classified into two major categories, and then sub-divided according to the model used. To conclude this section, a practical use of each model is introduced.
2.2.1 Nature- inspired load balancing methods
The term derived from the role and conditions in nature is used to describe a group of metaheuristic methods that are described or inspired by natural events. These algorithms reduce the total SDN load balancing waiting time and improve processing segment response time and resource completion time. In the study [15], the researchers introduced a dynamic load balancing technique utilizing the Particle Swarm Optimization (PSO) algorithm. This research presented a load balancing model for resource control and task execution in a peer-to-peer environment. This method proposed a fitness function for load balancing was proposed. The researchers stated in their paper that their proposed method reduces response time, improves throughput, and maximizes customer satisfaction. Therefore, the proposed method is only suitable for running applications with small data. In the study [16], the researchers balanced the loads of local optimal controllers under different conditions with the help of Total Fuzzy Particle Swarm Optimization (TFPSO), and a Markov chain model was used to predict the future load distribution. In addition, a support vector machine classifies the flows based on their importance level. Simulation results showed that without classifying the flows based on priority, this method causes network overload. The authors of the study [17] proposed a dynamic approach utilizing the Swarm Optimization Algorithm (SSOA) to enhance efficiency. This method is distinguished by its dynamism, establishing optimal connections between converters and controllers while calculating and supplying the requisite number of controllers. This controller preserves data for the complete network architecture, facilitating the on-demand dynamic selection of alternative pathways. Moreover, it preserves data pertaining to link usage computation, path delay verification, and load data retention.
Several studies have applied hybrid AI techniques to improve load balancing in SDN. In the study [18], the Bacterial Foraging Algorithm (BFA) is combined with PSO to enhance exploration and exploitation for multicast routing. The works in studies [19, 20] employ combinations of Ant Colony Optimization (ACO), PSO, and genetic algorithms to improve routing speed, convergence, and packet delivery rate. Although these hybrid methods show performance improvements, they usually introduce high computational overhead and longer processing time. Similarly, Chang et al. [21] proposed a bacteria-inspired genetic network (SDWBIN) to satisfy quality of service (QoS) requirements, but consider only limited QoS factors. In the study [22], a genetic-based controller load balancing method is presented using an adaptive threshold for switch migration, which improves response time and migration efficiency; however, energy consumption and accurate threshold prediction are not addressed.
2.2.2 Machine learning based approaches load balancing
Some previous studies have suggested that the combination of machine learning techniques with SDN architectures can significantly improve the performance of routing and load balancing [23]. The authors propose an artificial neural network (ANN) based load balancing approach, where AI is applied to tune and optimize computer networks [24]. The proposed model relies on a comprehensive level of network knowledge and analysis. By using ANN, the network performance is predicted according to delay and traffic-related metrics among tasks, which helps in selecting the path with the lowest load. Similarly, an ANN-based load balancing mechanism for SDN is proposed in the study [25]. This investigation explores various network parameters intended to enhance transmission efficiency, including delay, overhead, hop count, packet loss, dependability, and bandwidth ratio. The algorithm assesses network congestion and selects the transmission route with minimal traffic. Experimental results demonstrate significant enhancements in latency, bandwidth utilization, and packet loss rates. Conversely, the methodologies presented in the studies [24, 25] are computationally intensive, thereby limiting their applicability to medium-sized networks or scenarios where they represent the optimal solution.
In the study [26], the authors used backpropagating artificial neural networks (BPANN) and K-means clustering algorithm to predict the availability of network devices to consumers. The proposed model has one output node, four input nodes and three hidden nodes. This framework enables for the practical application of the load balancing method. The authors assessed the proposed method's performance against existing flow prediction methods, with emphasis on latency and load balance. The exclusion of some services in decision-making is a major limitation with this approach that could make it difficult to find the actual shortest path. In contrast, the study described in the study [27] proposed a novel approach to enhance data transfer and a sophisticated SDN-based architecture. The suggested approach is based on identifying the appropriate nodes and routes and forecasting traffic flow.
The approach tries to discover the ideal path by employing Q-learn and deep neural networks (DNNs). Simulation findings show that compared to traditional approaches, DNN-based systems are more efficient in handling complicated network traffic. Along with these benefits, important aspects such as scalability, dynamic topology variations, and packet loss are not fully addressed in this study.
3.1 Theoretical model of software-defined networking
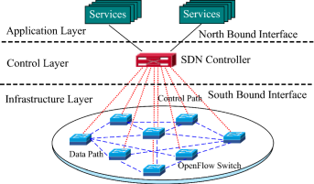
In software-defined networks [28], there are three main parts: the application part, the SDN control part, and the infrastructure part, also called the data part. The SDN structure and architecture also have a part called "applications." This part includes many applications, such as those that manage network traffic, balance load, and deal with security. Through the North Bridge Interface (NBI), the application part transmits its network requirements and appropriate behavior to the control part. This architecture is shown in Figure 1.
Figure 1. General software-defined networking (SDN) architecture [28]
Control layer software-defined networks comprise a centralized controller that utilizes predefined logic to interpret the requirements of incoming transactions for the data links within the SDN. In the network, an administrator can separate the control and data parts and then can change network policies and make the network fit business by software instead of hardware, thereby fostering a flexible and scalable infrastructure. The control layer is linked to the data component via a Southbound Interface (SBI), which serves as the interface between the two parts. SDN controllers aggregate general data, including throughput, load, and end-to-end latency, and can oversee operations to enhance load balancing. Consequently, software-defined network controllers offer open-source programming interfaces to facilitate network connections, resource management, and other functions through software applications.
The SDN data component, referred to as the dispatch center, comprises numerous network elements, including switches, among others. The current devices reveal the data path selection or routers and direct network traffic through the network. In this network configuration, the switches function as transmission devices that direct the transmission and reception as defined by the routing controller protocol. The SBI consists of two parts: the SDN control component and the data component that controls all transmissions according to a schedule.
The distribution of computational tasks and load balancing criteria is intricate, as it must consider equipment efficiency and the complex communication overhead to minimize latency.
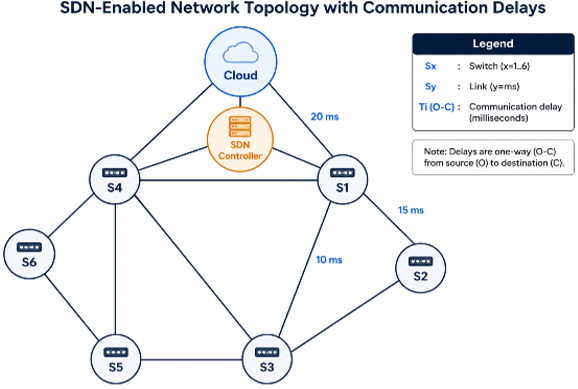
The undirected weighted SDN graph is shown in Figure 2. The current study is concentrated on load balancing technology as an intelligent routing protocol in SDNs. It emphasizes the requirement of reducing the response time. At the moment, the number of people using the Internet is constantly growing. This causes several web traffic, which in turn causes network congestion and packet loss. Despite this, managing server load is still very hard, and it often leads to unexpected service degradation.
Figure 2. Undirected software-defined networking (SDN) graph
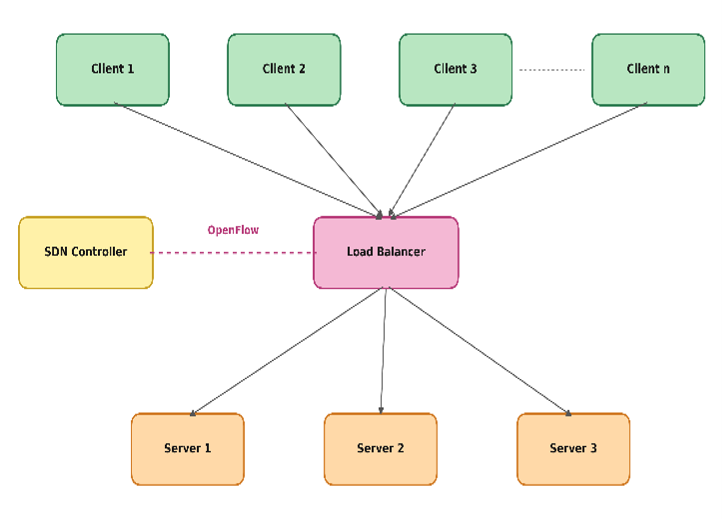
Figure 3 illustrates an overview of the load balancing strategy. This paper proposes a novel SDN-based load balancing model that incorporates optimization principles as its primary objective. The scenario under consideration includes end devices, fog nodes, cloud servers, and a SDN controller. According to graph theory principles, the SDCFN topology is represented as an undirected weighted graph defined as GR = {Sn, Sv}, where Sn = {S1, S2, …, Sk, SDN, cloud} denotes the set of vertices comprising virtual machines, the SDN controller, and the cloud server. Each node Si ∈ Sn represents a virtual machine, While SDN refers to the control unit, the cloud represents the cloud server. The edge group is defined as follows: Sv = {eS1, eS2, …, eSi, eSj, …, eSk−1, eSk, …, eS3, cs, eS4, cloud}, where Tli and Tlj stand for the communication link between two nodes. The cloud computing center is considered as a distributed computing node with its own processing capabilities for the improvement of the system performance via cloud computing. Similarly, CSi shows how much computing power node Si has, and TlSi and TlSj show how long it takes for nodes to talk to each other. When task L is sent from the end user to the switch, it is broken up into several smaller tasks, which are called Li.
Figure 3. Load balancing layout with software-defined networking (SDN) [29]
The subtasks are then forwarded to fog and cloud nodes for processing. The distribution node is involved in the task. Finally, all incomplete findings are aggregated and delivered to the end consumers. The overall latency investigated in this study is expressed in Eq. (1). TlSi,cloud denotes the transmission overhead between fog node Si and cloud node, while Si and Sj represent the fog nodes engaged in the communication.
$t\left(L_i\right)=\max \left(\frac{u_i}{C_{S_i}}\right)+T l_{S_i, S_j}, i, j=1,2, \ldots, k$ (1)
3.2 Whale Optimization Algorithm
3.2.1 Solution coding
This study suggests a new load-balancing model to cut down on delays. It does so by creating an optimization model that quickly figures out a load distribution coefficient a (time allocation (M) of the task in question, Li).
A novel enhanced optimization algorithm is proposed for this optimal selection. The solution provided for the proposed algorithm is illustrated in Figures 3 and 4.
Figure 4. Solution encryption
The primary aim of the proposed method is articulated in Eq. (2), In this context, "t" (LiCloud) refers to the latency of the cloud server. Based on the encoding process, the interface Li: i = 1,..., cloud is assigned to each time slot M1, M2,..., MN. When Li2 is scheduled to run in time slot M1, it does so first. Then, the task for time slot M2 runs. This allocation process reduces the time required by distributing the workload. The suggested optimization method regularly alters the task assigned to each slot, Mⱼ = 1, 2, ... N.
Due to the diversity of the allocation steps, based on the time fitness function.
$F=\max \left\{t\left(L_{i_1}\right), t\left(L_{i_2}\right), \ldots, t\left(L_{i_N}\right)\right\}$ (2)
3.3 Traditional Whale Optimization Algorithm
In this section, we first discuss how the proposed method is derived.
3.3.1 Derivation
Whales are the largest mammals globally and among the most remarkable creatures on the planet. An adult whale may reach lengths of up to 30 meters and weigh as much as 180 tons. There are seven primary species of these colossal animals: killer, minke, sei, humpback, right, finback, and blue. Whales are recognized as predators. They remain awake as they must surface to breathe. In fact, only half of their brain sleeps when they are resting. T Whales are regarded as the most emotionally intelligent animals, which is an intriguing fact. Whales possess unique cells in a particular region of their brain that are also present in the human brain [30, 31]. These cells are called Von Economo neurons (also known as spindle neurons). These neurons are responsible for judgment, emotions, and social behavior in humans. In other words, Von Economo neurons distinguish higher mammals from other creatures. Whales have twice as many of these cells as humans, which is considered a contributing factor to their high cognitive capacity. Research has shown that whales are able to think, learn, judge and communicate. They have emotional depth similar to that of humans, but at a much lower level of intelligence. It has been noted that whales, especially orcas, can develop their own dialects. Another interesting thing about whales is their social behaviour. They live alone and in groups. But they are mostly seen in groups. Some whales, like killer whales can live their whole lives within one family. One of the largest toothless whales is the humpback whale (scientific name Megaptera novaeangliae). An adult humpback whale is about the size of a school bus. Their preferred prey is krill and small fish. The most interesting thing about humpback whales is their unique hunting method. This feeding method is called bubble-net feeding [32]. Humpback whales prefer to hunt krill or small fish at the surface of the water. This feeding method has been observed to produce bubbles in a circular or figure-of-nine pattern. Before 2011, this behavior had only been observed on the surface of the water. The paper [33] investigated this behavior using signal sensors. The authors of the paper observed 9 humpback whales performing bubble-net feeding 300 times. They observed two maneuvers that were accompanied by bubble production, which they called the “upward twist” and the “double loop.” In the first maneuver, the humpback whale dives about 12 m underwater and begins to produce bubbles in a spiral pattern around the prey and swims upward. The second maneuver consists of three stages: the central loop, the lobtail, and the capture loop. More detailed information about these behaviors can be found in [33-38]. It is worth noting here that bubble-net feeding has only been observed in humpback whales. In this paper, the spiral bubble-net feeding maneuver is mathematically modeled for optimization.
A comprehensive survey of the Whale Optimization Algorithm (WOA) and its numerous variants and application domains is provided in the study [39], which situates the present improvement within the broader body of WOA research.
3.3.2 Mathematical model of Whale Optimizer Algorithm
This section presents the mathematical model of prey encirclement, bubble-net feeding maneuver, and prey search.
3.3.3 Prey encirclement
The humpback whale can discern the position of prey and encircle it. Given that the location of the optimal point within the search space is unknown a priori, the whale optimizer algorithm posits that the best current candidate solution represents the target prey or the point nearest to the optimal point. Once the optimal search agent is identified, the remaining search agents endeavor to adjust their positions in relation to the optimal search agent. This behavior is shown by the following relations [31, 40]
$D=\left|C \cdot X^*(t)-X(t)\right|$ (3)
$X(t+1)=X^*(t)-A \cdot D$ (4)
where, t is the current iteration, A and C are the coefficient vectors, X* is the position vector of the best solution obtained so far, X is the position vector, | | is the absolute value and the operation is point-to-point multiplication and it is essential to note that if a better solution exists, X* should be updated at each iteration [31, 40]. The vectors A and C are calculated as:
$A=2 a \cdot r-a$ (5)
$C=2 \cdot r$ (6)
where, a decreases linearly from 2 to 0 during the iterations (both in the exploration and extraction phases) and r is a random vector in the interval [0,1].
3.3.4 Bubble network attack method (extraction phase)
To mathematically simulate the behavior of the bubble network for humpback whales, the following two approaches are suggested:
$D^{\prime}=\left|X^*(t)-X(t)\right|$ (7)
$X(t+1)=D^{\prime} \cdot e^{b l} \cdot \cos (2 \pi l)+X^*(t)$ (8)
where, D′ = |X*(t) − X(t)| denotes the distance of the ith whale to the prey (the best solution obtained so far), b is a constant defining the logarithmic convolution shape, l is a random number in the interval [1, -1], and. is the point-to-point multiplication. Note that the humpback whales swim around the prey in a shrinking circle along the convolutional path. To model this synchronous behavior, we assume that there is a 50% probability that one of the encirclement or convolutional mechanism models is selected to update the whales’ positions during the optimization. The mathematical model is as follows:
$\vec{X}(t+1)=\left\{\begin{array}{l}\vec{X}^*(t)-\vec{A} \cdot \vec{D}, \text { if }, p<0.5 \\ \vec{D}^* \cdot e^{b l} \cdot \cos (2 \pi l)+\vec{X}^*(t), \text { if }, p \geq 0.5\end{array}\right.$ (9)
where, p is a random number in the range [0,1]. In addition to the bubble network method, humpback whales act randomly to search for prey. The mathematical model of the search is as follows.
3.3.5 Exploration phase (search for prey)
The same method, which involves altering the vector A, can be employed to seek prey (exploration). Actually, humpback whales conduct their searches at random in accordance with the positions of their peers. Consequently, we employ A with values greater than one or less than -1 to force the search agent to deviate from the reference whale. In contrast to the extraction phase, in the exploration phase we update the search agent's position with respect to a random search agent (instead of choosing the best search agent so far). This mechanism and A > 1 emphasize exploration and allow the whale's optimization algorithm to perform a global search. The mathematical model is as follows [31, 40]:
$D=\left|C \cdot X_{\mathrm{rand}}-X\right|$ (10)
$X(t+1)=X_{\mathrm{rand}}-A \cdot D$ (11)
where, Xrand is a random position vector (random whale) selected from the current population. The WOA begins with a collection of random responses. At each iteration, the search agents update their positions relative to a random search agent and the best response obtained thus far. To complete the exploration and extraction operation, the parameter a is reduced from 2 to 0. When | A | >= 1, the random search agent is chosen, and when | A | < 1, the best search agent is chosen to update the search agent positions. Depending on the value of p, the whale algorithm can switch between rotational and torsional motion. Finally, the whale algorithm terminates by satisfying the termination criterion.
3.4 Proposed algorithm
Despite the whale algorithm demonstrating competitive performance regarding reduced parameters and local non-optimality, A slow convergence speed is an obstacle for this. This study proposes an advanced algorithm by making ingenious changes to the traditional WOA to improve the convergence rate. In this version of WOA, the probabilities of spiral update and bait search are the same, i.e., th = 0.5. In real scenarios, they must be dynamic and depend on the quality of the improved solutions. If it was highly successful in the previous iteration, the probability of using the spiral update process should increase. The spiral update process should be terminated if it yields inadequate solutions. This paper tackles the issue by providing a dynamic threshold contingent upon the rate of enhancement in the fitness function value. The methodology underlying the proposed algorithm is as follows:
In the conventional WOA, the transition between spiral exploitation and prey-search behavior is governed by a fixed probability threshold of 0.5. However, in dynamic SDN-fog environments, a static threshold may not adequately reflect the current search progress. To address this limitation, the proposed improved Whale Optimization Algorithm (iWOA) introduces an adaptive threshold that is updated at each iteration based on the proportion of solutions whose fitness improves relative to the previous iteration. Specifically, the initial threshold is set to (th0 = 0.5), and the threshold is then updated according to Eq. (12), where (Nt) denotes the number of improved whales and (Pop) represents the population size. This adaptive rule makes the balance between exploration and exploitation responsive to the optimization progress, thereby accelerating convergence and improving load-distribution quality.
threshold$_t=\min(1, \max(0, th_0-\frac{N_t}{Pop}))$ (12)
The use of the reference value 0.5 preserves consistency with the original WOA, while the adaptive term modifies this baseline according to the observed improvement rate.
|
Algorithm 1. Pseudocode of the proposed iWOA |
|
Input: Objective function f(.), population Pop, maximum iterations T, initial threshold th0 = 0.5
Output: Best solution X*
1: Initialize Xi for all whales 2: Evaluate fitness values and determine X* 3: threshold ← th0 4: for t = 1 to T do 5: N ← 0 6: for each whale Xi do 7: f_old ← f(Xi) 8: Compute a, A, C, l and generate p ∈ [0,1] 9: if p < threshold then 10: if |A| < 1 then 11: Update Xi around X* 12: else 13: Update Xi around a random whale Xrand 14: end if 15: else 16: Apply spiral (bubble-net) updating 17: end if 18: Correct boundaries 19: Compute f_new = f(Xi) 20: if f_new < f_old then 21: N ← N + 1 22: end if 23: Update X* if Xi is better 24: end for 25: threshold ← min(1, max(0, th0 − N / Pop)) 26: end for 27: return X* |
In the proposed method, p is chosen randomly and compared with the dynamic threshold obtained from Eq. (12) instead of using the fixed threshold of 0.5 as in the traditional WOA.
To comprehensively evaluate the performance of a proposed SDN-enabled fog computing framework that utilizes an iWOA for intelligent task offloading and load balancing, a series of intensive simulations were conducted using the NS-2 network simulator (version 2.35). This simulation. The simulation environment was enhanced by adding C++ programming classes and TCL scripts, enabling centralized control mechanisms similar to an SDN architecture, management of processing queues in fog nodes, simulation of real-world task offloading flows, and periodic implementation of optimization decisions via the iWOA module integrated into the controller. The controller gathers network statistics every so often, such as the current load on each node, the length of the queues, and the average latency. With this information, the iWOA algorithm is used to find the best load distribution settings for the fog nodes and the cloud server. This makes the system run better and lowers latency. The simulations took place on a dedicated workstation that run Ubuntu 20.04 LTS and had an Intel Core i7 processor and 32 GB of RAM.
To ensure the reliability of the statistical results, each experimental scenario was repeated forty times, using a different random seed for each iteration The results are presented as mean values, and standard deviations are reported when necessary. The simulation was configured to represent real heterogeneous fog computing environment that would operate efficiently for Internet of Things (IoT) applications that require low latency, like intelligent health monitoring systems, industrial automation sensors, and intelligent vehicle edge services. To place the nodes at the appropriate distances, the simulation was represented as a 1200 x 1200-meter square. Initially, there were thirty fog nodes (though in scalability tests, the number could range from 15 to 60) to represent that edge servers have limited resources and are heterogenous. In addition, 200 user/IoT nodes (between 80 and 400 in different situations) were added to generate tasks. The environment also includes a central cloud server with large storage capacity and a single SDN-based control node. These two components provide full visibility of the network and helps make decisions about how to manage and optimize it. Tasks arrive in the system through a Poisson process, with an average of 8 to 40 tasks per second. This represents different levels of network load, including realistic intermittent flow patterns. The processing needs for each task were between 600 and 2800 million instructions per second (MI), with a normal distribution. This reflects the variability of IoT application workloads can be. The fog nodes’ processing power followed a normal distribution, with an average of 900 MIPS and a standard deviation of 180 MIPS, this approach introduced some realistic variability to the nodes.
In contrast, the cloud server's capacity was set to a fixed, relatively high value of 12000 MIPS. This allowed it to handle increased workloads when necessary. For the network architecture, bandwidths of 20 to 150 Mbps were set aside for connections between users and fog nodes, and between fog nodes and the cloud, depending on how far apart they were in the network. One-way propagation and link latency values ranged from 2 to 25 milliseconds, covering both short-range edge links and longer connections to the cloud.
Offloading traffic was modeled using 1200-byte packets on average, transmitted via UDP-like flows for task requests and reverse paths for results.
In order to mitigate the likelihood of packet loss during system overloads, the nodes implemented Drop Tail queuing with a custom buffer capacity of 500 packets. The duration of each simulation run was 800 seconds, which was sufficient to observe the behavior of the system in steady state and the changes in the load.
The iWOA optimizer could perform up to 120 iterations every 5–10 seconds in a group of 40 whales and the dynamic threshold started at 0.5 and varied according to the rate at which solutions got better with each iteration. Compared to the traditional fixed-threshold WOA, this made the process quicker and more flexible.
We compared the proposed iWOA-based method against three baseline approaches: a traditional cloud-only offloading strategy (where all tasks are sent directly to the cloud, incurring high latency), a simple greedy nearest-fog assignment (selecting the closest available fog node without optimization, prone to imbalance), and the standard classic WOA approach (using a fixed p = 0.5 probability without dynamic adaptation).
Three main metrics that are frequently used in SDN-fog load balancing and task offloading studies were used to measure performance:
While Average End-to-End Latency is a crucial metric for delay-sensitive applications, it may not fully reflect the overall user experience. This experience can also be influenced by factors such as the design of the user interface and the responsiveness of the application. Additionally, the exclusive focus on Average Resource Utilization (ARU) may lead to the neglect of other critical components, including system scalability and fault tolerance, which are essential for the maintenance of resilient edge computing environments. The task success rate, which is the proportion of generated tasks that are successfully completed and results are delivered within a reasonable timeout threshold (five times the cloud-only baseline), includes failures brought on by congestion, queue overflows, excessive delays, or resource depletion.
These metrics are used to evaluate a system's reliability and robustness when it's under heavy load. The simulation results, shown in the accompanying figures, demonstrate the effectiveness of the proposed approach. The average end-to-end latency significantly decrease with higher task arrival rates, enabling more efficient offloading decisions that maintain processing proximity to users while avoiding overloaded nodes. Average fog resource utilization reaches stable and balanced levels, generally ranging from 75% to 88% under substantial demand, thereby maximizing the benefits of edge computing while avoiding persistent overload. The task success rate stays above 94% to 97%, even amidst peak arrival rates, outperforming the baseline methods that show decreases below 70% to 85% due to either imbalance or overload. These findings confirm that the dynamic threshold mechanism within iWOA enables more faster adaptation to network dynamics, resulting in reduced delays, improved resource utilization, and increased reliability within SDN-fog environments for applications sensitive to delay.
In this section, the results of the NS-2 studies of Section 4 are presented and discussed. The performance of the proposed SDN-fog framework based on the iWOA has been compared with three existing methods:
(1) A cloud-only offloading strategy, where all tasks go straight to the centralized cloud server, which results in higher latencies of longer communication path.
(2) A greedy nearest-fog assignment, which sends tasks to the nearest available fog node without any optimization, which can result in load imbalances and resource inefficiencies.
(3) The standard classic WOA, which uses a fixed probability threshold (p = 0.5) for switching between spiral updates and prey search, which lacks the dynamic adaptation mechanism that iWOA has. The comparative analysis highlights the efficiency of the dynamic threshold of iWOA, which is modified according to rate of solution enhancement. This adaptability facilitates more precise load distribution adjustments, thereby enhancing the system's responsiveness to network fluctuations.
This approach also accelerates convergence, which helps avoid the common issue of getting stuck in local optima. Standard deviations are typically 5-10% and are not displayed in the tables for the sake of brevity. But when they are relevant, they are addressed. The results are averaged over 40 simulation runs for each configuration. We analyze fluctuations in essential parameters: task arrival rates (spanning from 8 to 40 tasks/s, reflecting low to high load conditions) and the quantity of fog nodes (ranging from 15 to 60, evaluating scalability in diverse environments). Adaptation is limited by the speed of change.
5.1 Average end-to-end latency
The average end-to-end latency is the sum of the elapsed time between the creation of a task at an end-user or IoT node and the transmission of the computation results. It encompasses return path overheads, processing times at fog or cloud nodes, queuing times, and transmission delays. Applications that require immediate response, such as self-driving systems or real-time IoT monitoring, necessitate reduced latency. The proposed iWOA is highly effective due to its dynamic optimization of load distribution coefficients, which ensures that tasks are dispatched to underutilized fog nodes that are located closer to users. This reduces congestion and long-distance cloud transfers. The average end-to-end latency as a function of task arrival rate is reported in Table 1, and its dependence on the number of fog nodes is reported in Table 2.
Table 1. Average end-to-end latency (s) vs. task arrival rate
|
Task Arrival Rate (tasks/s) |
Cloud-Only |
Greedy Nearest-Fog |
Classic WOA |
Proposed iWOA |
|
8 |
2.45 |
1.72 |
1.34 |
1.15 |
|
16 |
3.18 |
2.45 |
1.78 |
1.42 |
|
24 |
4.02 |
3.21 |
2.05 |
1.68 |
|
32 |
4.75 |
3.98 |
3.12 |
2.45 |
|
40 |
5.62 |
4.80 |
4.15 |
3.12 |
Table 2. Average end-to-end latency (s) vs. number of fog nodes
|
Number of Fog Nodes |
Cloud-Only |
Greedy Nearest-Fog |
Classic WOA |
Proposed iWOA |
|
15 |
4.10 |
3.45 |
2.94 |
2.35 |
|
30 |
4.02 |
3.21 |
2.05 |
1.68 |
|
45 |
3.85 |
2.98 |
1.92 |
1.45 |
|
60 |
3.72 |
2.75 |
1.78 |
1.32 |
Overall, iWOA's dynamic threshold provides superior latency reductions (15–30% vs. classic WOA) by enhancing exploration-exploitation balance, especially in high-load or large-scale scenarios where classic WOA's static p = 0.5 leads to delayed optimizations.
5.2 Average resource utilization
The average resource utilization measures how efficiently edge resources are used by avoiding capacity wastage or overload, which can lead to failures. This is determined by calculating the average percentage of computing capacity (MIPS) utilized by all fog nodes during the simulation. To prevent hotspots, the ideal utilization values should range from 70% to 90% and be balanced accordingly. The iWOA utilizes optimized coefficients to uniform distribution, effectively avoiding the imbalances that can occur due to the greedy and gradual encouragement of adaptations of traditional WOA.
Table 3 presents the average resource utilization against task arrival rate, and Table 4 presents it against the number of fog nodes.
Table 3. Average resource utilization (%) vs. task arrival rate
|
Task Arrival Rate (tasks/s) |
Cloud-Only |
Greedy Nearest-Fog |
Classic WOA |
Proposed iWOA |
|
8 |
0 |
45 |
52 |
58 |
|
16 |
0 |
58 |
65 |
72 |
|
24 |
0 |
68 |
73 |
82 |
|
32 |
0 |
72 |
77 |
85 |
|
40 |
0 |
75 |
80 |
88 |
Table 4. Average resource usage (%) compared to the number of fog nodes
|
Number of Fog Nodes |
Cloud-Only |
Greedy Nearest-Fog |
Classic WOA |
Proposed iWOA |
|
15 |
0 |
72 |
76 |
85 |
|
30 |
0 |
68 |
73 |
82 |
|
45 |
0 |
65 |
71 |
80 |
|
60 |
0 |
62 |
70 |
78 |
Overall, iWOA's dynamic threshold provides superior latency reductions (15–30% vs. classic WOA) by enhancing exploration-exploitation balance, especially in high-load or large-scale scenarios where classic WOA's static p = 0.5 leads to delayed optimizations. As reported in Tables 3 and 4, iWOA maintains balanced fog utilization within the target 75–88% band under high demand, avoiding both persistent overload and resource underutilization, whereas the greedy and classic-WOA baselines drift lower as load or scale increases.
5.3 Task success rate
The task success rate is the proportion of tasks completed and delivered on time, defined based on five times the latency of the cloud-only baseline. This indicates the system's reliability despite challenges such as delays, interruptions, or high traffic load. For mission-critical applications, high success rates (exceeding 90%) are required. Adaptive balancing in iWOA avoids task accumulation, thus improving overall success. The task success rate versus task arrival rate is given in Table 5, and versus the number of fog nodes in Table 6.
Table 5. Task success rate (%) vs. task arrival rate
|
Task Arrival Rate (tasks/s) |
Cloud-Only |
Greedy Nearest-Fog |
Classic WOA |
Proposed iWOA |
|
8 |
98 |
96 |
97 |
99 |
|
16 |
95 |
92 |
94 |
98 |
|
24 |
90 |
85 |
88 |
96 |
|
32 |
82 |
72 |
80 |
94 |
|
40 |
78 |
62 |
75 |
95 |
Table 6. Task success rate (%) vs. number of fog nodes
|
Number of Fog Nodes |
Cloud-Only |
Greedy Nearest-Fog |
Classic WOA |
Proposed iWOA |
|
15 |
85 |
78 |
82 |
93 |
|
30 |
90 |
85 |
88 |
96 |
|
45 |
92 |
88 |
90 |
97 |
|
60 |
94 |
90 |
92 |
98 |
As Tables 5 and 6 show, the proposed iWOA consistently outperformed the standard WOA algorithm, showing improvements of 10% to 30% across different evaluation metrics. The observed improvement is attributed to the use of an adaptive thresholding approach. This method enhances the system's adaptability and enables a faster response to dynamic conditions. Consequently, the proposed framework offers a effective approach for supporting emerging applications that require both low latency and high efficiency. Further research could explore the impact of node mobility limitations or energy consumption in fog computing environments.
In this work, we proposed a fog computing framework based on the integration of SDNs with an enhanced version of the iWOA. This framework aims to address tackle multiple challenges in distributed computing systems, such as load balancing, efficient task offloading, and reducing overall latency. The obtained results indicate that the developed framework leads to considerable reduction in overall latency, an important factor in latency-sensitive applications, e.g., systems for autonomous vehicles, smart healthcare, and industrial automation. This vital goal is realized by combining the programmability and centralization of SDNs with the capabilities of fog computing, which brings computational resources closer to data sources.
This developed approach also addresses several limitations of conventional cloud architectures, particularly the high latency caused by geographic distance and limited bandwidth. This work mainly adds an adaptive thresholding mechanism to the standard iWOA making it better. According to the conventional WOA method, a fixed probability (p = 0.5) is applied to alternate between two main strategies: spiral bubble-net feeding a spiral bubble network and random prey searching. In the improved iWOA algorithm, an adaptive threshold is employed, calculated according to the variation of the fitness value over time, as shown in Eq. (12). This adaptive mechanism speeds up convergence, provides a better balance between the exploration and exploitation phases, decreases the probability of local optima, and enhances the system capability to adapt to dynamic variations in network parameters, task access, fog node capabilities, and communication costs.
(1) The experimental results demonstrates that the iWOA algorithm provides notable improvements in three main performance metrics: average overall response time, average fog resource utilization, and task execution success rate. This results further revealed a 15%-30% decrease in latency compared to other baseline methods under heavy workload conditions, such as 40 tasks arriving per second and up to 60 fog nodes.
(2) Improved resource utilization by 10–15%, maintaining high and balanced utilization (usually 75–88% under high load conditions) without too many node overloads or resource underutilization.
(3) The task success rates above 94–97% at peak load condition, compared to drops below 70–85% in baselines and 75–88% in classic WOA.
This indicates that the system is more reliable and capable of handling congestion, queue overflow events, and timeouts. The dynamic threshold increases exploration during stagnation phases and prioritizes promising search directions during rapid improvement periods, leading to these quantitative improvements. This suggests that load distribution coefficients can be optimized faster and more reliably in real-world SDN-fog scenarios.
For future edge-centric distributed systems that require low-latency and high-reliability service delivery, the presented framework improves the integration of metaheuristic optimization with SDN and fog technologies and can be deployed in real-world scenarios. By using fog resources close to data sources and end users, in conjunction with SDN's complete visibility for centralized yet programmable decision-making, this approach enhances quality of service (QoS), optimizes resource utilization, and decreases reliance on remote cloud infrastructure. Notwithstanding the encouraging outcomes, challenges persist and avenues for additional research exist.
The current model considers static or semi-static fog node capacities and insufficiently accounts for node mobility, energy consumption limitations, or security issues (e.g., secure offloading in adversarial settings). Furthermore, although NS-2 provides extensive data regarding packets, testing scalability on larger, real-world testbeds (such as Mininet with actual SDN controllers like ONOS or Ryu) or hybrid simulators could validate performance at substantial IoT scales. Future work may investigate hybrid metaheuristics (e.g., the integration of iWOA with reinforcement learning or other nature-inspired algorithms), energy-aware objective functions, multi-objective optimization (balancing latency, energy, and cost), the facilitation of mobile fog nodes in vehicular networks, and the incorporation of machine learning for predictive load forecasting. Overall, the integration of SDN, fog computing, and an enhanced WOA with dynamic threshold adaptation establishes a reliable, efficient, and scalable method for task management and load balancing in contemporary distributed networks. This study provides a foundation for developing intelligent, adaptable, and service-focused edge-cloud ecosystems. It has the potential to significantly influence emerging technologies that require real-time processing capabilities and extensive connectivity.
[1] Alhilali, A.H., Montazerolghaem, A. (2023). Artificial intelligence-based load balancing in SDN: A comprehensive survey. Internet of Things, 22: 100814. https://doi.org/10.1016/j.iot.2023.100814
[2] Prabakaran, S., Ramar, R. (2021). Software defined network: Load balancing algorithm design and analysis. The International Arab Journal of Information Technology, 18(3): 312-318. https://www.iajit.org/portal/PDF/May%202021,%20No.%203/19270.pdf.
[3] Kang, B., Choo, H. (2018). An SDN-enhanced load-balancing technique in cloud systems. The Journal of Supercomputing, 74: 5706-5729. https://doi.org/10.1007/s11227-016-1936-z
[4] Chakravarthy, V.D., Amutha, B. (2019). A novel software-defined networking approach for load balancing in data center networks. International Journal of Communication Systems, 35(2): e4213. https://doi.org/10.1002/dac.4213
[5] Hamdan, M., Hassan, E., Abdelaziz, A., Elhigazi, A., Mohammed, B., Khan, S., Vasilakos, A.V., Marsono, M.N. (2021). A comprehensive survey of load balancing techniques in software-defined networks. Journal of Network and Computer Applications, 174: 102856. https://doi.org/10.1016/j.jnca.2020.102856
[6] Ipek, E., Longnos, F., Xiao, S.H., Yang, W. (2018). Bit-level load balancing: A new technique for improving write throughput of deeply scaled STT-MRAM. IEEE Computer Architecture Letters, 17(2): 139-142. https://doi.org/10.1109/LCA.2018.2819979
[7] Kalaipriyan, T., Amudhavel, J., Sujatha, P. (2017). Whale optimization algorithm for combined heat and power economic dispatch. Advances and Applications in Mathematical Sciences, 17(1): 197-211. https://www.mililink.com/upload/article/2040438104aams_v171_nov_2017_a12_p197-211_t._kalaipriyan,_j._amudhavel,_p._sujatha.pdf.
[8] Karaboga, D., Basturk, B. (2008). On the performance of artificial bee colony (ABC) algorithm. Applied Soft Computing, 8(1): 687-697. https://doi.org/10.1016/j.asoc.2007.05.007
[9] Kouhdaragh, V., Amiri, I.S., Seyedi, S. (2018). Smart grid load balancing methods for efficient heterogeneous networks using the communication cost function. IET Networks, 7(3): 95-102. https://doi.org/10.1049/iet-net.2017.0103
[10] Taghizadeh, S., Bobarshad, H., Elbiaze, H. (2018). CLRPL: Context-aware and load-balancing RPL for IoT networks under heavy and highly dynamic load. IEEE Access, 6: 23277-23291. https://doi.org/10.1109/ACCESS.2018.2817128
[11] Yang, X.W., Xu, H.L., Huang, L.S., Zhao, G.M., Xi, P., Qiao, C.M. (2018). Joint virtual switch deployment and routing for load balancing in SDNs. IEEE Journal on Selected Areas in Communications, 36(3): 397-410. https://doi.org/10.1109/JSAC.2018.2815379
[12] G, B., Deepa, T.A. (2019). Job scheduling in cloud environments using lion algorithm. Journal of Networking and Communication Systems, 2(1): 1-14. https://publisher.resbee.org/jnacs/archive/v2i1/a1.html.
[13] Liu, J.Y., Yang, Q.H., Simon, G. (2018). Congestion avoidance and load balancing in content placement and request redirection for mobile CDN. IEEE/ACM Transactions on Networking, 26(2): 851-863. https://doi.org/10.1109/TNET.2018.2804979
[14] Liu, Y.B., Kuang, Y., Xiao, Y.P., Xu, G.X. (2017). SDN-based data transfer security for Internet of Things. IEEE Internet of Things Journal, 5(1): 257-268. https://doi.org/10.1109/JIOT.2017.2779180
[15] Govindarajan, K., Kumar, V.S. (2017). An intelligent load balancer for software defined networking (SDN) based cloud infrastructure. In 2017 Second International Conference on Electrical, Computer and Communication Technologies (ICECCT), Coimbatore, India, pp. 1-6. https://doi.org/10.1109/ICECCT.2017.8117881
[16] Manzoor, S., Hei, X.J., Cheng, W.Q. (2018). A multi-controller load balancing strategy for software defined WiFi networks. In Cloud Computing and Security. ICCCS 2018. Lecture Notes in Computer Science(), Springer, Cham. pp 622-633. https://doi.org/10.1007/978-3-030-00015-8_54
[17] Ateya, A.A., Muthanna, A., Vybornova, A., Algarni, A.D., Abuarqoub, A., Koucheryavy, Y., Koucheryavy, A. (2019). Chaotic salp swarm algorithm for SDN multi-controller networks. Engineering Science and Technology, an International Journal, 22(4): 1001-1012. https://doi.org/10.1016/j.jestch.2018.12.015
[18] Sahoo, S.P., Kabat, M.R. (2019). The Multi-constrained multicast routing improved by hybrid bacteria foraging-particle swarm optimization. Computer Science, 20(2): 245-269. https://doi.org/10.7494/csci.2019.20.2.3131
[19] Guo, A.P., Yuan, C.H. (2021). Network intelligent control and traffic optimization based on SDN and artificial intelligence. Electronics, 10(6): 700. https://doi.org/10.3390/electronics10060700
[20] Xue, H., Kim, K.T., Youn, H.Y. (2019). Dynamic load balancing of software-defined networking based on genetic-ant colony optimization. Sensors, 19(2): 311. https://doi.org/10.3390/s19020311
[21] Chang, Y.C., Cai, W.X., Jhuang, J.W. (2018). Bacteria-inspired communication mechanism based on software-defined network. In 2018 27th Wireless and Optical Communication Conference (WOCC), Hualien, Taiwan, pp. 1-3. https://doi.org/10.1109/WOCC.2018.8372712
[22] Khalili, D., Barekatain, B. (2022). GAJEL-DSDN: An intelligent hybrid genetic-Jaya-based switch migration algorithm for efficient load balancing in distributed SDNs. The Journal of Supercomputing, 78: 18091-18129. https://doi.org/10.1007/s11227-022-04591-4
[23] Xie, J.F., Yu, F.R., Huang, T., Xie, R.C., Liu, J., Wang, C.M. (2019). A survey of machine learning techniques applied to software defined networking (SDN): Research issues and challenges. IEEE Communications Surveys & Tutorials, 21(1): 393-430. 10.1109/COMST.2018.2866942
[24] Ruelas, A.M.R., Rothenberg, C.E. (2018). A load balancing method based on artificial neural networks for knowledge-defined data center networking. In Proceedings of the 10th Latin America Networking Conference, São Paulo, Brazil, pp. 106-109. https://doi.org/10.1145/3277103.3277135
[25] Patil, S. (2018). Load balancing approach for finding the best path in SDN. In 2018 International Conference on Inventive Research in Computing Applications (ICIRCA), Coimbatore, India, pp. 612-616. https://doi.org/10.1109/ICIRCA.2018.8597425
[26] Yang, C.T., Chen, S.T., Liu, J.C., Su, Y.W., Puthal, D., Ranjan, R. (2019). A predictive load balancing technique for software defined networked cloud services. Computing, 101: 211-235. https://doi.org/10.1007/s00607-018-0665-y
[27] Yu, C., Zhao, Z.F., Zhou, Y.F., Zhang, H.G. (2017). Intelligent optimizing scheme for load balancing in software defined networks. In 2017 IEEE 85th Vehicular Technology Conference (VTC Spring), Sydney, NSW, Australia, pp. 1-5. https://doi.org/10.1109/VTCSpring.2017.8108541
[28] Das, R.K., Pohrmen, F.H., Maji, A.K., Saha, G. (2020). FT-SDN: A fault-tolerant distributed architecture for software defined networks. Wireless Personal Communications, 114: 1045-1066. https://doi.org/10.1007/s11277-020-07407-x
[29] Babbar, H., Rani, S. (2021). Software-defined networking based load balancing using Mininet. In Proceedings of the Second International Conference on Information Management and Machine Intelligence. Lecture Notes in Networks and Systems, Springer, Singapore, pp. 69-76. https://doi.org/10.1007/978-981-15-9689-6_8
[30] Hof, P.R., Van der Gucht, E. (2007). Structure of the cerebral cortex of the humpback whale, Megaptera novaeangliae (Cetacea, Mysticeti, Balaenopteridae). The Anatomical Record, 290(1): 1-31. https://doi.org/10.1002/ar.20407
[31] Rana, N., Abdul Latiff, M.S., Abdulhamid, S.M., Chiroma, H. (2020). Whale optimization algorithm: A systematic review of contemporary applications, modifications and developments. Neural Computing and Applications, 32: 16245-16277. https://doi.org/10.1007/s00521-020-04849-z
[32] Kaur, G., Arora, S. (2018). Chaotic whale optimization algorithm. Journal of Computational Design and Engineering, 5(3): 275-284. https://doi.org/10.1016/j.jcde.2017.12.006
[33] Watkins, W.A., Schevill, W.E. (1979). Aerial observation of feeding behavior in four baleen whales: Eubalaena glacialis, Balaenoptera borealis, Megaptera novaeangliae, and Balaenoptera physalus. Journal of Mammalogy, 60(1): 155-163. https://doi.org/10.2307/1379766
[34] Goldbogen, J.A., Friedlaender, A.S., Calambokidis, J., McKenna, M.F., Simon, M., Nowacek, D.P. (2013). Integrative approaches to the study of baleen whale diving behavior, feeding performance, and foraging ecology. BioScience, 63(2): 90-100. https://doi.org/10.1525/bio.2013.63.2.5
[35] Yao, X., Liu, Y., Lin, G.M. (1999). Evolutionary programming made faster. IEEE Transactions on Evolutionary Computation, 3(2): 82-102. https://doi.org/10.1109/4235.771163
[36] Digalakis, J.G., Margaritis, K.G. (2001). On benchmarking functions for genetic algorithms. International Journal of Computer Mathematics, 77(4): 481-506. https://doi.org/10.1080/00207160108805080
[37] Molga, M., Smutnicki, C. (2005). Test functions for optimization needs. Technical Report, Wroclaw University of Technology, 101(48): 32. https://marksmannet.com/RobertMarks/Classes/ENGR5358/Papers/functions.pdf.
[38] Yang, X.S. (2010). Firefly algorithm, stochastic test functions and design optimisation. International Journal of Bio-Inspired Computation, 2(2): 78-84. https://doi.org/10.1504/IJBIC.2010.03212
[39] Gharehchopogh, F.S., Gholizadeh, H. (2019). A comprehensive survey: Whale optimization algorithm and its applications. Swarm and Evolutionary Computation, 48: 1-24. https://doi.org/10.1016/j.swevo.2019.03.004
[40] Mirjalili, S., Lewis, A. (2016). The whale optimization algorithm. Advances in Engineering Software, 95: 51-67. https://doi.org/10.1016/j.advengsoft.2016.01.008