Alex Sandria Jaya Wardhana![]() | Moh. Khairudin*
| Moh. Khairudin*![]() | Rustam Asnawi
| Rustam Asnawi![]()
© 2025 The authors. This article is published by IIETA and is licensed under the CC BY 4.0 license (http://creativecommons.org/licenses/by/4.0/).
OPEN ACCESS
Thermal overload protection is a fundamental function for ensuring the safety and reliability of electrical equipment under sustained overcurrent conditions. This study presents experimental validation and predictive modeling of the SEPAM 1000+ T20 thermal overload relay under cold and hot curve operating conditions defined by IEC 60255-149. A first-order thermal model was applied to determine alarm (ES1) and trip (ES2) thresholds, followed by laboratory testing to measure actual alarm and tripping times across multiple overload levels. The results showed strong agreement with theoretical predictions, with deviations consistently below 5%. A predictive model based on simple linear regression further confirmed this consistency, yielding a slope coefficient of 1.0039 and R² exceeding 0.98. These findings validate that the SEPAM 1000+ T20 relay operates within IEC performance limits, while demonstrating the importance of considering both cold and hot curve characteristics when configuring protection systems. The proposed predictive model provides a reliable framework for optimizing relay settings, minimizing nuisance tripping, and improving the reliability of industrial thermal protection schemes.
thermal overload protection, cold curve analysis, hot curve analysis, predictive modeling, IEC standard
Thermal overload protection plays a vital role in safeguarding electrical equipment against sustained overcurrent conditions that may cause overheating, insulation deterioration, and premature equipment failure [1-3]. Such protection is commonly implemented using thermal relays or electronic trip units, which simulate the thermal response of conductors and protected devices. These systems initiate alarms or disconnection actions before exceeding permissible temperature limits, in compliance with standards such as IEC 60947-4-1 [4]. In modern power systems, accurate estimation of operating times under different thermal and load conditions is essential to prevent equipment damage, enhance reliability, minimize downtime, and ensure adherence to international safety regulations [4, 5].
According to IEC 60255-149, thermal overload relays exhibit two characteristic responses: the cold curve and the hot curve. The cold curve represents the time–current characteristic when the relay operates from reference steady-state conditions with no prior load, typically resulting in longer tripping times. Conversely, the hot curve accounts for residual heating caused by a steady-state load current prior to overload, leading to shorter tripping times [6]. The shape and position of these curves are influenced by parameters such as the thermal time constant (τ), ambient temperature, and the equivalent heating current (Ieq), which considers additional heating effects from imbalance currents and harmonics. Accurate modeling of these characteristics is critical for configuring alarm thresholds (ES1) and trip thresholds (ES2), thereby achieving an optimal balance between operational continuity and thermal protection [6].
Although manufacturers provide standardized time–current characteristic data, discrepancies between theoretical predictions and actual relay performance remain common due to environmental conditions, manufacturing tolerances, and dynamic load variations [7-9]. These deviations may result in nuisance tripping or insufficient protection under overload scenarios, underscoring the need for empirical validation. To address this gap, the present study offers a novel contribution by experimentally validating the cold- and hot-curve performance of the SEPAM 1000+ T20 thermal overload relay, which incorporates ANSI 49RMS protection functionality and is widely deployed in industrial electrical systems. Unlike previous studies that often focus solely on cold curve or theoretical models, this study evaluates the relay’s performance under both cold and hot curve conditions, providing a more comprehensive understanding of the relay's behavior under varying thermal conditions. Using controlled laboratory conditions, alarm activation times (ES1) and trip times (ES2) were recorded for multiple overload levels and compared with predictions derived from first-order thermal models.
Furthermore, a regression-based predictive framework was developed, with statistical assumption tests confirming the model’s validity [10, 11]. This predictive model enhances the ability to optimize protection settings and provides a more accurate, reliable approach for configuring thermal protection systems in real-world applications. The findings of this research provide a refined basis for configuring protection settings and enhancing predictive accuracy in industrial thermal protection schemes.
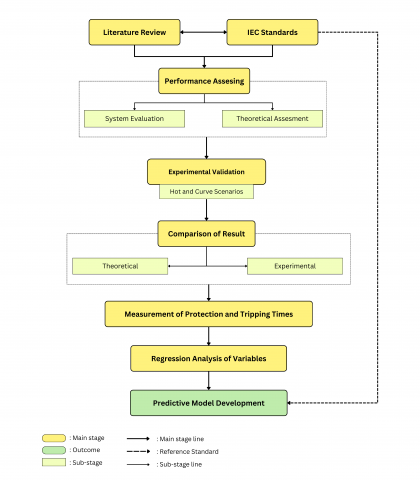
The research method employed in this study was designed to ensure both theoretical rigor and empirical reliability in evaluating the performance of the SEPAM 1000+ T20 thermal overload protection relay. The process began with a comprehensive literature review that synthesized prior studies on thermal overload protection mechanisms, particularly focusing on the characteristics of cold and hot curve operations as defined in IEC 60255-149. This stage established the conceptual framework, identified research gaps, and ensured alignment with international standards. Based on these foundations, theoretical modeling of overload behavior was developed by applying a first-order thermal system approach, incorporating key parameters such as the equivalent heating current (Ieq), the thermal time constant ($\tau$), and the protection thresholds for alarm (ES1) and trip (ES2). The flow of research method shown directly in Figure 1.
Figure 1. Research method
Following the theoretical assessment, the second stage of the research consisted of controlled laboratory experiments aimed at validating the predictive models. The SEPAM 1000+ T20 protection relay was subjected to a series of overload scenarios under both cold and hot curve conditions, simulating real-world operational environments [11]. Alarm activation times and tripping times were recorded for multiple overload levels, enabling direct comparison with theoretical predictions. The experimental configuration was carefully designed to replicate industrial operating conditions, with parameter settings for Ib, $\tau$, ES1, and ES2 adjusted according to standard requirements. This validation ensured that the deviations between theoretical and observed performance could be accurately quantified and attributed to identifiable factors such as system tolerances, environmental influences, or measurement variability.
The final stage of the research method involved statistical analysis to establish the reliability and predictive capability of the theoretical models. A simple linear regression framework was employed to analyze the relationship between calculated and experimental tripping times, supported by classical assumption tests including normality, linearity, heteroscedasticity, and autocorrelation diagnostics [12, 13]. These statistical procedures confirmed the robustness of the regression model, demonstrating that theoretical values could reliably predict experimental outcomes with minimal deviation [14, 15]. The integration of theoretical modeling, experimental validation, and statistical verification in this structured methodology ensures that the findings are not only technically accurate but also reproducible and generalizable, thereby contributing to the advancement of reliable protection schemes in industrial electrical systems.
This paper demonstrates the percentage deviations between theoretical calculations and experimental results were analyzed to assess the accuracy of the SEPAM 1000+ T20 protection relay under both cold and hot curve conditions. Deviations between theoretical and practical results are common in thermal overload protection systems [11]. For example, Wardhana et al. [16] reported 3–7% deviations in Overcurrent Relays (OCR), depending on load conditions and current injection methods. Similarly, Guo and Huo [17] found 2–6% deviations in relay protection performance, attributing discrepancies to calibration errors, environmental factors, and hardware limitations.
The findings are consistent with those reported in previous research, which also attribute deviations to environmental factors and system tolerances [18, 19]. Compared to the typical 3–7% deviations reported in similar research, the deviations in this study demonstrate strong alignment between theoretical and experimental results. Although the average deviation is below 5%, further investigation into the sources of these discrepancies is necessary to enhance the reliability of predictive models and optimize protection settings for industrial applications.
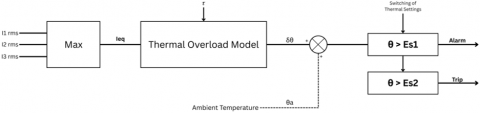
The block diagram in Figure 2 illustrates the thermal overload protection system for electrical equipment, utilizing the SEPAM 1000+ T20 protection relay. It starts by measuring the RMS values of the current (I1, I2, I3) from different phases, with the Max block selecting the highest current value to calculate the equivalent heating current (Ieq) [10]. The thermal overload model then simulates the temperature rise (θ) based on the thermal time constant ($\tau$) and Ieq, determining when the system reaches predefined thresholds for alarm (ES1) and trip (ES2). The system adapts to varying conditions through switching of thermal settings, which accounts for factors like insulation class and ambient temperature. Once the temperature exceeds ES1, an alarm is triggered, and if it surpasses ES2, the system initiates a trip to prevent damage. This diagram directly supports the study’s experimental approach, validating the protection relay’s performance under both cold and hot curve conditions by comparing theoretical and experimental tripping times and alarm activations.
Figure 2. Control’s system block diagram of thermal overload protection scenario
In the thermal overload model depicted in Figure 2, one crucial parameter is the thermal time constant $(\tau)$, which determines the rate at which the system’s temperature rises in response to overload conditions and governs the system's thermal behavior. The thermal time constant represents how quickly the system approaches thermal equilibrium after a change in temperature with the speed of this response is modeled by the equation:
$\theta(t)=\theta_{\infty}\left(1-e^{\frac{-t}{\tau}}\right)$ (1)
Eq. (1) defines $\theta(t)$ as the temperature at time $t,\left(\theta_{\infty}\right)$ as the steady-state temperature the system approaches after thermal equilibrium is reached. The term ($\mathrm{e}^{\frac{-t}{\tau}}$) describes the exponential approach of the system's temperature to this steady-state value, with the speed of this approach determined by the thermal time constant $(\tau)$.
In this study, the thermal time constant was experimentally determined by subjecting the system to controlled overload conditions and measuring the temperature rise over time. The experimental results were used to estimate $\tau$, ensuring that the theoretical model accurately reflects the observed thermal response. This allows for precise calculation of when the system will exceed the predefined alarm (ES1) and trip (ES2) thresholds, optimizing the protection relay's performance.
The alarm set point (ES1) and trip set point (ES2) for the thermal overload protection system are crucial parameters for ensuring the protection of electrical equipment. These thresholds are calculated based on the relationship between Ib and Ieq, with both values playing a critical role in determining when the system should trigger an alarm or initiate a trip. The ES1 is typically configured to trigger when the system detects a thermal rise exceeding 105% of the nominal current. The ES2 is set to prevent further damage to the system by disconnecting the equipment when the thermal rise reaches a higher threshold. This mechanism ensures that the equipment is protected from sustained overload conditions [20, 21].
The SEPAM 1000+ T20 thermal relay, used in this study, incorporates these principles by providing configurable time constants for heat rise and cooling processes. The thermal time constant (T) plays a pivotal role in determining the system’s thermal behavior, particularly in its response to overload conditions. Two time constants are defined: T1 for heat rise during equipment operation and T2 for cooling when the equipment is at rest. The t/T ratio, which relates the tripping time to the thermal time constant, is a key factor in predicting the system’s response.
The time constants, combined with ES1 and ES2, enable the SEPAM 1000+ T20 to offer dynamic, real-time protection that adapts to changing load conditions and thermal states. By accurately predicting the system’s behavior based on these parameters, the relay optimizes protection settings, minimizing the risk of nuisance tripping while ensuring the equipment’s safety [22]. This approach demonstrates the ability of modern thermal protection systems to provide reliable, efficient, and responsive protection, especially when subjected to real-world operating conditions [23, 24].
3.1 Analysis of relay performance under cold curve conditions
The cold curve analysis for the thermal overload protection system is based on the formula for tripping time (t), as derived from the first-order thermal system model. The formula for calculating t(Ieq) is expressed as Eq. (2) and is defined by the IEC 60255-149 standard. This equation characterizes the thermal behavior of the system under cold conditions, where no thermal pre-load exists [6, 24]. It accounts for the rate of temperature rise caused by overload currents, considering both the thermal time constant ($\tau$) and the equivalent heating current (Ieq). The cold curve operates under steady-state conditions, where the relay is initially at reference temperature, with no load current flowing prior to the onset of the overload condition.
$\mathrm{t}\left(\mathrm{I}_{\mathrm{eq}}\right)=\frac{\tau \cdot \ln \left(\mathrm{I}_{\mathrm{eq}}^2\right)}{\mathrm{I}_{\mathrm{eq}}^2-\left(\mathrm{k} \cdot \mathrm{I}_{\mathrm{B}}\right)^2}$ (2)
This equation serves as the theoretical basis for predicting alarm and tripping times, which are then compared to experimental results, as presented in Table 1.
In the cold curve analysis, the alarm threshold (ES1) was configured at approximately 105% of the nominal current (Ib), serving as an early warning indicator of thermal rise due to overload. Based on the theoretical model expressed in Eq. (2), the equivalent heating current (Ieq) of 1.1 A was expected to trigger an alarm at 242.78 seconds (CAC). Experimental measurements, however, indicated an alarm activation at 245.67 seconds (CAE), representing a minor deviation of 1.19% from the theoretical prediction. This close correspondence demonstrates the accuracy of the theoretical model in predicting early-stage thermal responses.
Table 1. Comparison of theoretical and experimental data based cold curve
|
Ib (A) |
Ieq (A) |
Calculated Alarm Time (s) (CAC) |
Experimented Alarm Time (s) (CAE) |
Deviation (%) |
Calculated Tripping Time (s) (CTC) |
Experimented Tripping Time (s) (CTE) |
Deviation (%) |
|
1 |
1.1 |
242.78 |
245.67 |
1.19 |
287.75 |
288.13 |
0.13 |
|
1 |
1.15 |
189.56 |
186.59 |
1.57 |
213.88 |
214.15 |
0.13 |
|
1 |
1.2 |
156.75 |
158.34 |
1.01 |
173.21 |
172.83 |
0.22 |
|
1 |
1.25 |
133.77 |
135.95 |
1.63 |
146.09 |
148.18 |
1.43 |
|
1 |
1,3 |
116.52 |
117.32 |
0.68 |
126.28 |
126.74 |
0.36 |
|
1 |
1.35 |
103.00 |
101.98 |
0.99 |
111.03 |
110.74 |
0.26 |
|
1 |
1.4 |
92.07 |
91.76 |
0.34 |
98.85 |
99.06 |
0.21 |
|
1 |
1.45 |
83.04 |
83.45 |
0.50 |
88.88 |
86.85 |
2.28 |
|
1 |
1.5 |
75.43 |
72.17 |
4.33 |
80.54 |
80.67 |
0.16 |
|
1 |
1.55 |
68.95 |
66.94 |
2.91 |
73.47 |
72.14 |
1.81 |
|
1 |
1.6 |
63.35 |
63.52 |
0.27 |
67.39 |
65.98 |
2.09 |
|
1 |
1.65 |
58.47 |
57.5 |
1.66 |
62.11 |
63.5 |
2.24 |
|
1 |
1.7 |
54.18 |
54.6 |
0.78 |
57.48 |
56.27 |
2.11 |
|
1 |
1.75 |
50.38 |
49.38 |
1.99 |
53.40 |
54.5 |
2.06 |
When no corrective action followed the alarm signal, the protection relay continued monitoring until the tripping threshold (ES2) was reached. The theoretical tripping time at the same Ieq level was calculated as 287.75 seconds (CTC), whereas the experimental test yielded 288.13 seconds (CTE), corresponding to a deviation of only 0.13%. The interval between alarm and trip events was therefore 44.95 seconds according to the theoretical model, compared to 42.46 seconds in the experimental observation. This marginal difference highlights the strong agreement between theoretical and empirical results, reinforcing the reliability of the protection scheme under cold curve conditions.
However, several factors must be considered to explain the minor deviations observed, particularly for higher Ib values, such as those at Ib = 1.5 A, where the alarm time deviation was 4.33%, and at Ieq = 1.45 A, where the tripping time deviation was 2.28%. One primary factor is the inherent limitations of measurement precision within any experimental setup. Small inaccuracies in the timing process, especially over several seconds, can contribute to observable discrepancies. These deviations, while minor, are within the tolerances typically accounted for in laboratory settings and reflect the inevitable uncertainties present in practical measurement systems.
Additionally, the observed discrepancies may arise from the thermal transients inherent in the relay system [25]. While the theoretical model assumes a steady-state thermal response, the actual behavior of the relay is subject to dynamic thermal effects, which are not fully captured by the first-order thermal model used in this study. Thermal transients, which refer to temporary deviations in the rate of temperature rise due to the thermal inertia of the system, can lead to faster or slower activation times [26, 27]. These transient effects are particularly significant at higher overload levels, such as Ieq = 1.45 A, where the thermal dynamics of the relay become more sensitive to changes in internal heat accumulation and the thermal time constant ($\tau$). As the system approaches higher temperatures, the rate of temperature rise is influenced by factors such as internal heating and the relay's ability to dissipate heat, leading to slight variances in response times.
Furthermore, environmental factors, particularly fluctuations in ambient temperature, can also contribute to the observed deviations [28]. Theoretical models generally assume constant ambient conditions, but in real-world testing environments, temperature variations can significantly affect the thermal response of the relay. These changes impact the thermal time constant (τ), which governs the rate of temperature change within the system, and consequently, the time required to reach the alarm (ES1) and trip (ES2) thresholds. Such environmental variations, although difficult to control precisely, are a known source of error in thermal testing and may explain some of the larger deviations, especially at higher current levels.
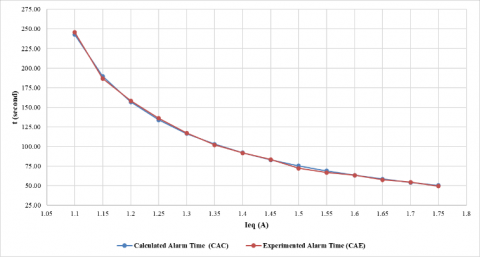
Figure 3. Alarm time based-cold curve
Figure 4. Tripping time based-cold curve
The comparative plots in Figure 3 (CAC vs. CAE) and Figure 4 (CTC vs. CTE) further confirm these findings by visually illustrating the near overlap of calculated and measured response times. The minimal discrepancies observed are consistent with expected tolerances in relay operation and can be attributed to measurement precision and environmental variability. Overall, the results demonstrate that the SEPAM 1000+ T20 relay operates within the prescribed performance limits defined by IEC standards, providing dependable thermal protection under cold curve conditions.
3.2 Analysis of relay performance under hot curve conditions
The hot curve analysis for the thermal overload protection system builds upon the same principles as the cold curve, with the critical difference being the consideration of the residual heating effect from a previous load. This phenomenon influences the time-current characteristic by shortening the permissible overload duration. The hot curve takes into account the thermal state of the equipment, which has already been subjected to a steady load after the overload condition occurs, as defined in IEC 60255-149. The residual heating effect (Ip2) represents the thermal energy retained by the relay from previous overloads, which accelerates the system's response to subsequent overloads.
In estimating Ip2, it is assumed that the relay retains thermal energy from prior overloads, which affects the system’s thermal response during a new overload. The model assumes a constant thermal time constant ($\tau$) and that the relay reaches a stable thermal state after the previous overload, allowing the system to respond more quickly to subsequent overloads. The theoretical formula for calculating the tripping time (t) in hot curve conditions is given by:
$\mathrm{t}\left(\mathrm{I}_{\mathrm{eq}}\right)=\tau \cdot \ln \frac{\mathrm{I}_{\mathrm{eq}}^2-\mathrm{I}_{\mathrm{p}}^2}{\mathrm{I}_{\mathrm{eq}}^2-\left(\mathrm{k} \cdot \mathrm{I}_{\mathrm{B}}\right)^2}$ (3)
Eq. (3) serves as the theoretical basis for predicting alarm and tripping times, which are then compared to experimental results, as presented in Table 2.
Table 2. Comparison of theoretical and experimental data based hot curve
|
Ib (A) |
Ieq (A) |
Calculated Alarm Time (s) (HAC) |
Experimented Alarm Time (s) (HAE) |
Deviation (%) |
Calculated Tripping Time (s) (HTC) |
Experimented Tripping Time (s) (HTE) |
Deviation (%) |
|
1 |
1.1 |
32.63 |
32.97 |
1.04 |
77.60 |
76.87 |
0.93 |
|
1 |
1.15 |
20.22 |
21.02 |
3.98 |
44.54 |
45.12 |
1.30 |
|
1 |
1.2 |
14.48 |
14.57 |
0.65 |
30.94 |
31.23 |
0.94 |
|
1 |
1.25 |
11.17 |
10.97 |
1.80 |
23.49 |
24.08 |
2.51 |
|
1 |
1,3 |
9.03 |
8.79 |
2.62 |
18.79 |
18.1 |
3.66 |
|
1 |
1.35 |
7.53 |
7.24 |
3.80 |
15.56 |
15.71 |
0.99 |
|
1 |
1.4 |
6.42 |
6.54 |
1.89 |
13.20 |
12.97 |
1.74 |
|
1 |
1.45 |
5.57 |
5.32 |
4.48 |
11.41 |
10.95 |
4.03 |
|
1 |
1.5 |
4.90 |
4.77 |
2.63 |
10.01 |
10.23 |
2.24 |
|
1 |
1.55 |
4.36 |
4.3 |
1.29 |
8.88 |
9.02 |
1.62 |
|
1 |
1.6 |
3.91 |
3.81 |
2.54 |
7.95 |
8.09 |
1.76 |
|
1 |
1.65 |
3.53 |
3.46 |
2.12 |
7.18 |
7.32 |
1.99 |
|
1 |
1.7 |
3.22 |
3.27 |
1.64 |
6.52 |
6.61 |
1.33 |
|
1 |
1.75 |
2.94 |
2.84 |
3.56 |
5.96 |
5.78 |
3.09 |
The hot curve analysis considers the residual heating effect (Ip2) resulting from prior load conditions, which significantly influences the relay’s thermal response. According to the theoretical model given in Eq. (3), when the equivalent heating current (Ieq) reached 1.1 A, the alarm was expected at 32.63 seconds (HAC). Experimental testing showed the alarm occurring at 32.97 seconds (HAE), representing a deviation of only 1.04%. This close alignment confirms that the theoretical model adequately captures the early-stage behavior of the relay under preheated thermal conditions.
For the tripping function, the theoretical calculation predicted that the system would trip at 77.60 seconds (HTC). The corresponding experimental value was 76.87 seconds (HTE), resulting in a deviation of 0.93%. The difference between the alarm and tripping events was therefore 44.97 seconds theoretically and 43.90 seconds experimentally. demonstrating that the hot curve maintains consistency between predicted and observed responses despite the elevated initial thermal state. These results underscore the significant impact of thermal memory, which accelerates the protection response compared to cold curve conditions. The residual heating current (Ip2) is a direct representation of this thermal memory, influencing the relay's response time by accounting for the preheated state of the system.
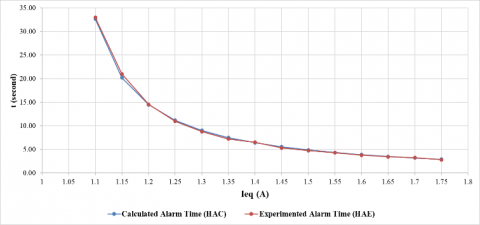
Figures 5 and 6 provide a graphical comparison of calculated and measured values for alarm and tripping times, respectively. These plots show a strong correspondence between theoretical and experimental data, with only minor deviations observed. Overall, the results validate that the SEPAM 1000+ T20 relay demonstrates reliable performance under hot curve conditions, in compliance with IEC standards. The findings also emphasize the importance of considering thermal history when configuring alarm (ES1) and trip (ES2) thresholds, as residual heating significantly impacts the relay’s response time.
Figure 5. Alarm time based-hot curve
Figure 6. Tripping time based-hot curve
3.3 Comparative evaluation of cold and hot curve characteristics
The comparison between hot and cold curve characteristics provides critical insight into the influence of initial thermal conditions on relay performance. Under hot curve operation, the relay responds from an elevated thermal state due to prior steady-state loading, whereas in cold curve operation it begins from a reference temperature with no pre-existing thermal load. This fundamental difference directly affects the relay’s time–current characteristics, resulting in faster alarm and tripping responses under hot curve conditions compared to the extended operating times observed in cold curve scenarios. To further illustrate these differences, Table 3 presents a side-by-side comparison of theoretical and experimental results for both cold and hot curve conditions. The data highlight the significant time variations in alarm and tripping responses, emphasizing the role of thermal memory in accelerating the system’s reaction under hot curve operation.
A comparative evaluation of cold and hot curve performance highlights the substantial influence of initial thermal conditions on relay response. As presented in Table 3, the cold curve at an equivalent heating current (Ieq) of 1.25 A triggered the alarm at 135.95 seconds (CAE), whereas under hot curve conditions the alarm occurred significantly earlier at 10.97 seconds (HAE). Similarly, the tripping times differed markedly, with the cold curve recording 148.18 seconds (CTE) compared to only 24.08 seconds (HTE) for the hot curve. These findings illustrate that the hot curve accelerates both alarm and tripping events due to residual heating, thereby reducing the permissible overload duration.
Table 3. Comparative evaluation of cold and hot curve
|
Ieq (A) |
CAE (s) |
CTE (s) |
Deviation of Alarm Time (%) |
HAE (s) |
HTE (s) |
Deviation of Tripping Time (%) |
|
1.1 |
245.67 |
288.13 |
0.13 |
32.97 |
76.87 |
0.93 |
|
1.15 |
186.59 |
214.15 |
0.13 |
21.02 |
45.12 |
1.30 |
|
1.2 |
158.34 |
172.83 |
0.22 |
14.57 |
31.23 |
0.94 |
|
1.25 |
135.95 |
148.18 |
1.43 |
10.97 |
24.08 |
2.51 |
|
1,3 |
117.32 |
126.74 |
0.36 |
8.79 |
18.1 |
3.66 |
|
1.35 |
101.98 |
110.74 |
0.26 |
7.24 |
15.71 |
0.99 |
|
1.4 |
91.76 |
99.06 |
0.21 |
6.54 |
12.97 |
1.74 |
|
1.45 |
83.45 |
86.85 |
2.28 |
5.32 |
10.95 |
4.03 |
|
1.5 |
72.17 |
80.67 |
0.16 |
4.77 |
10.23 |
2.24 |
|
1.55 |
66.94 |
72.14 |
1.81 |
4.3 |
9.02 |
1.62 |
|
1.6 |
63.52 |
65.98 |
2.09 |
3.81 |
8.09 |
1.76 |
|
1.65 |
57.5 |
63.5 |
2.24 |
3.46 |
7.32 |
1.99 |
|
1.7 |
54.6 |
56.27 |
2.11 |
3.27 |
6.61 |
1.33 |
|
1.75 |
49.38 |
54.5 |
2.06 |
2.84 |
5.78 |
3.09 |
Figure 7. Comparative behavior of alarm and trip times under cold and hot curve conditions
The time difference between cold and hot curve operations becomes increasingly pronounced with higher overload multiples. For instance, at Ieq = 1.5 A, the tripping time under cold curve conditions exceeded that of the hot curve by approximately 70,44 seconds. This behavior is consistent with the concept of thermal memory, in which the preheated state of the relay shortens its thermal capacity to absorb additional overload before reaching the protection thresholds. The comparative trends illustrated in Figure 7 clearly depict the divergence between cold and hot curve responses, with the hot curve consistently producing faster activation across all overload levels.
These results underscore the necessity of considering both cold and hot curve characteristics when configuring thermal overload protection systems. Reliance solely on cold curve data may overestimate allowable overload durations and compromise equipment safety under practical operating conditions. Incorporating hot curve behavior into protection settings ensures more accurate representation of real-world scenarios, thereby minimizing the risks of nuisance trips or insufficient protection. This comprehensive consideration ultimately enhances the reliability and effectiveness of industrial thermal overload protection schemes [29-31].
3.4 Predictive modeling of relay tripping time
A predictive model was developed to estimate the tripping times of the SEPAM 1000+ T20 thermal overload protection relay under both cold and hot curve conditions. The goal was to predict the actual experimental tripping times (HTE and CTE) based on theoretical calculations (HTC and CTC), essential for ensuring timely and efficient protection of electrical equipment.
The descriptive statistics for the variables used in the regression analysis, presented in Table 4, show a close alignment between the experimental and theoretical values. For example, the mean value of the cold curve alarm set calculation (CAC) is 106.30 seconds, while the experimental alarm time (CAE) is 106.08 seconds. Similarly, for the hot curve, the theoretical alarm time (HAC) and experimental alarm time (HAE) both have a mean of approximately 9.28 seconds, indicating minimal variation between calculated and observed results.
The model is derived from simple linear regression, as expressed in the equation:
$\mathrm{Y}=\beta_0+\beta_1 \mathrm{X}+\epsilon$ (4)
where, Y represents the experimental tripping time (either HTE for the hot curve or CTE for the cold curve), and denotes the theoretical tripping time (HTC for the hot curve or CTC for the cold curve). The parameter $\beta_0$ is the intercept, representing the expected experimental tripping time when the theoretical tripping time is zero. The coefficient $\beta_1$, known as the slope, quantifies the relationship between theoretical and experimental tripping times, reflecting how experimental times change in response to variations in theoretical predictions. Lastly, $\epsilon$ is the error term, accounting for deviations between predicted and actual tripping times due to factors like measurement errors or unmodeled influences. For the hot curve condition, the regression model is expressed as:
$\begin{gathered}\mathrm{Y}=\beta_0+\beta_1 \mathrm{X}+\epsilon \\ \mathrm{Y}=0,510392+1,003976 \mathrm{X}+\epsilon \\ \mathrm{HTE}=0,510392+1,003976 \mathrm{HT}\end{gathered}$ (5)
Eq. (5) indicates a near 1-to-1 relationship between the theoretical and experimental tripping times. The slope coefficient of 1.003976 suggests that the theoretical predictions are almost identical to the experimental results, validating the model’s accuracy for the hot curve. The intercept of 0.510392 reflects a small offset, which is typical due to system tolerances and measurement variability. The error term accounts for any discrepancies not explained by the model.
Table 4. Descriptive statistic of the variables
|
Variable |
Code |
Mean |
SD |
Min |
Max |
|
Cold curve alarm set calculation |
CAC |
106.30 |
56.87 |
50.38 |
242.78 |
|
Cold curve alarm set experiment |
CAE |
106.08 |
57.63 |
49.38 |
245.67 |
|
Cold curve tripping time calculation |
CTC |
117.17 |
67.98 |
53.40 |
287.75 |
|
Cold cuve tripping time experiment |
CTE |
117.12 |
68.26 |
54.50 |
288.13 |
|
Hot curve alarm set calculation |
HAC |
9.28 |
8.33 |
2.94 |
32.63 |
|
Hot curve alarm set experiment |
HAE |
9.28 |
8.52 |
2.84 |
32.97 |
|
Hot curve tripping time calculation |
HTC |
20.14 |
19.81 |
5.96 |
77.60 |
|
Hot curve tripping time experiment |
HTE |
20.15 |
19.73 |
5.78 |
76.87 |
Table 5. Results of assumption test
|
Test |
Statistic |
p-Value |
Conclusion |
|
Linearity |
Ramsey |
0.15241 |
Assumption satisfied |
|
Heteroscedasticity |
Breusch-Pagan |
15.302 |
Assumption satisfied |
|
Normality |
Shapiro-Wilk |
0.9656 |
Assumption satisfied |
|
Autocorrelation |
Durbin-Watson |
2.5245 |
Assumption satisfied |
According to Table 5, the assumptions of linearity, homoscedasticity, normality, and no autocorrelation were all confirmed to be satisfied. The Ramsey test for linearity yielded a p-value of 0.8606, indicating no violation of linearity. Similarly, the Breusch-Pagan test for heteroskedasticity returned a p-value of 0.2161, confirming the absence of heteroskedasticity. The Shapiro-Wilk test for normality also yielded a p-value of 0.8131, supporting the assumption of normality. Additionally, the Durbin-Watson test for autocorrelation showed a value of 2.5245, confirming the absence of autocorrelation in the residuals.
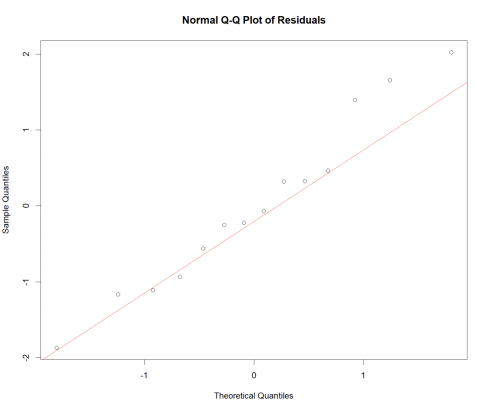
To visually assess the assumption of normality, a normal Q-Q plot of the residuals is presented in Figure 8. The plot shows the relationship between the theoretical quantiles of a standard normal distribution and the sample quantiles of the residuals. As observed, the residuals closely follow the diagonal line, confirming that the residuals adhere to a normal distribution, consistent with the results from the Shapiro-Wilk test for normality.
Figure 8. Normal Q-Q plot of residuals
These statistical results validate the robustness of the predictive model, confirming that the experimental tripping times (HTE and CTE) can be reliably predicted using the theoretical tripping times (HTC and CTC). The minimal deviations observed between the experimental and theoretical values further support the model's accuracy. This model provides a reliable framework for estimating tripping times in thermal overload protection systems, ensuring effective protection and minimizing the risk of unnecessary trips.
This study has presented a comprehensive evaluation of the SEPAM 1000+ T20 thermal overload protection relay under both cold and hot curve operating conditions. Experimental validation demonstrated a strong correspondence between theoretical calculations and measured performance, with deviations consistently remaining below 5%. The results confirmed that the relay operates within the tolerance limits prescribed by IEC standards, providing dependable protection against sustained overloads.
The comparative analysis revealed that residual heating significantly influences protection responses. Under hot curve conditions, the relay exhibited substantially shorter alarm and tripping times compared to cold curve conditions, highlighting the importance of thermal memory in determining operating characteristics. These findings underscore the necessity of incorporating both cold and hot curve data when configuring protection settings to avoid overestimating overload tolerance and to ensure accurate representation of real-world operating conditions.
Furthermore, the development of a regression-based predictive model provided a robust framework for estimating experimental tripping times from theoretical values. The model satisfied all classical statistical assumptions, with results indicating an almost one-to-one correspondence between calculated and observed data. This predictive capability offers practical value for optimizing relay configuration, minimizing nuisance tripping, and enhancing the reliability of thermal protection systems in industrial applications.
However, several limitations should be considered. The model presented here is based on the specific characteristics of the SEPAM 1000+ T20 relay, and its applicability to other relay types with different operational characteristics may require further validation. Additionally, environmental factors such as temperature fluctuations and humidity, which can influence thermal responses, were not fully explored in this study. These factors could affect the accuracy of the model in real-world conditions. Therefore, future research should extend this work by applying the proposed methodology to a broader range of protection devices and by exploring advanced predictive techniques, such as machine learning, to further enhance the accuracy and adaptability of overload protection schemes in dynamic industrial environments.
[1] Szamel, L., Oloo, J. (2024). Monitoring of stator winding insulation degradation through estimation of stator winding temperature and leakage current. Machines, 12(4): 220. https://doi.org/10.3390/machines12040220
[2] Wang, K., Guo, H., Xu, A., Pecht, M. (2020). Degradation monitoring of insulation systems used in low-voltage electromagnetic coils under thermal loading conditions from a creep point of view. Sensors, 20(13): 3696. https://doi.org/10.3390/s20133696
[3] Shi, Z., Druzhinin, Z. (2024). Development of 3-phase fault detection, protection, and automation application with the present of DG in AC power system using GOOSE protocol. Heliyon, 10(6): e27482. https://doi.org/10.1016/j.heliyon.2024.e27482
[4] Molęda, M., Małysiak-Mrozek, B., Ding, W., Sunderam, V., Mrozek, D. (2023). From corrective to predictive maintenance—A review of maintenance approaches for the power industry. Sensors, 23(13): 5970. https://doi.org/10.3390/s23135970
[5] Murtaza, A.A., Saher, A., Zafar, M.H., Moosavi, S.K.R., Aftab, M.F., Sanfilippo, F. (2024). Paradigm shift for predictive maintenance and condition monitoring from Industry 4.0 to Industry 5.0: A systematic review, challenges and case study. Results in Engineering, 24: 102935. https://doi.org/10.1016/j.rineng.2024.102935
[6] IEC 60255-149. (2013). Measuring relays and protection equipment - Part 149: Functional requirements for thermal electrical relays. International Electrotechnical Commission (IEC).
[7] Friederich, J., Lazarova-Molnar, S. (2024). Reliability assessment of manufacturing systems: A comprehensive overview, challenges and opportunities. Journal of Manufacturing Systems, 72: 38-58. https://doi.org/10.1016/j.jmsy.2023.11.001
[8] Maltauro, M., Meneghello, R., Concheri, G. (2024). Tolerance specifications management integrated into the product development cycle. Machines, 12(2): 147. https://doi.org/10.3390/machines12020147
[9] Dai, Y., Yu, B., Tao, X., Wang, X., He, S., Wang, G. (2024). Thermal displacement prediction of variable preload motorized spindles based on speed reduction experiments and IABC-BP optimization models. Case Studies in Thermal Engineering, 53: 103941. https://doi.org/10.1016/j.csite.2023.103941
[10] Easergy Sepam Series 80. https://www.se.com/hk/en/product-range/935-easergy-sepam-series-80/#products.
[11] Sepam serie 20. https://www.se.com/hk/en/product-range/933-sepam-serie-20/#products.
[12] Chen, H.Y., Chen, C. (2025). Importance of using modern regression analysis for response surface models in science and technology. Applied Sciences, 15(13): 7206. https://doi.org/10.3390/app15137206
[13] Ali, M., Deo, R.C. (2020). Modeling wheat yield with data-intelligent algorithms: Artificial neural network versus genetic programming and minimax probability machine regression. In Handbook of Probabilistic Models, pp. 37-87. https://doi.org/10.1016/B978-0-12-816514-0.00002-3
[14] Lim, W.M. (2025). What is qualitative research? An overview and guidelines. Australasian Marketing Journal, 33(3): 325-348. https://doi.org/10.1177/14413582241264622
[15] Hanisch, R.J., Gilmore, I.S., Plant, A.L. (2019). Improving reproducibility in research: The role of measurement science. Journal of Research of the National Institute of Standards and Technology, 124: 1-13. https://doi.org/10.6028/jres.124.024
[16] Wardhana, A.S.J., Damarwan, E.S., Bachrun, M.A.A., Hakim, M.L. (2025). Comparison of over current relay characteristics in electric power protection systems: A comparison of theory and practice. Journal of Engineering Science & Technology Review, 18(2): 172-177. https://doi.org/10.25103/jestr.182.21
[17] Guo, W., Hou, X. (2024). Research on the analysis method of power system relay protection action characteristics based on fault recording data. Journal of Radiation Research and Applied Sciences, 17(3): 101005. https://doi.org/10.1016/j.jrras.2024.101005
[18] Yazdaninejadi, A., Nazarpour, D., Golshannavaz, S. (2020). Sustainable electrification in critical infrastructure: Variable characteristics for overcurrent protection considering DG stability. Sustainable Cities and Society, 54: 102022. https://doi.org/10.1016/j.scs.2020.102022
[19] Valenta, L., Černý, I., Maternik-Demontoux, A. (2016). Power transformers and environmental protection. IFAC-PapersOnLine, 49(27): 18-22. https://doi.org/10.1016/j.ifacol.2016.10.693
[20] Syahruddin, M., Haq, M.Z., Putri, M., Indah, S.K., Azhari, S.K., Fiki, A., Roji, F. (2024). Power usage monitoring and overload protection system for distribution transformers. Global Journal Indexing, 2(10): 807-816. https://doi.org/10.59890/ijarss.v2i10.2591
[21] Wang, J., Wan, Y., Xiong, Z., Xiong, X., Ouyang, J. (2022). Cooperative overload control strategy of power grid-transformer considering dynamic security margin of transformer in emergencies. International Journal of Electrical Power & Energy Systems, 140: 108098. https://doi.org/10.1016/j.ijepes.2022.108098
[22] Bochkarev, I.V., Bryakin, I.V., Khramshin, V.R., Sandybaeva, A.R., Litsin, K.V. (2021). Developing new thermal protection method for AC electric motors. Machines, 9(3): 51. https://doi.org/10.3390/machines9030051
[23] Swift, G.W., Zocholl, E.S., Bajpai, M., Burger, J.F., et al. (2001). Adaptive transformer thermal overload protection. IEEE Transactions on Power Delivery, 16(4): 516-521. https://doi.org/10.1109/61.956730
[24] Ahmed, S.R., Mejbel, B.G., Abbas, A.A., Radhi, A.D., et al. (2024). Enhanced transformer overload power protection with small transient period differential relay control. In 2024 International Congress on Human-Computer Interaction, Optimization and Robotic Applications (HORA): Istanbul, Turkiye, pp. 1-4. https://doi.org/10.1109/HORA61326.2024.10550453
[25] Li, B., Liang, H., Li, P., Li, Y., Wang, A. (2024). Equivalent heat source model of thermal relay contact based on surface roughness of silver–magnesium–nickel contact. Materials, 17(22): 5583. https://doi.org/10.3390/ma17225583
[26] Kočí, V., Šesták, J., Černý, R. (2022). Thermal inertia and evaluation of reaction kinetics: A critical review. Measurement, 198: 111354. https://doi.org/10.1016/j.measurement.2022.111354
[27] Šesták, J. (2021). Dynamic character of thermal analysis where thermal inertia is a real and not negligible effect influencing the evaluation of non-isothermal kinetics: A review. Thermo, 1(2): 220-231. https://doi.org/10.3390/thermo1020015
[28] Baishya, L., Patowary, P., Saikia, D. (2024). Temperature fluctuations in power conductors: Analysis and overcurrent relay adaptation strategies for mitigation. International Journal for Multidisciplinary Research, 6(3): 1-9. https://doi.org/10.36948/ijfmr.2024.v06i03.19641
[29] Islam, K., Kim, D., Abu-Siada, A. (2024). A review on adaptive power system protection schemes for future smart and micro grids, challenges and opportunities. Electric Power Systems Research, 230: 110241. https://doi.org/10.1016/j.epsr.2024.110241
[30] Yousaf, M., Jalilian, A., Muttaqi, K.M., Sutanto, D. (2022). An adaptive overcurrent protection scheme for dual-setting directional recloser and fuse coordination in unbalanced distribution networks with distributed generation. IEEE Transactions on Industry Applications, 58(2): 1831-1842. https://doi.org/10.1109/TIA.2022.3146095
[31] Blaabjerg, F., Yang, Y., Yang, D., Wang, X. (2017). Distributed power-generation systems and protection. Proceedings of the IEEE, 105(7): 1311-1331. https://doi.org/10.1109/JPROC.2017.2696878