Mohammad I. Jamadar![]() | Ravi Sekhar*
| Ravi Sekhar*![]() | Vijay Ramarao Yada
| Vijay Ramarao Yada![]() | Sandeep D. Rairikar
| Sandeep D. Rairikar![]() | Sukrut Thipse
| Sukrut Thipse![]()
© 2025 The authors. This article is published by IIETA and is licensed under the CC BY 4.0 license (http://creativecommons.org/licenses/by/4.0/).
OPEN ACCESS
This paper is focused on enhancing the existing dilute emission measurement system to accommodate the emission testing of vehicles operating with gasoline blends with methanol and ethanol, dedicated M100/E100 etc. India is moving towards achieving the E20 blend on the pan-country level by April 2025 with the initiations of NITI Aayog and exploring alternate fuels like 100% methanol and ethanol. Government of India is now focused on introducing the flex fuel vehicle (FFV) technology that supports the usage of higher ethanol blends. As per CMVR guidelines for M and N category vehicles with a gross vehicle weight less than 3,500 kg; a dilute emission measurement system is used to evaluate tailpipe pollutants and fuel economy. Most of the present emission systems are compatible with testing the vehicle till M15 and E20 blends. Beyond this percentage, usage of a test facility for M100, E100, and other flex-fuel vehicles, require certain modifications in existing test facility to maintain the precision and reliability of the results considering higher water content in exhaust and effect of condensation on emission measurement due to dilution. The modifications needed, implementation and their impact are experimentally briefed in the present paper.
dehumidifier, dilute emission system, E100, ethanol, flex fuel vehicles, M100, methanol, non-regulated emissions
Biofuel production units in Special Economic Zones (SEZs) and Export Oriented Units (EOUs) will receive promotion under the Make in India program [1]. The increased use of bio-ethanol as a renewable fuel in internal combustion engines can lead to remarkably reduce the net CO2 emissions of the vehicles [2]. The most commonly used liquid biofuels include bioethanol, which is primarily produced by the fermentation of sugars derived from crops such as corn, sugarcane, or lignocellulosic biomass, followed by distillation and dehydration [3]. The ethanol blending program is to support the increase in the usage of alternate fuel [4]. Bioethanol as an additive to engine fuels has become one of the key directions of research in automotive and combustion technology [5]. So, adoption of alternate fuels that is methanol and ethanol have proved to be beneficial in terms of reducing fossil fuel demand and greenhouse gas (GHG) emissions [6]. Other strategic factors for the local interest in higher E100 efficiency are the clean and sustainable solution for an increasing fuel demanding market by 2030 [7]. This is improving the demand to test and validate the E100, M100 or Flex fuel compliant vehicles.
The technical limitations of current facilities include unavailability of the heated RMU or heated sampling pipe, dehumidification of ambient air or heating to meet the test criteria, insulated tunnel to avoid heat dissipation due higher water content in exhaust of vehicles operated in M100 and E100 or flex fuel vehicles.
As the automotive manufacturers move towards the production of flex fuel vehicles, these vehicles need to meet the existing emission norms. The regulated emissions for flex fuel vehicles (ethanol blend up to 85%) will be carbon monoxide (CO), total hydrocarbons (THC), non-methane hydrocarbons (NMHC), nitrogen oxide (NOx), carbon dioxide (CO2) etc. Due to oxygenated fuel increase in the nitrogen oxide (NOx) emissions will be observed with higher blends. Due to the M100/E100/Flex fuel vehicle combustion characteristics the emission testing process poses numerous challenges. Methanol's or ethanol's combustion reaction results the water vapours, which eventually condenses and emissions like carbonyl compound, and create interference for measurement of NOx. It was observed that as we increase blending of ethanol or methanol, moisture content in the exhaust increases. Ethanol has both nonpolar and polar bonds, making it miscible to both gasoline and water. In addition, control of ethanol contamination by sulphates and chlorides during ethanol production is challenging [8]. This availability of the water in exhaust due to combustion characteristics also impact the measurement of unburned ethanol during non-regulated emission measurement. The dilute emission system is used for the testing of vehicles below 3.5 ton. Condensation of water vapour happens due to sudden exposure to ambient air of temperature ~25℃ at remote mixing unit (RMU) used for dilution of tail pipe emission. The availability of water in tail pipe dissolves pollutants and also creates the interference with measurement due to sensitivity of analyser to presence of water especially for NOx and non-regulated emission.
The advantage of present facility was availability of the heated cabinets for analysers and sampling bags which are maintained at 35℃. Condensation will cause inaccurate results and additionally emission analysers struggle to detect low concentrations due to availability of the water/ water vapours in exhaust.
Methanol and ethanol are a potential fuel for the automotive, marine and genset application considering the lower carbon content and cleaner combustion [9]. The low carbon content leads less soot during combustion will potentially reduce the carbon base emissions [10]. With E25 being used as a fuel in vehicles during the testing on dynamometer, the emissions results show a decline for CO, NMHC and NOX, and unburned ethanol and no significant changes for CO2 [11]. If the engines would be properly tuned up and modified to best suit the E100’s characteristics while maintaining the compression ratio, the vehicles can perform efficiently [12]. Experiments showed that in case of E100 bioethanol, the average temperature measured in stable operating conditions was significantly lower than in the case of E10 motor gasoline. [13]. Considering the advantages, necessary steps to be taken to overcome the challenges for the measurement of the exhaust emissions of vehicles operated on ethanol or methanol.
This paper explains modifications needed in existing test facility for measuring emissions for vehicles compatible with higher alcohol (methanol, ethanol etc.) blend with gasoline, E100, M100, flex fuel vehicles with experimental results.
Loos et al. [14] addressed significant challenges in measuring emissions from FFVs, particularly with high ethanol blends, by proposing modifications to testing methods, including the use of heated sampling lines significantly improved the measurement of water vapor concentration during emissions testing and transfer hoses to improve recovery rates of ethanol and other oxygenated compounds. Results demonstrated that heated sampling systems significantly enhanced the accuracy of water vapor, ethanol, and acetaldehyde measurements, particularly during cold-start conditions critical for achieving near-zero evaporative vehicle (n-ZEV) standards. The methodology involved testing vehicles on a dynamometer with diluted exhaust sampling and employing advanced analytical techniques like FTIR and DNPH cartridges for oxygenate analysis. Overall, the findings emphasize the necessity of heated systems for accurate emissions measurement. Cassiano et al. [15] utilized a comprehensive test procedure to evaluate vehicle emissions from a flex-fuel Nissan Versa in real operational conditions in Fortaleza, Brazil. The test involved on-road measurements using a five-gas analyzer, which was connected directly to the tailpipe to measure emissions of fuel blends (E27, E85 and E100), highlighting the impact of ethanol content on vehicle performance. Suarez-Bertoa et al. [16] evaluated various ethanol blends (10%, 15%, 75%, 85%) on flex-fuel vehicle using a chassis dynamometer for tail pipe emissions. Parameters monitored showed that emissions exceeded Euro 5a limits for E5 at 23℃, while compliance was achieved with winter blends at -7℃. Kar and Cheng [17] investigated organic gas emissions from a modern spark-ignition engine using various ethanol-gasoline blends and employed gas chromatography (GC) and fast flame ionization detectors (FID) for analysis. Results indicated that while GC and fast FID measurements agreed within 10% for pure gasoline, FID underestimated organic gas emissions as ethanol content increased, with only 10 identifiable species from pure ethanol compared to 85 from pure gasoline. An empirical correlation was developed to correct FID readings for the presence of oxygenates, achieving 90% accuracy when the ethanol volume fraction was known. The study highlighted the importance of accurate emissions measurement and correction methods for better understanding the impact of ethanol blends on engine emissions. Karavalakis et al. [18] assessed the impact of biodiesel blends on both regulated and unregulated emissions from modern diesel vehicles, focusing on nitrogen oxides (NOx), particulate matter (PM), and carbonyl compounds. Results indicated that NOx emissions generally increased with biodiesel blends, particularly during steady-state tests, while PM emission were higher during cold starts but showed reductions in specific driving cycles. Chaudhary and Subramanian [19] investigated the combustion and performance of E100 and M100 fuels for emission with respect to otto cycle at 3500 rpm, 3800 rpm and 4200 rpm for respective maximum torque. The performance emissions were improved with methanol and ethanol along with engine performance. Chen et al. [20] transformed a TCIC diesel engine into M100 engine by hardware modification and established simulation model of engine using the bench test data as the boundary condition. The higher-octane rating, explosion resistance etc. of fuel will helps to increase the compression ratio of the engine causes increase in power and fuel efficiency of the methanol engine. Pereira and Braga [21] used a conventional light duty vehicle to test ethanol and associated blends to evaluate vehicle performance and speed recovery. The E100 fuel results indicated that pure anhydrous ethanol (E100) showed the best performance, which can be attributed to its high-octane rating boost the engine performance.
3.1 Standard test cycles and ambient conditions
Table 1 shows the standard test cycles for BS-VI compliant vehicles depending on vehicle type as per the GSR 889 (E).
Table 1. Standard test cycle with vehicle type as per CMVR
|
Vehicle Type |
Test Cycle |
|
2 – Wheeler |
WMTC |
|
3 – Wheeler |
IDC |
|
4 – Wheeler |
MIDC |
During the test, the test facility to be maintained within ambient conditions laid down in Table 2 as per AIS 137. The test conditions must be continuously monitored during the test along the continuous recording of the ambient temperature and absolute humidity.
Table 2. Ambient test facility conditions
|
Parameters |
Details |
|
Vehicle soaking period |
6 to 36 hrs |
|
Engine coolant temperature |
± 2℃ of soak room |
|
Test facility temperature |
20-30℃ |
|
Absolute humidity |
5.5-12.2 (g H2O/kg dry air) |
3.2 Vehicle test setup and challenges with M100/E100
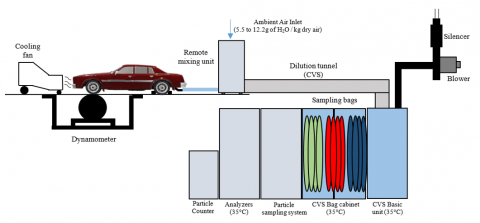
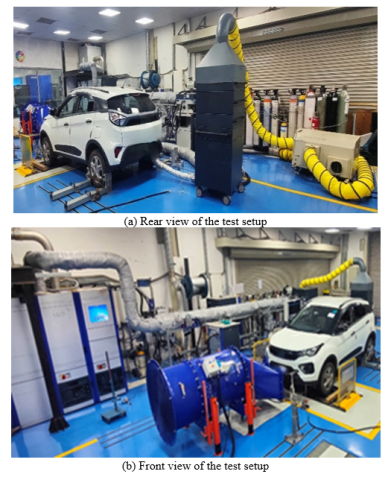
The present test setup was for assessing emissions from M and N category vehicles with a gross vehicle weight (GVW) not exceeding 3,500 kg. Figure 1 shows the layout of dilute emission testing bench for mass emission test for vehicles with GVW below 3.5 tons along. The vehicle emission and fuel economy test had performed as per the guidelines provided in AIS 137 simulating the real-world loading conditions with road load equation. The test bed consists of a chassis dyno with automation software, dilute emission bench along with constant volume sampling (CVS) system, particulate sampling system (PSS) for PM, remote mixing unit (RMU), dilution tunnel, filters and cooling fan, and controlled ambient temperature meeting requirement of AIS 137.
The test cell setup for the 2W and 4W vehicles is similar for the emission and fuel economy measurement except the size of roller diameter. The same test procedure was followed for the testing 2 and 4 wheelers. Also, challenges to test the M100 or E100 compatible vehicles are similar (2 or 4W).
3.2.1 Mass emission test procedure
The Figure 1 visualizes the mass emission test bench for conducting the Type - 1 test on vehicles below 3.5-ton gross vehicle weight (GVW) for measurement of mass emission along with fuel economy. When the vehicle was being tested the RMU functions as a unit, receives the raw pollutants from the vehicle's tailpipe and dilutes them with ambient air. This diluted mixture was directed to the analysers. During complete test, continuous emission sampling was conducted for bag measurement.
3.2.2 Challenges while evaluating M100/ E100 vehicles
In existing test setup of testing with M100/ E100/ FFV several challenges like condensation of water vapours during dilution are major concern due to higher alcohol content. During combustion, higher amount of water vapor is generated for vehicle operated with methanol/ ethanol or gasoline blends with alcohol higher that 15 to 20% when compared to gasoline or diesel. Factors that are affecting condensation of these vapours are dependent on humidity, pressure and temperature difference. As discussed above, for vehicles having gross vehicle weight up to 3.5 tons, the dilution emission test bench is used for measurement of the emissions and fuel economy [22]. Dilution system consists of few areas; that are prone to condensation due to immediate temperature change or loss of heat in dilution flow tunnel. Exhaust from the tailpipe of vehicle is diluted with the ambient air using RMU. At this instance, vehicle tailpipe gases directly come into contact with the ambient air (~25℃) that is significantly at a lower temperature as compared to the vehicle exhaust temperature. This sudden temperature difference causes the condensation of water vapour in exhaust and water content get accumulated between the tailpipe and RMU.
After dilution, the dilution tunnel is responsible for the homogenous mixture of ambient air and tailpipe exhaust. The sampling hose and dilution tunnel dissipate heat to atmosphere; which further helps condensation of the moisture inside the tunnel.
Solubility of pollutants in water. The complete combustion in the flex fuel or E100/ M100 vehicles will lead to the formation of the water. Figure 1 shows the schematic of the location for the possible formation of the condensation. The exhaust from tail pipe holding water vapours gets diluted with an ambient of ~25℃ and leads the condensation.
3.2.3 Observation in the baseline emission test
The Table 3 provided in 3.2.3 shows the details of the testing conducted on a vehicle with E100 and M100 for the tail pipe emission and represent the issue to detect the NOx emission due to availability of water in exhaust.
Figure 1. Test cell schematic before modification
Table 3. Baseline emission test results before test cell modifications
|
|
CO (mg/km) |
THC(C1) (mg/km) |
NMHC (mg/km) |
NOx (mg/km) |
|
E100 |
318.871 |
147.058 |
129.398 |
0.000 |
|
M100 |
263.154 |
47.96 |
44.328 |
0.000 |
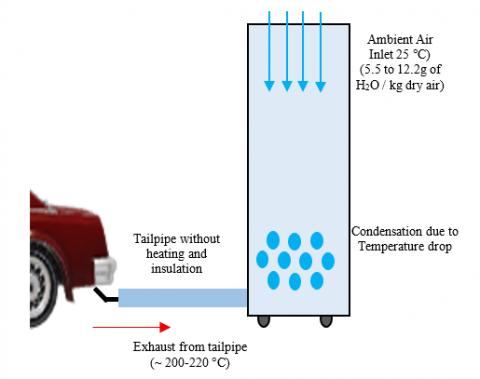
Current facility is equipped to handle vehicles < 3.5 ton. The main objective of present study is to highlight required modifications in current test facility to tackle vehicles operated with M100/ E100 / E85/ FFVs. Hence, a baseline test using an E100 & M100 vehicle was conducted to assess the existing facility's ability to measure tailpipe emissions accurately, specifically highlighting the impact of water vapor on tailpipe emission measurement. The schematic of the cause of condensation of the water in the RMU is highlighted in the Figure 2.
Figure 2. Illustration for occurrence of condensation
Type I emission test was conducted with vehicle operated on E100/ M100 fuel and it was observed that the NOX emission was not traceable. Also, in existing setup, the water accumulation at the dilution zone was observed.
3.2.4 Proposed solutions
Following are the proposed solutions to avoid the condensation before dilution.
(1) Restricting condensation: The air at a specific temperature has the capacity to retain moisture without condensation. The quantity of water vapor present in the air is influenced by the temperature and pressure of the air-water system. In this instance, condensation of water vapor occurs in a tailpipe and dilution tunnel. As the temperature decreases abruptly at the tailpipe, at some point the humidity would exceed 100% by resulting in condensation and formation of water. The temperature at which air can no longer hold moisture is known as the dew point. As the temperature decreases, the air capacity to hold moisture diminishes, leading to saturation at a lower moisture content.
The amount of moisture present in the air relative to its maximum capacity at given temperature is expressed as a percentage and is referred to as relative humidity. The relative humidity of the air in current test cell is maintained at 45% that is 8g H2O/kg dry air. Relative humidity depends on the portion of nitrogen which exists as diatomic N2 molecule, which is inert, it breaks into highly reactive nitrogen atom (N) at the combustion to form nitrogen oxide (NOX) at high temperatures. These oxides of nitrogen attribute to pollution effects like acid rain, due to its property to dissolve in water. Among all nitrogen oxides, nitric oxide (NO) and the nitrogen dioxide (NO2) are major constitutes of the engine combustion and nitrogen dioxide (NO2) shows higher solubility in water [23, 24]. In addition to nitrogen oxides, formaldehyde and acetaldehyde emissions also exhibit water solubility, but they are not regulated under the BS VI emission norms. However, they constitute a major portion of exhaust from ethanol and methanol fuelled vehicles. All the aldehydes are known to be carcinogenic in nature and are matter of health concern [24, 25]. The necessity to accurately measure vehicle emissions arises from the health hazards posed by both nitrogen oxides and lower chain aldehydes such as formaldehyde and acetaldehyde is necessary. Formation of the water could result inaccuracies in exhaust measurements of emissions with water- soluble property.
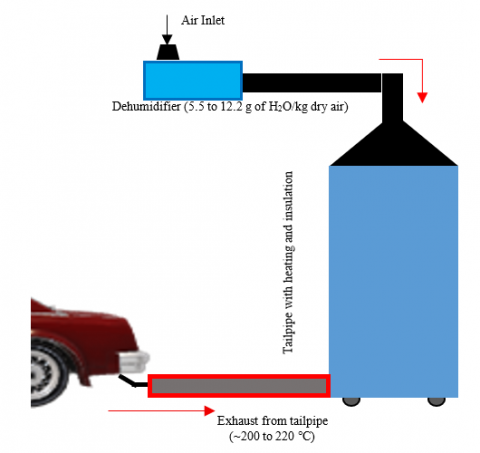
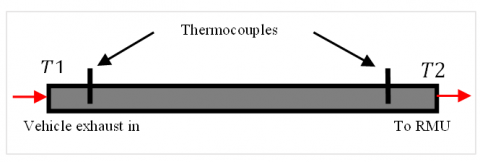
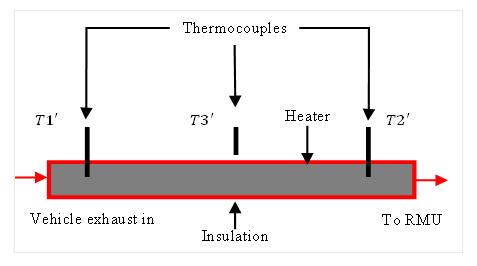
The condensation before dilution can be restricted by two ways, maintaining the air above dew point temperature and by reducing the humidity of the air using dehumidification as highlighted in Figure 3. For maintaining the temperature of exhaust gas above dew point, simultaneous heating and insulation was provided to the stainless-steel pipe connecting exhaust pipe and remote mixing unit. Temperatures were monitored using two thermocouples connected at inlet and outlet of the connection. The difference in temperature showed the effectiveness of heater and insulation.
Insulation was continued to the flexible hose and dilution tunnel that carry the mixture further to the sampling unit. This was done to reduce heat losses during the flow. The temperature range was maintained between 35℃ to 45℃ (maximum allowed limit for which is 52℃). Apart from the transport lines, the arrangements also need to be made during the sampling of diluted exhaust in storage unit and its passage through another test apparatus. During the test, online measurement of diluted exhaust was recorded and parallelly sample was stored in the heated sampling bags at ~35℃. This was implemented to avoid condensation inside sampling bags. The same care needs to be taken while analysing the sample for particulate matter.
(2) Reducing absolute humidity: Relative humidity of air at a certain temperature reaches 100% when it attains the saturation point. Further increases water vapour at that instance will cause condensation. So, reducing relative humidity seems to be the solution. This relative humidity can be lowered mainly by three ways i.e. dehumidification of the ambient air before dilution, increasing the temperature of air and increasing the volume of air. Since, the modern emission measurement system already uses ambient air for dilution of exhaust to maintain the homogeneity of mixture which indirectly increases the volume of air. The dehumidification process was initiated by drawing ambient air into dehumidifier unit. This air stream then traversed an evaporator coil, where it underwent a reduction in both humidity and temperature. Subsequently, the dehumidified air passed over a reheating coil, restoring its temperature. Finally, blending this processed air with ambient air further reduced relative humidity and increased the overall temperature of the exhaust stream by approximately 10℃. This controlled dilution elevated the saturation point, thereby avoiding subsequent condensation.
The de-humidifier was operated manually during testing of the vehicle. The temperature and the absolute humidity of the air was controlled within 20 to 30℃ and 5.5 to 12.2 g of H2O/kg respectively. The care was taken for not exceeding the ambient boundary conditions mentioned in the AIS 137 for the Type I emission testing.
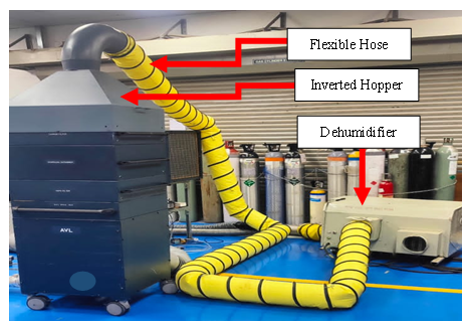
The schematic representation of the addition of the dehumidifier to avoid the condensation during dilution at RMU is shown in Figure 3. The dehumidifier specifications are listed below in Table 4.
Figure 3. Illustration of restricted condensation
Table 4. Dehumidifier’s specifications
|
Parameter |
Specification |
|
Airflow Capacity |
600 CFM |
|
Power Consumption |
10 kW |
|
Electrical Supply |
3 Phase, 415 V |
|
Unit Current Rating |
18 A |
|
Unit Weight |
75 kg |
|
Unit Dimensions (L×W×H) |
1044 × 730 × 555 mm |
|
Max Ambient Conditions |
65% RH at 25℃ |
|
Installation Mode |
Closed loop cycle |
4.1 Modifications adopted in test facility
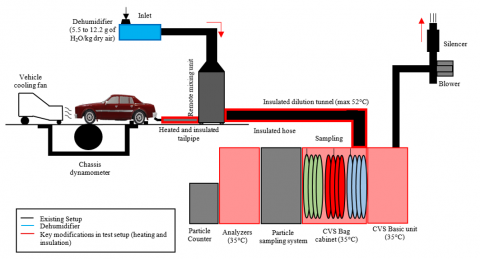
The schematic shown in Figure 4 and actual test facility modification in Figure 5 visualizes the test facility layout after performing modifications according to the proposed solutions in order to measure the alcohol-based fuels. The dehumidifier unit was connected with RMU unit to reduce the humidity of ambient air and increase the temperature. Heating and insulation were provided to the sampling pipe connecting vehicle exhaust and remote mixing unit (RMU). 2-No of thermocouples were connected at inlet and outlet of the sampling pipe to monitor the temperature variation before dilution. The dilution tunnel was insulated with heat shield to avoid heat loss through tunnel. This avoided the condensation during dilution at RMU and in dilution tunnel.
To prove the effectiveness of the upgraded system, few parameters need to be compared before and after implementing the changes. Emission tests of vehicle with fuel E85 and M100 were performed with listed modifications. The sampling pipe before dilution was instrumented for measurement and monitoring the temperature till RMU before dilution. The humidify in RMU as well CVS was monitored to maintain the boundary conditions of the standard test conditions. Additionally, the after-dilution hose to the dilution tunnel was also insulated along with dilution tunnel to avoid the condensation in complete path.
Figure 4. Test cell schematic after modification
Figure 5. Vehicle test set up for 4-wheeler
4.2 Calculations
4.2.1 Mass emissions of gaseous pollutants
The mass of each pollutant emitted by the vehicle during the test shall be determined by obtaining the product of the volumetric concentration and the volume of the gas. Mass emissions of gaseous pollutants shall be calculated by means of the following formula.
$M_i=\frac{V_{\operatorname{mix}} \times Q_i \times k_h \times C_i \times 10^{-6}}{d}$
$M_i$ is used to convert the ppm of the gas concentration present in the emission to mg/kg or g/kg. Here $C_i$ is concentration of pollutant in the diluted exhaust gas.
4.2.2 Correction for dilution air concentration
$C_i=C_e+C_d \times\left(1-\frac{1}{D F}\right)$
To obtain concentration of pollutant in the diluted exhaust gas the sum of diluted exhaust gas concentration and concentration of pollutant in the air used for dilution multiplied with factor of dilution factor.
4.2.3 Dilution factor
$\mathrm{DF}=\frac{X}{C_{\mathrm{CO}_2}+\left(C_{\mathrm{HC}}+C_{\mathrm{CO}}\right) * 10^{-4}}$
4.2.4 For a fuel of composition CxHyOz
$X=100 \times \frac{x}{x+\frac{y}{2}+3.76 *\left(x+\frac{y}{4}-\frac{z}{2}\right)}$
4.2.5 DF calculation for E85 and E100
The dilution factors for the E85 and E100 fuels can be obtained from the following equation:
for ethanol (E85)
$\mathrm{DF}=\frac{12.5}{C_{\mathrm{CO}_2}+\left(C_{\mathrm{HC}}+C_{\mathrm{CO}}\right) * 10^{-4}}$
for ethanol (E100)
$\mathrm{DF}=\frac{12.3}{C_{\mathrm{CO}_2}+\left(C_{\mathrm{HC}}+C_{\mathrm{CO}}\right) * 10^{-4}}$
4.2.6 Humidity correction factor for NOX
Relative humidity depends on the proportion of nitrogen which exists as diatomic N2 molecule which is inert. It breaks into highly reactive nitrogen atom (N) at the combustion to form nitrogen oxides (NOX) at high temperatures.
$K_h=\frac{1}{1-0.0329 *(H-10.71)}$
$H=\frac{6.211 * R_a * P_d}{P_B-P_d * R_a * 10^{-2}}$
The Mi (mass of emissions) is directly proportional to (humidity correction factor) kh which is a direct dependent on the test facility absolute humidity. Since kh is directly dependent on the test facility's absolute humidity, minimizing humidity reduces the emissions formation. Higher humidity inflates the dry gas volume, leading to of pollutant concentrations.
4.3 Methodology
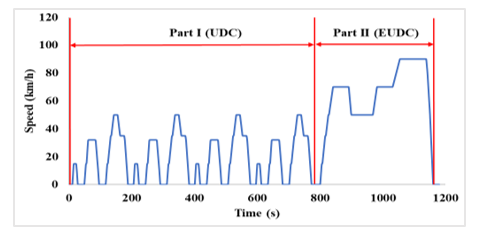
A BS VI compliant vehicle carrying vehicle was selected and after preconditioning, the vehicle was soaked before the mass emission test for 6 to 36 hours in soak room with temperature of 25℃ (± 0.5℃) as per procedure laid down in AIS 137. The vehicle temperature was measured by the engine oil and coolant temperatures were equal to or ± 3℃ of the surrounding temperature. The emission test was conducted in accordance with the modified Indian driving cycle (MIDC), the standard test cycle used in India to assess emissions from M and N category vehicles runs on gasoline and its blends. This cycle comprises two distinct phases; the first phase, known as the urban phase, restricts speeds to a maximum of 50 km/h and consists of cycles lasting 195 seconds each, referred to as the urban driving cycle (UDC). The UDC pattern repeats four times within the MIDC cycle. The second phase, the highway phase or extra urban driving cycle, allows speeds up to 90 kmph. The MIDC cycle spans a total duration of 1180 seconds.
Figure 6. Modified Indian driving cycle (MIDC)
The test facility was maintained at ambient conditions specified in AIS 137 (Part III) for e.g. absolute humidity (H) was maintained at 5.5 ≤ H ≤ 12.2 g H2O/kg dry air. The ambient test facility temperature specified in the standard procedure was between 20℃ and 30℃. The speed profile of MIDC cycle can be seen in Figure 6.
The modifications in the system were implemented to prevent condition where sudden temperature drop may be possible which cause the phase change and condensation. This section evaluates the results to determine whether water formation is effectively restricted through measures taken such as controlled heating, insulation & dehumidification. Two tests, E100 and M100 were performed on vehicles.
5.1 Sampling pipe modifications
The comparison of test results (with respect to MIDC shown in Figure 6) with and without a heated and insulated hose focuses to determine if the heated hose can minimize heat loss in the exhaust system, thereby maintaining exhaust gas temperature at the end of the tailpipe Figures 7 to 10 represent the modification in existing system. The exhaust gas loses the heat to surrounding if not maintained to certain temperature. This heat loss occurs due to the temperature difference between the exhaust gas and ambient. The exhaust gas continues to cool down until it reaches to tailpipe.
Figure 7. Line diagram of sampling pipe without heating and insulation
Figure 8. Sampling pipe without heating and insulation
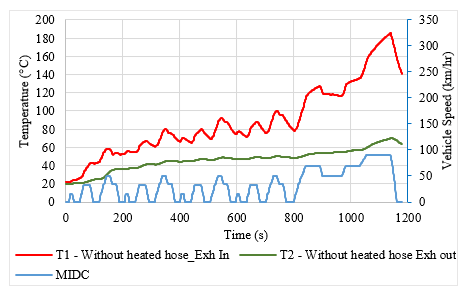
The temperature results were plotted on a line graph of a spark ignition engine. The peak temperature marked by the exhaust gas at tailpipe entrance (T1) was 92.5% as compared to the temperature during tailpipe exit (T2) which was 34.9%. The delta came out to be 57.5%. The notable decrease in delta suggests that water vapor condensation is likely to occur as the exhaust gas travels through the tailpipe. The approximate 58% temperature drop before the exhaust gas dilution is concerning, as it would contribute substantially to the total water condensed in the system and same is represented in Figure 11.
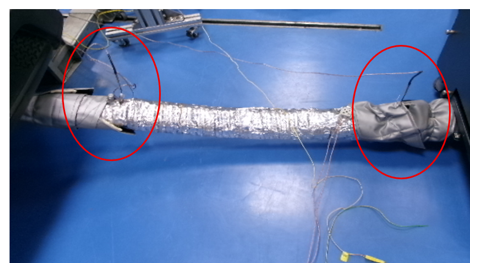
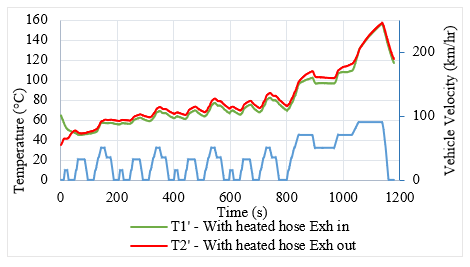
On addition of heating as well as insulation to 1-meter long tailpipe between vehicle exhaust and RMU, the inlet and outlet temperature readings throughout the cycle had significantly lower delta of about 0.2% is plotted in Figure 12. There was a clear reduction of 99.6% in delta after restricting the exhaust gas heat loss.
Figure 9. Line diagram of sampling pipe with heating and insulation
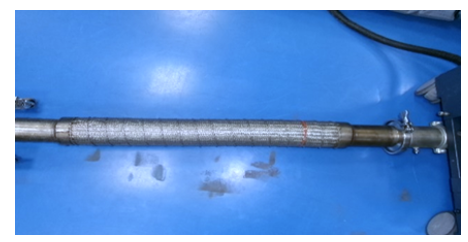
Figure 10. Sampling pipe with heating and insulation along with thermocouples
Figure 11. Tailpipe temperature without heater & insulation
The heating arrangement adopted in the sampling pipe before dilution is adopted with heater (coil type) capacity of maximum temperature 70℃. The main aim to use the heater was to avoid the heat loss throughout the length to avoid the condensation before the dilution. The total power consumption of the heater arrangement was approximately 0.5kW per test. The complete system was operated and controlled manually for the validation of the modifications.
Figure 12. Tailpipe temperature with heater & insulation
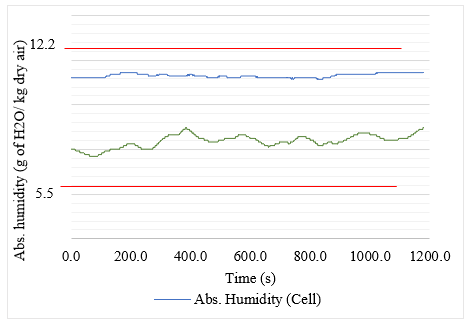
5.2 Absolute humidity
The limits for test facility absolute humidity as mentioned in AIS 137 Part III range from 5.5 to 12.2 g of H2O/kg of dry air. The same air was drawn by the vehicle during the tests. Tests were conducted with and without dehumidifier. The results were plotted on the line graph within a band of mentioned limit for absolute humidity and indicated in Figure 13. A reduction of absolute humidity is observed after dehumidification by 29.3%. Still the absolute humidity was maintained within the range specified in AIS 137. Figure 14 visualizes the dehumidifier test setup with RMU. The dehumidification process increased the intake air temperature and same is represented in Figure 15. The increase in the temperature is maintained within the boundary conditions provided in AIS 137.
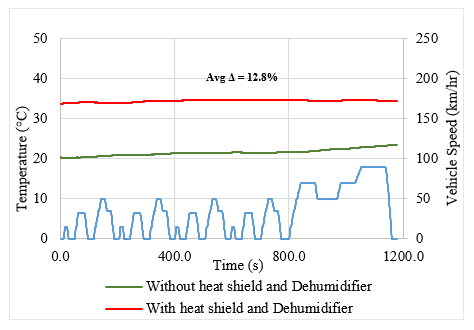
It was observed that the temperature of the air rises with dehumidification. To observe this trend a line graph was plotted showing the temperatures corresponding to the above discussed absolute humidity. The temperature of dehumidified air was observed to increase by 12.8% (average) with respect to the air without dehumidification.
Figure 13. Absolute humidity levels before and after dehumidification
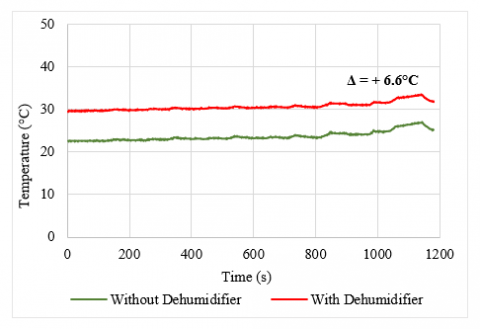
5.3 Tunnel temperature
The results of the test performed with and without dehumidifier, plotted in Figure 16 show the similar trend as observed in the previous graph. Dehumidification causes the ambient air temperature to rise, resulting in an average increase of 13.4%. This temperature increase is beneficial during dilution, as it minimizes the temperature difference between the exhaust gas and ambient air, thereby achieving our goal to prevent the condensation. In addition to the dehumidification, the insulation provided to the tunnel helped in maintaining the increased temperature throughout the tunnel and compared in Figure 16. Heat losses to the ambient atmosphere were restricted due to insulation over the dilution tunnel.
Figure 14. Dehumidifier setup
Figure 15. RMU intake temperature with and without dehumidifier
Figure 16. Tunnel temperature with and without dehumidifier
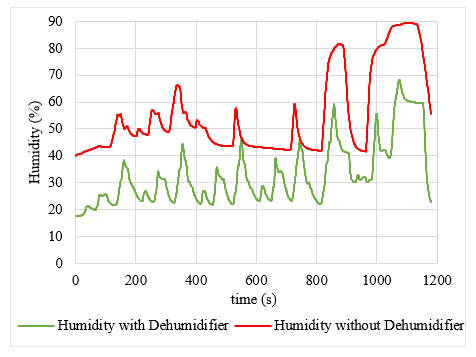
5.4 CVS humidity
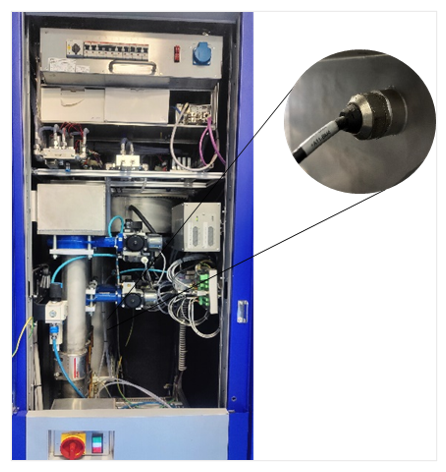
The experimental results of the test conducted with and without a dehumidifier, presented graphically in Figure 17 shows a similar trend to the previous test parameters. In baseline testing it was observed that the humidity was reaching ~90% and same was the threshold to the CVS system considering the safety of the gas analysers. Location of humidity sensor is shown in the Figure 18. After dehumidification, heating, insulating the tunnel etc. the humidity was reduced significantly compared to base test. The implementation of heating during sampling before dilution, insulating the tunnel, heated CVS altogether show the cumulative effect of reduction in the water accumulation in the CVS system, which was the goal and same was achieved experimentally.
Figure 17. CVS Humidity with and without dehumidifier
Figure 18. CVS Cabin and illustration of humidity sensor
5.5 Comparison of online traces
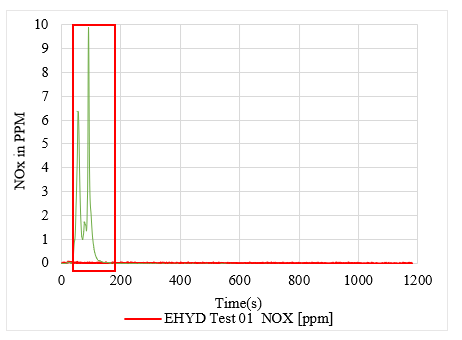
The emission results with the baseline testing showed no traces in the NOX emissions and chances of solubility of other emissions in water. The test results after modifications to avoid condensation showcased the ability to detect the NOX traces and perfectly measuring the other emissions.
The Figure 19 shows NOX emissions from Tests 01 and 02. Test 01, conducted without modifications to the test facility, failed to accurately measure NOX in the exhaust. Modifications implemented for Test 02 successfully detected NOX emissions. The Figures 19 and 20 illustrate the impact of condensation before and after the test facility modifications by detecting the water-soluble emissions.
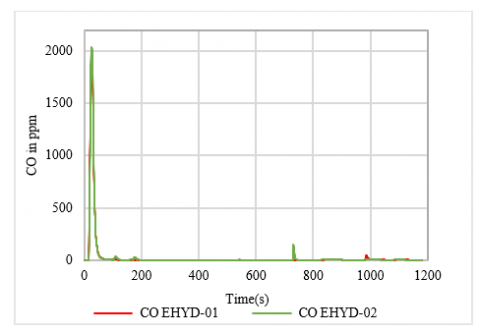
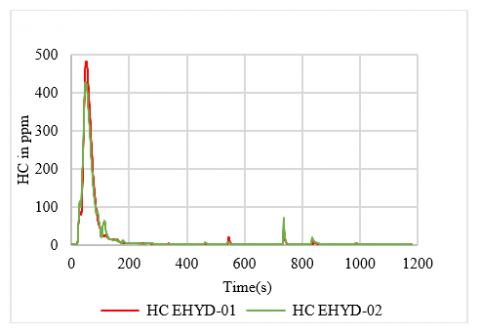
As we observed that there was no major change in the CO and THC emissions for test conducted before and after test facility modifications. The existing ability to maintain the Analyzer, CVS and bag cabinet at 35℃ became an added benefit to detect the emission traces.
Figure 19. Online traces of NOX emissions
(a) Online traces of CO emissions
(b) Online traces of HC emissions
Figure 20. Online traces of CO & HC emissions
The results obtained from the test data conducted both with and without the use of a dehumidifier demonstrated a clear impact on emission analysis. These results are presented in Table 5 for both E100 and M100 fuels. The condensation of water vapour was effectively controlled through the use of a dehumidifier during the tests. In the absence of a dehumidifier, the NOx emissions were recorded as zero. However, after implementing the proposed modifications — including the heating of the sample pipe before the RMU, integration of a dehumidifier, and insulation of the tunnel — the condensation of water vapour was successfully avoided. This led to an improvement in the accuracy of emission measurements.
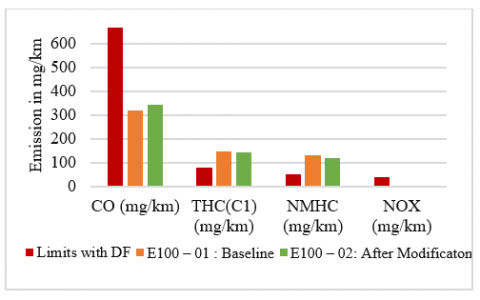
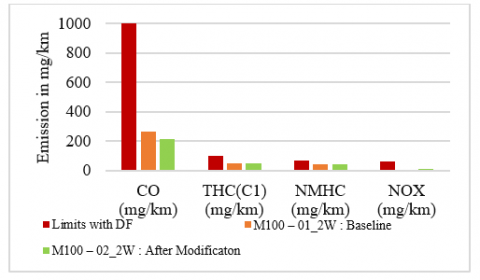
Table 5 provides a comprehensive view of the final results from both test conditions. In the initial tests using E100 and M100 fuels without the setup modifications, NOx emissions were found to be zero. Following the implementation of the modifications, a noticeable improvement in the emission results for both E100 and M100 vehicles was observed. This outcome highlights the sensitivity of NOx emission measurements to the presence of water in the exhaust system. Furthermore, the repeatability of the results confirmed that the modifications had no effect on the measurement of other emission parameters. Figure 21 presents a graphical representation of the emission results for both E100 and M100 fuels.
(a) Comparison of emission with E100
(b) Comparison of emission with M100
Figure 21. Emissions test results data with and without dehumidifier for E100 and M100
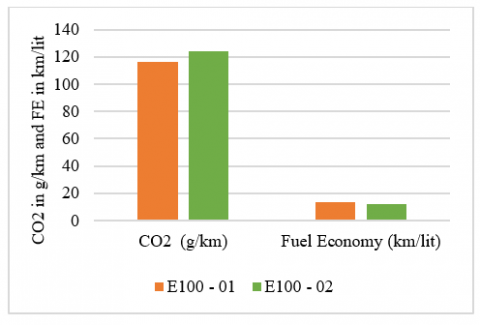
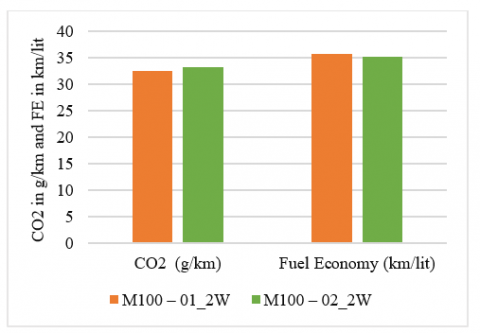
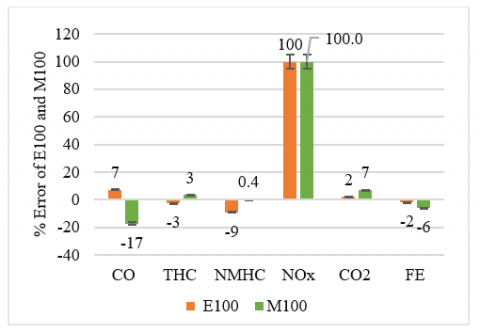
The test results for E100 and M100 after the implementation of the modifications for CO₂ and fuel economy (FE) are found to be nearly comparable. The comparison is shown in Table 6, along with a graphical representation provided in Figure 22. The evaluation of results represents the effectiveness of the test facility modifications for evaluation of alcohol fuels. It was observed that the complete recovery of the NOx emission and the average emission deviation was less than 6%. However, the deviation of the NOx was 100% due to non-traceability in analyser. The main cause of the same was the condensation during the dilution causing the measurement error. Figure 23 shows that the percentage error is highest for NOx emissions; however, this error was effectively eliminated following the implementation of the proposed modifications.
(a) Comparison of CO2 and fuel economy with E100
(b) Comparison of CO2 and FE with M100
Figure 22. CO2 & fuel economy with and without dehumidifier
Figure 23. Percentage measurement error removed by test setup modifications
Table 5. Emission results without and with proposed solution setup
|
Results of E100 Vehicle |
||||
|
|
CO (mg/km) |
THC(C1) (mg/km) |
NMHC (mg/km) |
NOX (mg/km) |
|
Limits with DF |
667 |
77 |
52 |
38 |
|
E100 – 01-Baseline |
318.871 |
147.058 |
129.398 |
0.000 |
|
E100 – 02: After Modificaton |
341.454 |
142.963 |
117.701 |
2.06 |
|
Results of M100 vehicle |
||||
|
|
CO (mg/km) |
THC(C1) (mg/km) |
NMHC (mg/km) |
NOX (mg/km) |
|
Limits with DF |
1000 |
100 |
68 |
60 |
|
M100 – 01_2W Baseline |
263.154 |
47.96 |
44.328 |
0.000 |
|
M100 – 02_2W After Modificaton |
217.682 |
49.60 |
44.491 |
12.650 |
Table 6. CO2 and fuel economy without and with proposed solution setup
|
|
CO2 (g/km) |
Fuel Economy (km/lit) |
|
E100 - 01 |
116.096 |
13.25 |
|
E100 - 02 |
124.183 |
12.39 |
|
M100 – 01_2W |
32.075 |
35.70 |
|
M100 – 02_2W |
33.142 |
35.10 |
The study aimed to enable existing test facility to meet the requirement for measurement of emissions for FFV or E100 or M100 vehicles. The modifications were carried out as per the need to avoid the condensation in the exhaust for the accurate measurement of emission for higher alcohol content (E100, M100, or ethanol/methanol blend with gasoline more than 20%) vehicles along with flex-fuel vehicles. A BS VI-compliant vehicle was selected for experimental work. Changes include dehumidification before dilution, heating the sample exhaust before dilution to avoid heat loss, and dilution tunnel insulation to eliminate the possibility of condensation due to the presence of water in the exhaust. All these modifications avoided water condensation issues during dilution.
The experimental results showed that the modification in the existing test facility met the criteria of test conditions in AIS 137, along with the accurate measurement of emissions. The modifications listed are applicable and must be adopted for the vehicles operated on E100, M100, or higher methanol/ethanol blends for an accurate tailpipe emission measurement system. The experiment was conducted with a vehicle operated with Ethanol and Methanol. The proposed modification will remain the same irrespective of type of vehicle. It is also highly energy efficient considering minimal power consumption throughout the test. Its simple and robust design ensure its reliability in long term usage.
The test cell modifications proposed in this study are not included in the existing automation system. Presently, the heating system and dehumidifier modification setup need to be controlled manually. The usage of E100/M100 fuel operated vehicles will call for the necessary test setup and will increase the downtime of test cell. The future work is planned towards the implementation of a complete automation system with integration of the heating system based on the higher ethanol or methanol blend selection. This will also enhance the testing efficiency along with accuracy of the emission measurement results.
This work is supported by the Automotive Research Association of India. We would like to express our sincere gratitude to the Engineers who provided invaluable assistance during our experiments. Special thanks to Mr. Shivraj Uttekar, Mr. Qasim Vaid, Mr. Vikas Padwal and Mr. Anjum Ibushe for their support.
|
Mi |
mass emission of the pollutant, g/km |
|
Vmix |
volume of the diluted exhaust gas, lit/test |
|
Qi |
density of the pollutant, gm/lit |
|
kh |
humidity correction factor |
|
Ci |
concentration of the pollutant in the diluted exhaust gas, ppm |
|
d |
operating cycle distance, km |
|
Ce |
measured concentration of pollutant in the diluted exhaust gas, ppm |
|
Cd |
concentration of pollutant in the air used for dilution, ppm |
|
DF |
dilution factor |
|
$C_{{CO}_2}$, $C_{{HC}}$, $C_{{CO}}$ |
concentration of CO2, HC, CO in the diluted exhaust gas contained in the sampling bag, %volume |
|
H |
absolute humidity, gm of H2O/kg of dry air |
|
Ra |
relative humidity of the ambient air, gm of H2O/kg of dry air |
|
Pd |
saturation vapour pressure, kPa |
|
PB |
atmospheric pressure in the room, kPa |
|
RMU |
remote mixing unit |
|
CVS |
constant volume sampling |
|
GHG |
greenhouse gas |
|
FTIR |
fourier transform infrared |
|
DNPH |
2,4-dinitrophenylhydrazine |
|
PSS |
particulate sampling system |
|
DF |
dilution factor |
[1] National Policy on Biofuels-2018 Amendment, 2022. https://mopng.gov.in/files/article/articlefiles/Notification-15-06-2022-Amendments-in-NPB-2018.pdf.
[2] Santos, E.G., Shi, J., Venkatasubramanian, R., Hoffmann, G., Gavaises, M., Bauer, W. (2021). Modelling and prediction of cavitation erosion in GDi injectors operated with E100 fuel. Fuel, 289: 119923. https://doi.org/10.1016/j.fuel.2020.119923
[3] Gajewski, M., Wyrąbkiewicz, S., Kaszkowiak, J. (2025). Effects of ethanol–gasoline blends on the performance and emissions of a vehicle spark-ignition engine. Energies, 18(13): 3466. https://doi.org/10.3390/en18133466
[4] NITI Aayog- ROADMAP FOR ETHANOL BLENDING IN INDIA 2020-25. https://www.niti.gov.in/sites/default/files/2025-07/Roadmap-For-Ethanol-Blending-In-India-2020-25.pdf.
[5] Laskowski, P., Zimakowska-Laskowska, M. (2025). Simulation study of the effect of ethanol content in fuel on petrol engine performance and exhaust emissions. Combustion Engines, 201(2): 129-135. https://doi.org/10.19206/CE-204049
[6] BPCL Ethanol Booklet 2023, https://mopng.gov.in/files/uploads/BPCL_Ethanol_Booklet_2023.pdf.
[7] Olmos, A., Banhara, R., Pinto, C.M.E., Georges, M.R. (2018). Emissions, fuel economy and energy consumption of a flex fuel vehicle in different driving cycles (No. 2018-36-0225). SAE Technical Paper. https://doi.org/10.4271/2018-36-0225
[8] Pandi, D.B., Shanmugam, G.P., Nagarkatti, A., Gopal, M., Anbalagan, P. (2025). Study on flex fuel compatible coatings for automotive fuel tank (No. 2024-32-0076). SAE Technical Paper. https://doi.org/10.4271/2024-32-0076
[9] Bandyopadhyay, D., Sutar, P.S., Sonawane, S.B. Jamadar, M., Rairikar, S., Thipse, S.S., Salunkhe, V. (2024). Methanol–As a future alternative fuel for indian automotive (No. 2024-26-0081). SAE Technical Paper. https://doi.org/10.4271/2024-26-0081
[10] Garcia, A., Monsalve-Serrano, J., Mendoza, M.G., Gaillard, P., Durrett, R., Vassallo, A., Pesce, F. (2023). Evaluation of neat methanol as fuel for a light-duty compression ignition engine (No. 2023-24-0047). SAE Technical Paper. https://doi.org/10.4271/2023-24-0047
[11] de Melo, T.C.C., Machado, G.B., de Oliveira, E.J., Belchior, C.R.P., Colaço, M.J., de Oliveira, D.G. (2011). Different hydrous ethanol-gasoline blends-FTIR emissions of a flex-fuel engine and chemical properties of the fuels (No. 2011-36-0080). SAE Technical Paper. https://doi.org/10.4271/2011-36-0080
[12] Suthisripok, T. (2012). The use of E100 to fuel a used 4-stroke motorcycle. American Journal of Applied Sciences, 9(5): 647-653.
[13] Nagy, P., Zsoldos, I., Szabados, G. (2024). Heat characteristics and emission effect of a fuel-operated auxiliary air heater fed with fuel E10, E30 and E100. Periodica Polytechnica Mechanical Engineering, 68(2): 181-186. https://doi.org/10.3311/PPme.36911
[14] Loos, M.J., Richert, J.F., Mauti, A., Kay, S., Chanko, T., Shah, S.D. (2009). Enabling flex fuel vehicle emissions testing–Test cell modifications and data improvements. SAE International Journal of Fuels and Lubricants, 2(1): 730-736.
[15] Cassiano, D.R., Ribau, J., Cavalcante, F.S.A., Oliveira, M.L.M., Silva, C.M. (2016). On-board monitoring and simulation of flex fuel vehicles in Brazil. Transportation Research Procedia, 14: 3129-3138. https://doi.org/10.1016/j.trpro.2016.05.253
[16] Suarez-Bertoa, R., Zardini, A.A., Keuken, H., Astorga, C. (2015). Impact of ethanol containing gasoline blends on emissions from a flex-fuel vehicle tested over the Worldwide Harmonized Light duty Test Cycle (WLTC). Fuel, 143: 173-182. https://doi.org/10.1016/j.fuel.2014.10.076
[17] Kar, K., Cheng, W.K. (2010). Speciated engine-out organic gas emissions from a PFI-SI engine operating on ethanol/gasoline mixtures. SAE International Journal of Fuels and Lubricants, 2(2): 91-101.
[18] Karavalakis, G., Stournas, S., Bakeas, E. (2009). Effects of diesel/biodiesel blends on regulated and unregulated pollutants from a passenger vehicle operated over the European and the Athens driving cycles. Atmospheric Environment, 43(10): 1745-1752. https://doi.org/10.1016/j.atmosenv.2008.12.033
[19] Chaudhary, N., Subramanian, K.A. (2022). Comparative study on methanol (M100) and ethanol (E100) fueled otto cycle engine. International Journal of Automotive Science and Technology, 6(1): 61-67.
[20] Chen, C., Han, D., Ma, Z. (2023). Study on compression ratio optimization of M100 methanol engine. Journal of Physics: Conference Series, 2592(1): 012068. https://doi.org/10.1088/1742-6596/2592/1/012068
[21] Pereira, L.P., Braga, S.L. (2024). Performance evaluation of a vehicle using different fuels through speed recovery tests on a chassis dynamometer (No. 2023-36-0065). SAE Technical Paper. https://doi.org/10.4271/2023-36-0065
[22] Automotive Industry Standard. (2019). AIS 137 – Part III. https://morth.gov.in/sites/default/files/ASI/File3173.pdf.
[23] Blaszczak, R.J. (1999). Nitrogen Oxides (NOx): Why and How They Are Controlled; EPA-456/F-99-006R.
[24] Nakamura, H., Adachi, M. (2013). Engine emissions measurement handbook (No. JPF-HOR-002). SAE Technical Paper.
[25] Stephenson, R.M. (1993). Mutual solubility of water and aldehydes. Journal of Chemical and Engineering Data, 38(4): 630-633. https://doi.org/10.1021/je00012a040