Mohammed G. D. Al-Sadoon*![]() | Obed M. Ali
| Obed M. Ali![]()
© 2024 The authors. This article is published by IIETA and is licensed under the CC BY 4.0 license (http://creativecommons.org/licenses/by/4.0/).
OPEN ACCESS
This study aims to assess and examine the gas turbine power generating system at the Qayyarah gas station in Nineveh City, Iraq. The evaluation conducted under real weather conditions for the year 2023. The gas turbine unit has a maximum load output capacity estimated at 125 megawatts. The system comprises a gas turbine, an air compressor, and a generator, all coupled by a shared shaft. Its functions based on a straightforward Joule-Brayton cycle. An analysis of the energy and exergy of the previously mentioned unit, taking into account the principles of conservation of mass, the first law, and the second law. The study specifically focused on examining the impact of several elements, including ambient temperature, compression ratio, relative humidity, and operational load. Two techniques used to replicate company data: the first approach included scripting the simulation using Excel, while the alternative option utilized Aspen HYSYS. The performance of the gas unit evaluated using the average data from each month of the simulation for that year. The simulation findings indicated that the combustion chamber is the primary component responsible for energy dissipation, and the highest energy yield may be achieved from fuel in the form of chemicals. The results of both approaches demonstrated that the maximum energy and energy efficiency achieved around 40.23% and 31.76%, respectively.
simple cycle, gas turbine, energy analysis, exergy, irreversibility
The globe faces several difficulties, chief among them the scarcity of energy and the rising demand for it brought on by the rise of the global economy and population growth. It forced nations to consider carefully how they would supply this energy. One of the factors behind the phenomena of global warming is energy. Energy is essential for human usage and plays a significant role in social and economic advancement. Studies have indicated a correlation between the expansion of the economy and the usage of electricity. This link suggests that increased electrical energy usage has an impact on economic expansion [1]. In contrast to conventional energy sources like nuclear power, hydropower, solar energy, wind energy, and others, renewable energy is clean energy that doesn't harm the environment. However, because of its limited supply and damage to the ozone layer, which impacts both human health and the planet's climate, it can't meet demand. Like other nations, Iraq experiences a deficit of electrical energy as a result of the recent rise in demand for it. This has led to a need for electrical energy sources, which has impeded Iraq's progress in the majority of fields related to modern development [2, 3]. The development of electrical energy consumption and satisfying the growing demand for it depends on boosting production efficiency and streamlining usage. This is considered an excellent way to lessen the influence on the environment as it lowers emissions and the amount of fuel used in the thermal station, which tends to be replaced by clean energy to cut down on the usage of fossil fuels and lower prices. However, they can transform thermal energy into electrical energy in gas turbine units, as shown in Figure 1, fossil fuels are regarded as one of the most significant sources of electrical energy generation [4]. The thermal energy in the hot gases produced by burning is transformed into mechanical energy by gas turbines. The stored thermal energy is transformed into energy by the gas turbine (T3), which raises air pressure and directs compressed air to the combustion chamber, where fuel and air are combined. Hot gasses are produced when they are ignited. The compressor and turbine shaft are run by the energy contained in the gases. The turbine's rotating action causes the air compressor's main shaft to revolve independently at the same time, utilizing mechanical energy [5].
Figure 1. Gas turbine unit [6]
The capacity of gas power plants to generate vast amounts of energy surpasses that of other forms of power plants that concentrate solely on producing electrical energy, which is just one of their numerous advantages. This is a result of how much fuel they can efficiently turn into electricity. Gas turbines are distinguished from other types of turbines by their quick start-up times and high energy distribution, which frequently exceeds 60% or more. Gas turbines can effectively satisfy the necessary requirements in a short amount of time, which makes them highly sought after. Gas turbines' reliance on carbon as a fuel source also restricts the fields in which they may be used to produce electricity [6]. Because gas power plants are so efficient at producing energy, they are vital to the economy, especially when it comes to the creation of electricity. Gas turbines are devices that convert the thermal energy released during the combustion of natural gas into mechanical energy, as shown in Figure 2. This mechanical energy is converted into electrical energy by electrical generators. Gas-fired power plants have the capacity to generate electricity at a high rate during times of demand, which makes them a potentially viable option for meeting significant energy needs. Additionally, these power plants significantly contribute to the stability of the electrical system as a whole [7]. The goal of engineering is to increase the gas power plants' part-load operational efficiency. The goal of gas turbine technological advancements is to improve efficiency and operational capabilities. Control and switching system functionality improved, enabling plants to respond more quickly to variations in energy demand and preserve grid stability. Many tactics have been developed to lower power plant gas emissions. This entails employing cutting-edge combustion technology and putting in place gas processing systems to manage combustion byproducts. Water usage is to be decreased while plant operating efficiency increases through the development of cooling systems [7].
Figure 2. Gas turbine
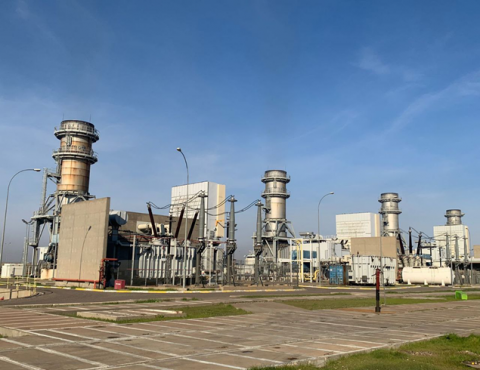
This study was conducted at the Qayyarah gas power station located in the Qayyarah district of Nineveh Governorate/Iraq. The plant shown in Figure 3 was designed by General Electric (GE) and implemented by the Turkish company Gailk Energy. The system has six 9th generation generating units (frame 9E), single shaft turbine specifications, and engine speed (3000rpm). The unit is specifically designed to operate with a load of (125MW) as the intended power capacity and typically operates with a load of approximately (100MW) as the actual power capacity. The gas unit has been specifically developed for simple cycle operation and is capable of using three different forms of fuel (crude oil, natural gas, and light fuel).
Usin software techniques to simulate a power plant from data taken from the operating department for the year 2023, this research aims to theoretically analyze the energy and available energy and study the effect of relative humidity, pressure ratio, heat load and external ambient temperature on the equipment of the Qayyarah gas station.
Figure 3. Qayyarah gas power station [7]
2.1 Power plant component
Gas turbines can run in two modes: the steam cycle (Rankine cycle) or the simple cycle (Brayton cycle), which consists of a compressor, combustion chamber, and gas turbine. Because they are less expensive and lighter than other plants, gas turbines have the benefit of being easier to install. Numerous Because it doesn't need water, it is utilized in dry regions. The efficiency of a gas turbine is influenced by two factors: the pressure and the temperature entering the turbine. It runs on heavy gas, crude oil, or natural gas as fuel. It is possible to run another station and protect the environment by using the waste heat from the exhaust of the station [8].
The Al-Qayyarah Gas Power Station is a vital station located in the northern region of Iraq. Turkish businesses have made use of it, which was developed by General Electric (GE). The station has a single-shaft turbine model (9001E), six generators from (Calic Energy Corporation), and engine speed specs (3000rpm). The unit is intended to run at a capacity of 12,500 megawatts, with a design power of roughly (100,000MW) when operating at a load. Designed to run on three different fuels: natural gas, light fuel, and crude oil [9].
2.2 Power plant field data
The Data and Control Department is responsible for collecting all data for the turbine unit and supplying field data for the gas turbine unit for the year 2023 for all months of the year on a quarterly basis. Mathematical computations were made to examine data for the month of January as an average for the winter season. Tables 1 and 2 show the data gathered for the sixth turbine unit (GT20) that worked on natural gas and was separated into two sections: the first is winter data, and the second is summer data.
The month of January is taken as a model representing the winter season of the year when the temperature of the external environment is somewhat low. This, in turn, shows the effect of low temperature on the energy and exergy efficiency of the gas station, in addition to external influences. Temperature is considered the main influence on the system’s equipment. In addition, the month of July is an example of the summer season of the year, when the external temperatures are very high, and this, in turn, shows the effect of high temperatures on the energy and exergy efficiency of the gas station, because high external temperatures affect the system’s equipment.
Table 1. Data for January of GT20 (2023)
|
No. |
Operating Parameters |
January |
Unit |
|
1. |
Load |
82 |
MW |
|
2. |
RH |
78 |
% |
|
3. |
Air flow rate (ma) |
306 |
Kg/s |
|
4. |
Fuel flow rate (mf) |
5.6 |
Kg/s |
|
5. |
Temperature fuel (Tf) |
18 |
°C |
|
6. |
Pressure fuel (Pf) |
22.33 |
Bar |
|
7. |
Compressor inlet temperature (T1) |
9 |
°C |
|
8. |
Compressor outlet temperature (T2) |
333 |
°C |
|
9. |
Turbine outlet temperature (T4) |
450 |
°C |
|
10. |
Compressor inlet pressure (P1) |
1.013 |
Bar |
|
11. |
Compressor outlet pressure (P2) |
9 |
Bar |
|
12. |
Turbine outlet pressure (P4) |
1.013 |
Bar |
Table 2. Data for July of GT20 (2023)
|
No. |
Operating Parameters |
January |
Unit |
|
1. |
Load |
82 |
MW |
|
2. |
RH |
10 |
% |
|
3. |
Air flow rate (ma) |
265 |
Kg/s |
|
4. |
Fuel flow rate (mf) |
5.5 |
Kg/s |
|
5. |
Temperature fuel (Tf) |
29 |
°C |
|
6. |
Pressure fuel (Pf) |
21.8 |
Bar |
|
7. |
Compressor inlet temperature (T1) |
34 |
°C |
|
8. |
Compressor outlet temperature (T2) |
363 |
°C |
|
9. |
Turbine outlet temperature (T4) |
465 |
°C |
|
10. |
Compressor inlet pressure (P1) |
1.103 |
Bar |
|
11. |
Compressor outlet pressure (P2) |
9.5 |
Bar |
|
12. |
Turbine outlet pressure (P4) |
1.103 |
Bar |
Prior to being acquired by Aspen Tech and rebranded as Aspen HYSYS, Hyprotech developed the HYSYS software. Oil, natural gas, petrochemical, gas, and thermal facilities are all simulated using the HYSYS program as it includes all the industrial components required for most businesses. A thorough database with the majority of the materials used in the aforementioned areas is also provided by the program, and users have the option to add more materials or compounds. Reactors, distillation towers, absorption columns, heat exchangers, and a plethora of other industrial equipment are among the numerous that use it in their design [10]. Major design companies such as Enppi and others utilize the HYSYS software to build a complete design for gas plants, petrochemical plants, and petroleum refining facilities. This program is used in design, along with other auxiliary programs, whether in the Arab world or elsewhere in the globe. Additionally, the application computes the required values based on the values of the different parameters. Additionally, the algorithm selects the optimal heat amount, pressure, temperature, and production rate settings that will maximise facility profits while minimising expenses [11]. With the HYSAS program, DCS control units may also be emulated. The software is also used to investigate changing operating circumstances. Our approach to production rate differs in that we use the HYSAS software to simulate the unit whose operating parameters we desire to modify first, then we progressively adjust the settings and assess the impact of this modification on production rates. Temperature, pressure, heat, and production pace that will enable the facility to make the most significant money with the least expenses [12]. The core ideas of integration and innovation serve as the foundation for the adaptable and dependable process simulation provided by the HYSAS application. The most recent chemical process technologies, unified functions in a single software environment, seamless connection to the chemical engineering computing environment with tool links like MS Excel and Word and interfaces like (COM, DCOM), and HYSAS combining a state-of-the-art graphical user interface are just a few of the many major benefits it offers HYSAS users. Additionally, special thermodynamics, unit operations, computations, and reporting may be supported by customising the program. Systems in both dynamic and stable states are simulated [13]. A simple model for simulating gas turbines is created, as shown in Figure 4. Three fundamental parts make up the model: a turbine, a combustion chamber, and a compressor. Throughout the year, the conditions under which air enters the compressor vary.
For natural gas-fired Unit 6, simulations were performed using HYSYS software to ascertain variations in gas turbine performance and efficiency as well as predict production range and performance under different operating situations. The following assumptions guided the simulation implementation: Assumption that each cycle process remains constant throughout; The air entering the compressor and the air leaving the exhaust has the same standard pressure (1.01325 bar), which is atmospheric pressure. The inlet air temperature is equal to the ambient air temperature. Introduction of fuel, air, combustion products, and ideal gases According to all ideal gas laws, the gases leaving the combustion chamber can be calculated, and they are equal to (0.97*P2). Assuming that each part of the cycle - the compressor, the combustion chamber, and other parts -leads to nitrogen entering and leaving the compressor at a molar rate of (79%) and oxygen at a molar rate of (21%) only when entering the compressor, the mechanical efficiency of the turbine and compressor reaches (95%) [14, 15].
Figure 4. An Aspen HYSYS gas turbine model's flowchart
3.1 Energy analysis
To study the energy for the gas turbine unit, a series of assumptions is used to simplify the resultant mathematical model:
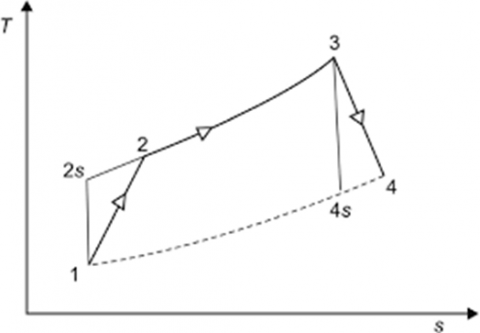
The gas turbine power for each component is evaluated based on Figure 5. which illustrates its actual cycle on a T-S diagram:
Figure 5. Actual gas turbine unit cycle [17]
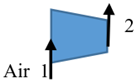
A. Compressor Work $\left(W_{A C}\right)$
The calculation for the compressor work is as follows [18]:
$\dot{W}_{A C}=\dot{m}_a \times \bar{C} p_i \times\left(T_2-T_1\right)$ (1)
where,
$\dot{m}_a=\dot{m}_i=\dot{m}_e$ (2)
And $\bar{C} p_i$ represented the combustion chamber's products and is computed as [18]:
$\bar{C} p_i=a_i+b_i T+c_i T^2+d_i T^3$ (3)
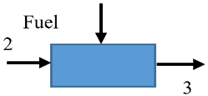
The heat added to the combustion chamber during the burning of fuel and air may be computed as follows [19]:
$\dot{Q}_{a d d}=\dot{m}_f \times L H V$ (4)
B. Turbine Work $\left(W_{G T}\right)$
Can indicate the work performed by the turbine as a consequence of the expansion of the combustion products via its blades [20]:
$\dot{W}_{G T}=\dot{m}_g \times C p_g \times\left(T_3-T_4\right)$ (5)
where,
$\dot{m}_g=\dot{m}_a+\dot{m}_f$ (6)
C. Thermal Efficiency $(\eta I)$
The ratio of the network created by the turbine to the heat energy produced by the combustion process in the combustion chamber is known as the thermodynamic cycle's thermal efficiency [19, 21]:
$\eta \mathrm{I}=\frac{\dot{W}_{\text {net }}}{\dot{m}_f \times(L H V)}$ (7)
D. Brake Work Ratio (B.W.R)
The ratio of heat energy to turbine work is known as the brake work ratio [22]:
$B.W.R=\frac{\dot{W}_{A C}}{\dot{W}_{G T}} \times 100 \%$ (8)
E. Specific Fuel Consumption (SFC)
When examining the energy and exergy for gas power plants, one of the most important factors is specific fuel consumption (SFC), which is a measurement of the fuel used by a gas turbine to produce energy for a certain amount of time [23]. Its definition is the ratio of an hour's fuel mass consumption ($\dot{m} f$) to a network ($\dot{W}_{\text {net }}$).The low values of (SFC) show that the turbine is operating effectively [24], can be calculated [25, 26]:
$S F C=\frac{3600 \times \dot{m}_f}{\dot{W}_{\text {net }}}$ (9)
3.2 Exergy analysis
When the effects of surface tension, magnetic, electrical, and nuclear reactions are disregarded, the exergy of the gas turbine power plant may be classified into four primary categories. The overall exergy is represented as follows [26-28]:
$\dot{E}_X=\dot{E} x_{C H}+\dot{E} x_{P H}+\dot{E} x_{K N}+\dot{E} x_{P T}$ (10)
The open cycle (JBC) calculates the quantity of energy to each component of the system as follows [29]:
$e x=\left(h_i-h_o\right)-T_a \times\left(s_i-s_o\right)+\frac{V^2}{2}+g z+e x_{C H}$ (11)
The following rule is used to calculate the available power rate [30]:
$\dot{E}_X=\dot{m} \times e x$ (12)
The following formula may be used to define $\dot{E x}_{P H}$, which is the consequence of temperature changes for air, fuel, and combustion gases entering and leaving a system in relation to the outside environment [18]:
$e x_{P H}=\left(h_i-h_o\right)-T_a \times\left(s_i-s_o\right)$ (13)
To compute the amount of ∆S between two states entry and exit in each process while applying the specific entropy of an ideal gas as follows [31]:
$\Delta S=S_{i+1}-S_o$ (14)
$\Delta S=C_{P, i} \times \ln \left(\frac{T_{i+1}}{T_o}\right)-R \times \ln \left(\frac{P_{i+1}}{P_o}\right)$ (15)
The hII for each component may be written as [32]:
For compressor $\eta \mathrm{II}$ AC:
$\eta$ II. AC. $=\frac{E x_2-E x_1}{w} \times 100 \%$ (16)
For combustion chamber $\eta \mathrm{II}$ C.C:
$\eta$ II C. C. $=\frac{E x_{\text {fule gas }}}{E x_{\text {fule }}+E x_{\text {air }}} \times 100 \%$ (17)
For gas turbine $\eta \mathrm{II}$ GT:
$\eta \mathrm{II} \mathrm{GT}=\left(1-\frac{\dot{E} x_{d e s, G T}}{E x_3-E x_4}\right) \times 100 \%$ (18)
$\eta \mathrm{II}$ is calculated from [33]:
$\eta$ II cycle $=\frac{W_{\text {net }}}{E x_f} \times 100 \%$ (19)
And $\dot{W}_{\text {net,load }}$ is calculated from [34, 35]:
$\dot{W}_{\text {net,load }}=\left(\dot{W}_{G T}-\dot{W}_{A C}\right) \times\left(\eta_{\text {generator }} \times \eta_{\text {mechanical }}\right)$ (20)
And $\dot{E} x_{\text {des }}$ is determined from [36]:
$\dot{E} x_{d e s}=T_a \times \sigma_{C V}$ (21)
The performance data of the gas turbine at the Qayyarah Gas Station simulated using both approaches over a period of twelve months in 2023. The system encompasses variations in power and energy based on factors such as ambient temperature, pressure ratio, relative humidity, and convection. Initially, the research examine the impact of these parameters on the behavior of energy production. Tables 3 and 4 present the energy and exergy analysis results respectively for January natural gas accounts (2023). Table 5 lists the energy efficiency and exergy theoretical calculations and simulation program for January (2023).
Table 3. Energy analysis results for January natural gas accounts (2023)
|
Component |
Diagram |
Work (MW) |
Efficiency (%) |
|
Compressor (AC) |
113.63 |
90.74 |
|
|
Gas Turbine (GT) |
206.38 |
92.77 |
Table 4. Exergy analysis results for January natural gas accounts (2023)
|
Component |
Diagram |
Exergy,des. (MW) |
Efficiency (%) |
|
Compressor (AC) |
213.4 |
81.22 |
|
|
Combustion Chamber (C.C.) |
135.32 |
72.52 |
|
|
Gas Turbine (GT) |
3.945 |
98.2 |
Table 5. Energy efficiency and exergy theoretical calculations and simulation program for January (2023)
|
Energy Efficiency Theoretically (η I) % |
Energy Efficiency in Simulation (η I) % |
Exergy Efficiency Theoretically (η II) % |
Exergy Efficiency in Simulation (η II) % |
|
36.35 |
38.3 |
28.43 |
29.89 |
4.1 Effect of change in ηI
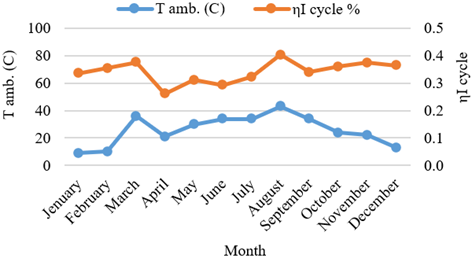
The results of the approved readings for the year (2023) are presented, which included (12) measurements that reflect the average for each month to determine the effects of external conditions on the gas station device. Note that the design conditions for the station are at (15) degrees Celsius and a pressure of (1) bar, and the efficiency of the device is between (33-38%). Figure 6 shows that the best efficiency was found in the eighth month at a temperature of (43℃). The total amounted to about (40.23%). This is what the research [37] said, as it revealed that the optimal conditions for enhancing the unit’s efficiency are the high external ambient temperature. The lowest efficiency of the station was recorded in the fourth month at a temperature of (21℃). As the temperature of the external environment decreases, the power of the station increases to approximately (26.15%). Investigation [38] showed that lower compressor inlet temperature is beneficial to the system. During the past three months (October, November, and December), a decline in the efficiency of the system has been witnessed. This decrease may be due to lower external ambient temperatures, which in turn affects the compressor workload. The performance of the compressor depends mostly on the temperature of the incoming air. In addition, high external temperatures affect the station tool, and this was observed in the summer season, while lower external temperatures are better for the station tool, and this was observed in the winter season.
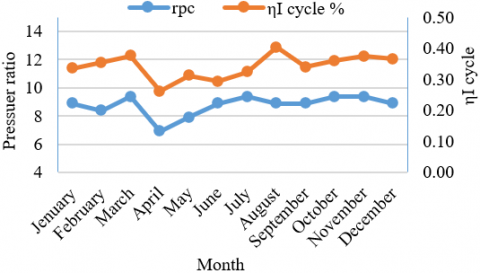
A higher compression ratio leads to increased station performance. This is because when the compression ratio increases, the amount of air flowing inside the system increases, but when temperatures rise, the compression ratio decreases, and this affects the system’s performance. The results showed us that the higher the pressure ratio, the greater the system’s performance, which is in line with previous research's results [39, 40]. This is because raising the compression ratio raises the pressure entering the turbine, which raises the turbine's work output because of the increase in enthalpy. As we can see in Figure 7, When the compression ratio increased during the first semester of the year, efficiency increased as well. When the compression ratio decreased, efficiency decreased. When the compression ratio increased again at the beginning of the second month, efficiency increased as well. This pattern continued until the end of the third month, but when the compression ratio decreased from (9.37) to (8.88), efficiency increased from (32.32%) to (40.23%).
Figure 6. Explains the influence of external temperature on energy efficiency (2023)
Figure 7. The effect of compression ratio on energy performance (2023)
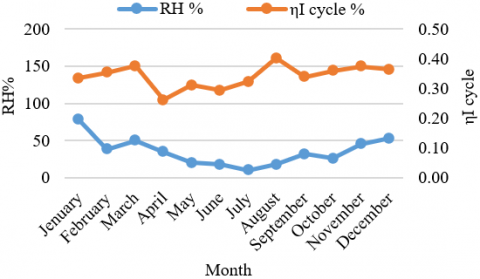
Dry air impacts the compressor device and, therefore, affects the system device in general, as the findings indicated that in the month of January, the humidity reached its greatest value (78%), and the energy efficiency reached (33.53%) as shown in Figure 8. This is because high relative humidity creates obstruction in the filters and, therefore, decreases The mass flow rate of air, consequently affecting the efficiency of the system. However, in the summer, particularly hot summer days, the effectiveness of the system rises as the relative humidity falls. This is due to its link with the temperature of the external environment, meaning that the humidity present promotes the mass flow of incoming air and decreases its temperature, therefore increasing. System efficiency: We observe from the data that raising the relative humidity enhances the energy efficiency of the system. Only the energy efficiency went from (35.36%) to (37.53%) when the rise in relative humidity was from (38%) to (50%) at a temperature of (10C) and (36C). This is consistent with the study [41], which confirmed that when the relative humidity increases, the efficiency of the system increases, while the researcher [42] showed that the best operation of the gas turbine system is when the relative humidity decreases, because in conditions in which air Dry and low humidity, the efficiency of the system is better.
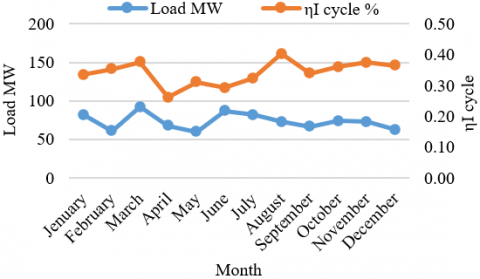
The load influences the energy efficiency of the system shown in Figure 9, which reveals that the best efficiency was achieved when the station’s operating load was (73MW), reaching approximately (40.23%), and the lowest efficiency was recorded when the station’s operating load was (68MW), reaching about (26.15%). This may be by a study [43], which revealed that the efficiency of the first rule diminishes as the station’s operational load drops.
Figure 8. The effect of relative humidity on energy efficiency (2023)
Figure 9. The effect of operating load on energy efficiency (2023)
4.2 Effect of change in ηII
The results of the approved readings for the year (2023) are presented, which included (12) measurements that reflect the average for each month to determine the effects of external conditions on the gas station device. Note that the design conditions for the station are at (15) degrees Celsius and a pressure of (1) bar, and the efficiency of the device is between (33-38%). The results shown in Figure 10 reveal that the second law's efficiency ranged from (33.76%) in the eighth month at (43C) to (21.41%) in the fourth month at (21C). This indicates that at high temperatures, the second law performed most efficiently. The second law's effectiveness is enhanced by the temperature of the surrounding environment; nevertheless, it is less effective when the ambient air temperature falls below the design temperature of 15C. The efficiency achieved (27.45%) and (29.19%) at temperatures of (9C) and (10C), as shown by the findings in the first two months of the year, and this is compatible with the majority of researchers' study [38, 44].
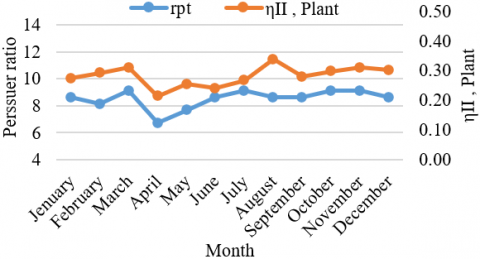
Increasing the compression ratio leads to increased station performance, as shown in Figure 11. This is because when the pressure ratio increases, the amount of air flowing into the system increases, but when temperatures rise, the pressure ratio decreases, and this affects the system’s performance. The results showed us that the higher the pressure ratio, the greater the system performance, and this is in line with the results of previous research. It was observed that the greatest possible energy efficiency in the eighth month reached (33.76%) at a compression ratio of (8.88), while the highest compression ratio in the third month reached (9.37) at an efficiency of (30.99%). The lowest compression ratio in the fourth month was (6.9) at an efficiency of (21.41%). This is consistent with most research since they proved that when the compression ratio rises, the available energy efficiency improves [45-47].
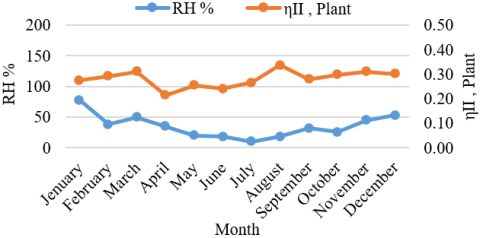
Relative humidity has an influence on the efficiency of available energy, as shown in Figure 12, as the highest available energy efficiency was obtained in the eighth month at a relative humidity of (18%), while the lowest available energy efficiency was reached in the fourth month at a relative humidity of (68%). The attainable energy efficiency was attained at the lowest amount of relative humidity. In the seventh month (10%) at an efficiency of (26.62%). This demonstrates that as the relative humidity lowers, the efficiency of the available energy improves.
Figure 10. The effect of external ambient temperature on the efficiency of available energy (2023)
Figure 11. The effect of compression ratio on available energy efficiency (2023)
Figure 12. The effect of relative humidity on the efficiency of available energy (2023)
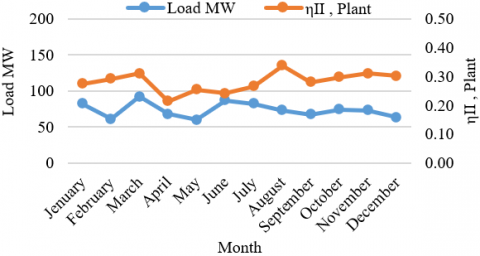
Figure 13. The effect of operating load on the efficiency of available energy (2023)
The maximum efficiency of the available energy was reached in the eighth month at a load of (73MW) (33.76%), while the efficiency reached the maximum load of (87MW) in the sixth month (24%), as shown in Figure 13, which is consistent with the researcher’s findings. The results also indicated that the operating load affects the efficiency of the available energy. It shows that the available energy efficiency decreased with increasing operating load [48].
4.3 Amount of energy and destructive energy
According to the available energy results shown in Figure 14, fuel has the largest rate of energy available due to the massive amount of chemical available energy it contains, which is equivalent to approximately (Exf=302.14MW). This is followed by the gases exiting the combustion chamber, which have an amount of (EX3=259.11MW), and compressed air, which has an amount of (EX2=92.29MW). The quantity of gases emitted into the atmosphere is equal to (EX4=66.48MW).
Figure 14. Unit component exergy simulation over a year (2023)
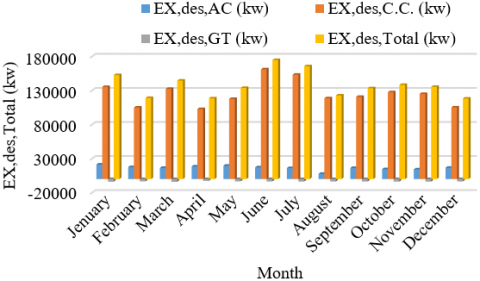
The combustion chamber occupied first place in terms of the rate of available energy destroyed due to the irreversible processes that occur there. The combustion chamber reached (EX,des,C.C.=135.32MW) as a result of the significant temperature difference between the environment and the combustion chamber as shown in Figure 15. The majority of what the researchers demonstrated [49-51] is compatible with this, although the study revealed Exhaust gas is where the available energy is destroyed, followed by the combustion chamber [52], but the researcher [25] confirmed that the stages are the primary source of the destruction of the available energy, which is then followed by the compressor (EX,des,AC=21.34MW), the gas turbine (EX,des,GT=-3.945MW), and so on. The temperature of the gases from the gas turbine is higher than the temperature of the air exiting the compressor. It is observed that the available energy destroyed in the compressor is higher than in the turbine because of the losses brought about by the compressor's air flow slipping in its blades, which results in larger losses than in the turbine and causes expulsion when it occurs in the turbine's blades. The differential in pressure between the high input and low outlet allows gases to pass between the turbine blades and exit to the outside. It is for this reason that the air compressor has more stages than the gas turbine does.
Figure 15. Destructive available energy for station components (2023)
The study showed the effect of external variables (Load, Ta, RH, rp) on the system performance and the rate of specific fuel consumption, in addition to analyzing the energy and exergy of the power plant (Qayyarah gas station) to ascertain the losses resulting from it in actual working conditions. The following conclusions were drawn from the results of the system operation:
The authors appreciate the unlimited support from the Qayyarah gas station technical staff.
|
B.W.R |
Brick work ratio |
|
CO |
Carbon dioxide |
|
CP |
Specific heat, J/kg.K |
|
Ex |
Exergy, W |
|
H |
Enthalpy, J/kg |
|
G |
Acceleration, 9.81 m/s2 |
|
JBC |
Joule-Brighton cycle |
|
KE |
Kinetic energy, J |
|
LHV |
Lower heating value, J |
|
ṁ |
Mass flow rate, kg/s |
|
P |
Pressure, Pa |
|
PE |
Potential energy, J |
|
Rp |
Pressure ratio |
|
RH |
Relative humidity |
|
S |
Entropy,KJ/k |
|
T |
Temperature, K |
|
W |
Work |
|
V |
Velocity, m/s |
|
Z |
Elevation, m |
|
$\eta \mathrm{I}$ |
Energy efficiency |
|
$\eta \mathrm{II}$ |
Exergy efficiency |
|
a |
Ambient |
|
c |
Compressor |
|
CH |
Chemical |
|
cc |
Combustion champe |
|
i |
Inlet |
|
o |
Out let |
|
dec |
Destructs |
|
KN |
Kinetic |
|
PH |
Physical |
|
PT |
Potential |
|
T |
Turbine |
|
T1 |
Compressor inlet temperature |
|
T2 |
Compressor outlet temperature |
|
T3 |
Turbine inlet temperature |
|
T4 |
Turbine outlet temperature |
[1] Kumar, A., Singhania, A., Sharma, A.K., Roy, R., Mandal, B.K. (2017). Thermodynamic analysis of gas turbine power plant. International Journal of Innovative Research in Engineering & Management, 4(3): 648-654. https://doi.org/10.21276/ijirem.2017.4.3.2
[2] Rahman, M.M., Ibrahim, T.K., Abdalla, A.N. (2011). Thermodynamic performance analysis of gas-turbine power-plant. International Journal of the Physical Sciences, 6(14): 3539-3550. https://doi.org/10.5897/IJPS11.272
[3] Awad, O.I., Ma, X., Kamil, M., Ali, O.M., Ma, Y., Shuai, S. (2020). Overview of polyoxymethylene dimethyl ether additive as an eco-friendly fuel for an internal combustion engine: Current Application and environmental impacts. Science of The Total Environment, 715: 136849. https://doi.org/10.1016/j.scitotenv.2020.136849
[4] Huth, M., Heilos, A. (2013). Fuel flexibility in gas turbine systems: Impact on burner design and performance. In: Modern Gas Turbine Systems. Woodhead Publishing Limited. https://doi.org/10.1533/9780857096067.3.635
[5] Dobbeling, K., Meeuwissen, T., Zajadatz, M., Flohr, P. (2008). Fuel flexibility of the Alstom GT13E2 medium sized gas turbine. In Turbo Expo: Power for Land, Sea, and Air, 43130: 719-725. https://doi.org/10.1115/GT2008-50950
[6] Ibrahim, T.K., Rahman, M.M., Ali, O.M., Basrawi, F., Mamat, R. (2016). Optimum performance enhancing strategies of the gas turbine based on the effective temperatures. In MATEC Web of Conferences, p. 01002. https://doi.org/10.1051/matecconf/20163801002
[7] Khaleel, O.J., Ismail, F.B., Ibrahim, T.K., bin Abu Hassan, S.H. (2022). Energy and exergy analysis of the steam power plants: A comprehensive review on the classification, development, improvements, and configurations. Ain Shams Engineering Journal 13(3): 101640. https://doi.org/10.1016/j.asej.2021.11.009
[8] Zohuri, B., McDaniel, P. (2018). Gas turbine working principals. In: Combined Cycle Driven Efficiency for Next Generation Nuclear Power Plants. Springer, Cham. https://doi.org/10.1007/978-3-319-70551-4_7
[9] Ali, O.M., Mustafa, A.N. (2023). The impact of climate on the efficiency and performance of the qayyarah gas station. International Journal of Research In Science & Engineering (IJRISE), 3(4): 14-27. https://doi.org/10.55529/ijrise.34.14.27
[10] Liu, Z., Karimi, I.A. (2018). Simulating combined cycle gas turbine power plants in Aspen HYSYS. Energy Conversion and Management, 171: 1213-1225. https://doi.org/10.1016/j.enconman.2018.06.049
[11] Liu, Z., Karimi, I.A. (2019). Simulation of a combined cycle gas turbine power plant in Aspen HYSYS. Energy Procedia, 158: 3620-3625. https://doi.org/10.1016/j.egypro.2019.01.901
[12] Saddiq, H.A., Perry, S., Ndagana, S.F., Mohammed, A. (2015). Modelling of gas turbine and gas turbine exhaust and its utilisation as combined cycle in utility system. International Journal of Scientific and Engineering Research, 6(4): 925-933.
[13] Ahmad, N.E., Mel, M., Sinaga, N. (2018). Design of liquefaction process of biogas using Aspen HYSYS simulation. Journal of Advanced Research in Biofuel and Bioenergy, 2(1): 10-15.
[14] Khaliq, A. (2009). Exergy analysis of gas turbine trigeneration system for combined production of power heat and refrigeration. International Journal of Refrigeration, 32(3): 534-545. https://doi.org/10.1016/j.ijrefrig.2008.06.007
[15] Salah, S.A., Abbas, E.F., Ali, O.M., Alwan, N.T., Yaqoob, S.J., Alayi, R. (2022). Evaluation of the gas turbine unit in the Kirkuk gas power plant to analyse the energy and exergy using ChemCad simulation. International Journal of Low-Carbon Technologies, 17: 603-610. https://doi.org/10.1093/ijlct/ctac034
[16] Salah, S.A., Abbas, E.F., Ali, O.M. (2022). Assessment of the gas turbine unit in Kirkuk gas power station using energy and exergy analysis. NTU Journal of Engineering and Technology, 1(2).
[17] Borgnakke, C., Sonntag, R.E. (2020). Fundamentals of Thermodynamics, 10th Edition. Wiley Online Library.
[18] Abam, F.I., Ugot, I.U., Igbong, D.I. (2011). Thermodynamic assessment of grid-based gas turbine power plants in Nigeria. Journal of Emerging Trends in Engineering and Applied Sciences, 2(6): 1026-1033. https://hdl.handle.net/10520/EJC140824.
[19] Singh, O. (2015). Applied Thermodynamics, 4th Edition. New Age International Publishers.
[20] Fellah, G., Noba, K.B. (2016). Thermodynamic analysis of Zawia combined cycle power plant. International Journal of Engineering papers, 1: 74-81.
[21] Moran, M.J. (2014). Introduction to Thermal Systems Engineering: Thermodynamics, Fluid Mechanics, and Heat Transfer, 3rd Edition. Wiley Online Library.
[22] de Oliveira Junior, S. (2012). Exergy: Production, Cost and Renewability. Springer Science & Business Media.
[23] Danook, S.H. (2018). Thermal performance for electricity generation plant of north oil company Kirkuk. https://www.academia.edu/37577782/Thermal_performance_for_electricity_generation_plant_of_North_Oil_Company_Kirkuk.
[24] Saif, M., Tariq, M. (2014). Thermal analysis of a gas turbine power plant at Uran , India. International Journal of Current Research, 6(3):5459-5463.
[25] Hussein, Y.H., Mustafa, S.S., Danook, S.H. (2018). Exergy destruction calculation in gas turbine power plant and showing the effect of ambient temperature on it. Al-Kitab Journal for Pure Sciences, 2(2): 276-291.
[26] Kotas, T.J. (1985). Chapter 1-Review of the fundamentals. In: The Exergy Method of Thermal Plant Analysis, Butterworth-Heinemann, pp. 1-28. https://doi.org/10.1016/b978-0-408-01350-5.50008-8
[27] Kumar, R. (2017). A critical review on energy, exergy, exergoeconomic and economic (4-E) analysis of thermal power plants. Engineering Science and Technology, an International Journal, 20(1): 283-292. https://doi.org/10.1016/j.jestch.2016.08.018.
[28] Moran, M.J., Sciubba, E. (1994). Exergy analysis: Principles and practice. The Journal of Engineering for Gas Turbines and Power, 116(2): 285-290, https://doi.org/10.1115/1.2906818
[29] Cengel, Y.A., Boles, M.A., Kanoğlu, M. (2011). Thermodynamics: An Engineering Approach. New York: McGraw-Hill, 5: 445.
[30] De Souza, G.F.M. (2012). Thermal power plant performance analysis. London: Springer. https://doi.org/10.1007/978-1-4471-2309-5
[31] Rajput, R.K. (2010). Engineering Thermodynamics, 3rd Edition. Jones & Bartlett Learning.
[32] Fallah, M., Siyahi, H., Ghiasi, R.A., Mahmoudi, S.M.S., Yari, M., Rosen, M.A. (2016). Comparison of different gas turbine cycles and advanced exergy analysis of the most effective. Energy, 116: 701-715. https://doi.org/10.1016/j.energy.2016.10.009
[33] Cengel, Y.A., Boles, M.A. (1991). Thermodynamics: An Engineering Approach-Manual de Respostas.
[34] Abam, F.I., Ugot, I.U., Igbong, D.I. (2012). Effect of operating variables on exergetic efficiency of an active gas turbine power plant. Journal of Emerging Trends in Engineering and Applied Sciences, 3(1): 131-136. https://hdl.handle.net/10520/EJC139267.
[35] Moran, M.J., Shapiro, H.N., Boettner, D.D., Bailey, M.B. (2014). Fundamentals of Engineering Thermodynamics, 8th Edition. Wiley Online Library.
[36] Pathirathna, K.A.B. (2013). Gas turbine thermodynamic and performance analysis methods using available catalog data. Master thesis, University of Gävle.
[37] Haouam, A., Derbal, C., Mzad, H. (2019). Thermal performance of a gas turbine based on an exergy analysis. In E3S Web of Conferences. EDP Sciences, 128: 01027. https://doi.org/10.1051/e3sconf/201912801027
[38] Živić, M., Galović, A., Avsec, J., Holik, M. (2016). Eksergijska analiza Braytonovog ciklusa s promjenjivim fizikalnim svojstvima i promjenjivim sastavom radne tvari. Tehnički Vjesnik, 23(3): 801-808. https://doi.org/10.17559/TV-20160208112755
[39] Eke, M.N., Okoroigwe, E.C., Umeh, S.I., Okonkwo, P. (2020). Performance improvement of a gas turbine power plant in Nigeria by exergy analysis: A case of Geregu 1. Open Access Library Journal, 7(9): 1-20. https://doi.org/10.4236/oalib.1106617
[40] Alhazmy, M.M., Najjar, Y.S. (2004). Augmentation of gas turbine performance using air coolers. Applied Thermal Engineering, 24(2-3): 415-429. https://doi.org/10.1016/j.applthermaleng.2003.09.006
[41] Mohapatra, A.K. (2014). Thermodynamic assessment of impact of inlet air cooling techniques on gas turbine and combined cycle performance. Energy, 68: 191-203. https://doi.org/10.1016/j.energy.2014.02.066
[42] Adumene, S. (2015). Load-based exergetic assessment of an offshore thermal power plant in an equatorial environment. Studies in Engineering and Technology, 3(1): 19-27. https://doi.org/doi.org/10.11114/set.v3i1.1177
[43] De Sa, A., Al Zubaidy, S. (2011). Gas turbine performance at varying ambient temperature. Applied Thermal Engineering 31(14-15): 2735-2739. https://doi.org/10.1016/j.applthermaleng.2011.04.045.
[44] Javadi, M.A., Hoseinzadeh, S., Khalaji, M., Ghasemiasl, R. (2019). Optimization and analysis of exergy, economic, and environmental of a combined cycle power plant. Sādhanā, 44: 1-11. https://doi.org/10.1007/s12046-019-1102-4
[45] Alnaimi, F.B.I., Singh, M.S.J., Al-Bazi, A., Al-Muhsen, N.F., Mohammed, T.S., Al-Hadeethi, R.H. (2021). Parametric investigation of combustion process optimization for gas turbines at SJ Putrajaya. Energy Reports 7: 5722-5732. https://doi.org/10.1016/j.egyr.2021.08.202
[46] Ebadi, M.J., Gorji-Bandpy, M. (2005). Exergetic analysis of gas turbine plants. International Journal of Exergy, 2(1): 31-39.
[47] Auda, S.A., Ali, O.M. (2023). Effect of operating conditions and air filters maintenance on the performance and efficiency of gas turbine power plant. Materials Today: Proceedings. https://doi.org/10.1016/j.matpr.2023.01.290
[48] Babaei Jamnani, M., Kardgar, A. (2020). Energy‐exergy performance assessment with optimization guidance for the components of the 396‐MW combined‐cycle power plant. Energy Science & Engineering, 8(10): 3561-3574. https://doi.org/10.1002/ese3.764
[49] Ibrahim, T.K., Basrawi, F., Awad, O.I., Abdullah, A.N., Najafi, G., Mamat, R., Hagos, F.Y. (2017). Thermal performance of gas turbine power plant based on exergy analysis. Applied Thermal Engineering, 115: 977-985. https://doi.org/10.1016/j.applthermaleng.2017.01.032
[50] Oyedepo, S.O., Fagbenle, R.O., Adefila, S.S., Alam, M.M. (2015). Exergoeconomic analysis and performance assessment of selected gas turbine power plants. World Journal of Engineering, 12(3): 283-300. https://doi.org/10.1260/1708-5284.12.3.283
[51] Ahmed, A.H., Ahmed, A.M., Hamid, Q.Y. (2020). Exergy and energy analysis of 150 MW gas turbine unit: A case study. Journal of Advanced Research in Fluid Mechanics and Thermal Sciences, 67(1): 186-192. https://semarakilmu.com.my/journals/index.php/fluid_mechanics_thermal_sciences/article/view/3769.
[52] Aljundi, I.H. (2009). Energy and exergy analysis of a steam power plant in Jordan. Applied Thermal Engineering, 29(2-3): 324-328. https://doi.org/10.1016/j.applthermaleng.2008.02.029