Souha Lehmam*![]() | Hind El Hassani
| Hind El Hassani![]()
© 2024 The authors. This article is published by IIETA and is licensed under the CC BY 4.0 license (http://creativecommons.org/licenses/by/4.0/).
OPEN ACCESS
Managing the customer-supplier relationship in procurement has always been characterized by its complexity, especially during crises. Large enterprises manage to mitigate risk thanks to their ability to adopt high-performance tools that ensure real-time visibility across their entire supply chain (SC). In contrast, small and medium-sized firms struggle to adapt. This study examines visibility enhancement strategies in emerging automotive markets taking the Moroccan model as a leading example, revealing that there are effective technological tools that are not accessible or widely adopted by most companies. To fill this gap, this study presents a conceptual architecture of a decision support tool that will assist manufacturers and researchers alike in achieving better visibility of their supply chain and identifying capacity risks based on the trilogy of customer, Tier I, and Tier II suppliers. Findings reveal that managing risk in the supply chain requires a multifaceted approach. Firstly, it identifies crucial measures such as establishing backup suppliers and planning overtime based on stakeholders' responsibilities, which are essential for mitigating risk. Secondly, the study proves that risk localization within the supply chain is feasible, enabling companies to target their risk management efforts more effectively. Finally, it underscores the significance of monitoring supplier performance through a dedicated key risk indicator (KRI) called supplier risk follow-up (SRF-U), ensuring that suppliers meet performance standards. These findings collectively provide a comprehensive strategy for improving supply chain resilience (SCR) and efficiency. This study implements a short-term solution, increases visibility, and responds quickly to complicated crises.
supply chain, resilience, risk management, Covid-19, visibility
The 16 November 2019 marked the first occurrence of Covid-19 in Wuhan, China. It proved to be one of the most disruptive crises to hit the global economy [1]. It not only struck the healthcare system but also severely crippled all other sectors [2]. Businesses had to face an unclear perspective and an uncertain future, which jeopardized the very survival and existence of some. The disruption propagated all over, causing a ripple effect [3, 4]. Simultaneous disruptions and interruptions in demand, supply and transportation have brought life to almost a standstill, particularly in a context of globalized markets where each country has become highly dependent upon the others. Hence the need to question the sustainability of the supply chain [3].
The current crisis has highlighted the need to be wary of the supply chain’s resilience and ensure that it is well- prepared to withstand unforeseen events, whose time, place and impact may not always be predicted [3, 5]. Indeed, rethinking and restructuring the supply chain are critical for ensuring any company’s continued survival in today’s markets, let alone achieving its growth targets. But the difficulty of multi-stage supply chains is the inability to predict risk and to maintain a high degree of visibility over the whole chain, due to the logistical chains’ complexity, companies are not able to track goods in real time right from the first upstream supplier.
Morocco at its level has suffered the consequences of similar internal and external crises. It has 3 industrial zones: Tangier Tetouan El Hoceima, Casablanca Settat and Rabat Salé Kenitra, where the 2 world leaders in the automotive industry Renault and Stellantis are positioned. There are also rank 1 and 2 equipment manufacturers in these 3 areas as well as in Fez, Meknes and Sous Massa. This distribution of production centers is concentrated on these first 3 areas given the number of limited ports located on Tangier and Casablanca and which are the only link export to the international knowing that Morocco is a leader in the automotive sector with an export rate that amounts to 90% mainly to Europe [6]. This concentration further complicates the fluidity of maritime and road flows given the lack of alternatives, infrastructure and the consequences of geopolitical tensions including inflation of energy and transport costs.
Choosing a supply chain visibility case study in Morocco offers a unique and compelling opportunity due to several factors. Morocco's automotive industry is in a phase of ongoing development, characterized by rapid growth and the integration of advanced technologies [7], although it is not yet fully developed and does not extensively use high technology [8]. The region's attractiveness due to lower labor costs and a skilled workforce further enhances its appeal for automotive manufacturing and supply chain operations. Additionally, Morocco's strategic location as a trade hub connecting Europe, Africa, and the Middle East adds complexity and relevance to studying supply chain visibility. Currently, visibility between customers and suppliers, including Tier I and Tier II suppliers, is still below target, with customers often lacking real-time access to information from their suppliers. Addressing inefficiencies such as communication gaps, inventory management challenges, and demand forecasting inaccuracies through improved visibility can significantly enhance operational efficiency and competitiveness. Moreover, the Moroccan government's support and investment in the automotive sector underscore the importance of optimizing supply chain practices to meet both regional and global market demands. This makes Morocco an ideal case study for exploring and implementing supply chain visibility improvements that can drive growth, innovation, and sustainability in the automotive industry.
Companies usually find it difficult to pinpoint the origin of a problem and which sub-tier supplier is involved [4]. They often rely on single sourcing to meet a specific cost target or decrease volumes so as not to seek a second or third backup supplier. Covid-19 has proven that proper management and monitoring of customer-supplier Tier I and II dependencies can bolster the immunity of the supply chain, knowing where the disruption would come from, which part would be shut down, therefore giving enough lead time to mitigate the risk before it occurs [9].
Lean manufacturing supply chains are more exposed to the risk of such incidents, just in time makes the supply chain more vulnerable and susceptible to failure at any time. The fluctuation of demand at the last minute coupled with the globalized nature of the supply chain is a major challenge that requires adequate contingency planning [10].
These crises also exposed the need for accelerated digital transformation, encompassing: big data analytics (BDA), end-to-end visibility, automation, 3D printing, Big Data, and blockchain [11, 12]. Consequently, any company that strengthens digital integration would be significantly better positioned and prepared to face similar incidents in the future [13].
Adaptability and recovery speed are likely to be key objectives in the future, but despite studies that address and propose solutions to similar events, the field of study remains fertile and generalized solutions are not yet established.
This study aims at developing a decision supporting tool architecture that will provide an early warning in case of risk. As such, it showcases the importance of end-to-end visibility. Existing studies propose solutions based on high cost of implementation digitalized solutions such as blockchain. This technology however is not tailored to the needs of all economies and remains out of reach for most companies worldwide. This study, in contrast, suggests a possible approach to identify, analyze, respond and control risk.
In order to develop our study and keep it up to date, we need to anchor our definitions and analyses on the latest trends and research that address concepts and themes related to SC, its visibility, resilience and its risk management.
2.1 Supply chain visibility
In order to understand supply chain visibility (SCV), it is first necessary to determine what it is exactly. The most common definition involves the ability to access information at any time, yet there are many different definitions and perspectives.
Previous studies focus on information sharing; Barrat and Oke defines SCV as the sharing of mutually important and valuable information [14]. Bartlett defines it as exchange of information through an e-space [15]. Phalh and Moxhan points the effective use of information. Wei and wang confirm that SCV is strongly linked to the extent to which a firm can acquire information and quickly recognize changes in environment [16]. Zhang related it to the ability of SC actor to give or get timely information through information technology (IT) systems [17]. Information sharing is therefore an integral part of visibility.
To conduct our study, we will consider visibility as defined by all those authors since they have common point “information sharing” yet different objectives to maintain visibility. Thus, useful information sharing needs to be facilitated through the use of digital technologies.
2.1.1 Information sharing
Information acts as the main driver for every decision-making process given the technological progress and emergence of numerous sources. Access to information is not always easy considering the massive amount of data which flows in different forms and characteristics such as: volume, velocity and variety [14, 18]. Data is either presented in transactional form, i.e. in a structured manner and from structured sources, or it is presented in unstructured form social media [18]. Which further complicates the retrieval and processing operations. Information sharing is a major challenge for the supply chain, which is becoming more complicated due to the degree of inter-connectivity and interdependence of its stakeholders. The sharing of information gets more difficult depending on the quality, integration and security of the information [19]. Knowing how to extract useful and accurate information could serve all actors to make better decisions, analyze, respond and control any risk, perform risk analysis and act proactively. Information sharing that meets all these criteria is mostly based on a high degree of collaboration and trust and becomes more prevalent in a collaborative supply chain (CSC) [20].
2.1.2 Digital technologies
Digital transformation is of vital importance for companies [21], it demands a shift in processes and needs to target SC resilience [12, 22]. It is a driving force for having access to accurate information in real time. Eliminating and reducing the risk of error and delayed decision making which can be costly.
As part of the 4.0 industrial revolution, supply chains have become increasingly digitized, mainly through the use of the cloud, BDA, internet of things (IOT), radio frequency identification (RFID), and robotics. This major shift has allowed for greater integration and interconnectivity, making information sharing laterally and vertically across the supply chain tree effortless and quasi-instantaneous thus significantly increasing visibility throughout the supply chain [23].
While these advanced digital tools such as IoT sensors, blockchain technology, and predictive analytics offer promising solutions for enhancing supply chain visibility [24], their adoption is not universal across all companies, particularly small to medium-sized enterprises (SMEs) [25]. Factors such as high implementation costs, limited technical expertise, and the scale of operations can hinder their widespread use [26, 27]. Moreover, reliance on legacy systems, risk aversion, and challenges in convincing suppliers to adopt compatible technologies further impede adoption [28]. From this arises the clear utility of implementing a tool capable of providing visibility across all categories of businesses. While these tools hold potential for improving efficiency and decision-making, their complexity and customization needs may render them impractical for smaller firms with limited resources and simpler supply chain structures. As technology continues to evolve, addressing these barriers and making advanced tools more accessible to smaller enterprises will be crucial for realizing the full benefits of supply chain visibility across the industry.
2.2 Supply chain resilience
The supply chain must be viable, be capable of absorbing the impact of sudden events, to rebuild itself subsequently to establish a new state which is not only adapted but also normalized [28-30]. The ability to quickly stabilize after a shock strengthens immunity and makes the adaptive supply chain (ASC) capable of protecting itself, thanks to the emergence of new technologies and artificial intelligence (AI) decision-making tools in real time, which saves time and improves the time at risk (TaR) [9, 28].
Before launching a car into production, where the vehicle is 100 functional and intended for sale to the general public. The components first go through body tests, where each component undergoes several tests in order to meet the constraints required by the specifications. Then vehicle tests, where the car is exposed to extreme conditions in order to evaluate its robustness. In the same way, in order to qualify a supply chain as resilient, one must take into account the nature, the environment and especially the economy to which it belongs. A small company must ensure its survival during a critical event, while a large one aims to maintain and even increase its turnover under similar conditions. The contingency plan is strongly linked to the size of the company and the level of complexity of its value chain. The multiplicity of actors renders decision-making in case of risk complicated and requires taking into account many uncertain non-fixed parameters [28].
2.3 Supply chain risk management (SCRM)
Risk as defined by ISO 31000 is ’the effect of uncertainty on objectives’. It can be both positive and profitable, therefore we, as managers, seek to maximize it. Or it can be negative, in which case we seek to minimize or even eliminate its effects if possible.
Risk is characterized by uncertainty, which is the probability that an event may or may not occur [9, 28]. This is also a main characteristic of the supply chain. A system in which several actors interact in physical, informational and financial flows and which is always threatened by internal and external stochastic events [9]. Risk is strongly linked to the supply chain, that’s why researchers and industrialists have and still are conducting massive studies to try to manage it. Hence, Ho et al define SCRM as: “an inter-organizational collaborative endeavor utilizing quantitative and qualitative risk management methodologies to identify, evaluate, mitigate and monitor unexpected macro and micro level events or conditions, which might adversely impact any part of a supply chain” [31]. Furthermore, collaborative risk management is a key element to improve and straighten supply chain resilience [32].
The purpose of risk management is to either accept, review or reject the impact of risk. It makes it possible to determine to what extent the risk is acceptable, to suggest KRIs, to test and to analyze by means of KRI. It is characterized by 4 steps [33]:
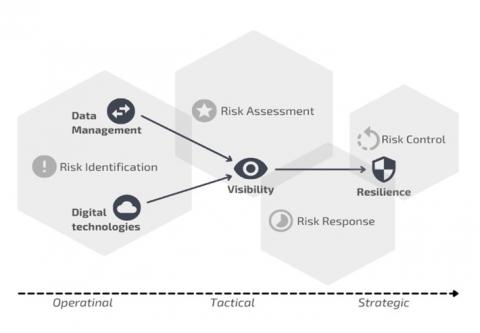
For efficient risk management, every company must have access to useful information, in real time, allowing a high level of visibility on almost all of its value chain and in either layer of its organizational focus (operation to strategic), thus bolstering its resilience. To this end, we have proposed a framework (Figure 1) that visualizes the objective of our study and clarifies the premise. The schema is divided into 3 parts:
Figure 1. Proposed framework of the link between SCV, SCR and SCRM
The disparity between articles read and the practical advantages of thorough study is starkly evident. While articles may offer solutions, implementing them requires significant investments of both time and money, resources often beyond the reach of SMEs. To bridge this gap effectively and based on previous definitions and analysis we have formulated the following research questions:
Addressing these questions offers several key advantages in navigating the complexities of supply chain management in emerging automotive markets. Firstly, understanding how visibility can be achieved across customers and suppliers allows businesses to anticipate potential disruptions and proactively manage their supply chains. Secondly, identifying main measures to implement in the event of risk occurrence enhances the organization's resilience, ensuring swift and effective responses to mitigate negative impacts. Lastly, exploring alternative strategies for SMEs to adapt without significant financial investments fosters innovation and sustainability, enabling these businesses to thrive amidst constraints. By tackling these questions head-on, companies can cultivate robust supply chain practices that foster agility, resilience, and long-term success in dynamic market environments.
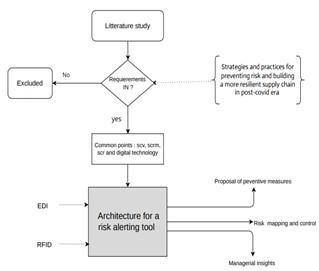
To conduct this study, 81 articles were scoped in google scholar and web of science databases featuring the keywords "supply chain", "SCRM", "SCR", "SCV", "digital transformation" and "Covid-19 SC insights". After removing duplicates, we kept 65 then we read the in totality with a focus on articles including all keywords cited above. Articles that don’t give insights about how to manage supply chain risk in a crisis situation were excluded. To finally retain 33 articles that contain mitigation guidelines against crises where visibility in risk management appears as a key common strategy for all concerned articles as shown in the (Figure 2).
Through previous review it is clear that supply chain visibility is a key factor in preventing and managing risk. This is the foundation on which to plan for a more resilient supply chain in the post-covid era. All studies on improving SCR are mostly based on the degree of visibility that stakeholders can achieve, be it upstream or downstream loop.
Figure 2. Methodology framework
Therefore, a decision-making tool architecture is developed that will allow to visualize the risk well before its occurrence, leaving time for decision makers to react proactively. The electronic data interchange (EDI) is used as an input to identify the way customer shares his demand with supplier and RFID is used to track inventory in real time which means the main scenario is related to demand vs stock. Next, series of measures were proposed to implement in case of risk materialization based on our own experience in the automotive field. Finally, an indicator is established to monitor the evolution of suppliers who present a capacity risk and who have succeeded (or not) in securing it.
3.1 Study model
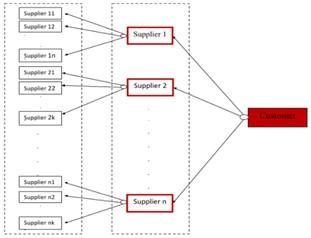
To be closer to reality, the model developed to illustrate the study is based on our own experience within 2 large multinationals in Morocco. In general, each customer in the automotive sector has at least 2 suppliers, and each supplier has at least 2 suppliers themselves and so on.
That’s why the chosen model for this study (Figure 3) takes into account a customer, n Tier I suppliers and k Tier II suppliers. A model is characterized by an objective function that is most often used to maximize profit, quality or minimize costs, CO2 emissions or any other parameter that fits the outlined goal. Constraints in a model designate the weaknesses that impede the fulfillment of the objectives. In our case, the main constraint is the risk minimization.
The risk can come from various causes depending on, among others, the procurement method. Once again, we have chosen to present the method in the following sub-section used in the majority of automotive companies with procurement lead times that vary according to the supplier's location, and fluctuations that can lead to stock-outs.
First, the procurement method is outlined to demonstrate the possibility of fluctuations that could lead to a shortage. Next, the constraints that trigger the risk alert are presented, and then the entire process is detailed on a workflow supported by a description algorithm.
Figure 3. Hierarchy of the proposed model
3.1.1 Procurement method
The client is the king in any value chain and the sustainability of business between the two or even the three parties depend first and foremost on fulfilling the client’s demands while respecting the project management triangle: cost, time, scope and quality.
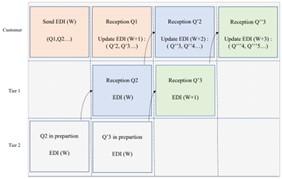
We will assume that ordering is conducted once a week (a common practice in the Moroccan automotive sector). In this model, the customer submits his order via an electronic data interchange that indicates the set quantity to be satisfied in the following week as well as the projected quantities to be filled as of w+1, which implies a high risk of fluctuation with the need. The Tier I supplier, being itself a customer as far as its Tier II supplier is concerned, undertakes the same procedure according to demand trends and available inventory as of every end of the week. The client’s projection in w+1 week constitutes therefore a fixed obligation between the Tier I supplier and the Tier II supplier. The Figure 4 illustrates this relationship in detail.
Figure 4. Procurement process
3.1.2 Risk Alert activation scenario
For our model, we propose the following assumptions considered necessary for the validity of the study:
With:
w: weekly interval [w1, w2...wr].
i: number of Tier I suppliers; i⸦ [0: n].
j: number of Tier II suppliers; j⸦ [0: m].
Cai: number of customers for the supplier i.
Qti,w: fixed quantity requested by the customer on w.
Qj,w-1: fixed quantity requested by the supplier i on w-1to the sub-supplier j.
St(i/j),w: remaining stock after delivery in the period w (or stock of coverage of x contractually binding days).
Capi,w: Tier I i supplier’s production capacity within w.
Capj,w: Tier II j supplier’s production capacity within w.
α: customer fluctuation on the forecast w+1 which becomes fixed during the week w.
α⸦[-p: p], where p is the contractually stipulated percentage of the permissible fluctuation.
Xd: production capacity of the required days to be covered on w +1(w=0) by the supplier.
Time in transit: time allocated for each supplier to prepare the goods; we consider 1 week for each level.
The customer sends the EDI which is the quantity of parts needed for the next week in w on a horizon H. a week w closes and w => w + H forecast. The reception of the request is done during the week w, to leave the supplier the time to program its manufacturing planning and scheduling (MPS).
The fixed quantity of the week w+1 constitutes a risk of fluctuation: Increase or decrease of the demand (constraint A).
(1) A: Qi, w*1±α>Sti, w
Demand(w+1) > stock end(w) + Xd(w+1)
stock end(w)=stock(w=EDI reception)+ days left* (inputs-outputs)
The quantity being already communicated in t from the Tier I supplier to the Tier II supplier (constraint B).
(2) B: Qj,w-1>Stj,w-1
As a consequence, risk R occurs when A or B happens:
|
A |
B |
R |
|
0 |
0 |
0 |
|
0 |
1 |
1 |
|
1 |
0 |
1 |
|
1 |
1 |
1 |
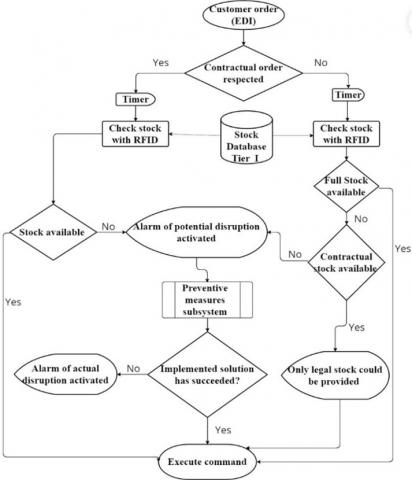
3.1.3 Shortage alert workflow
To identify the risk, we assume that this model is part of a computerized system proposed not only to alert the customer in case of risk either at the level of the supplier Tier I or Tier II, but also to track the eventual solutions of the 3 parties. However, when the alert is triggered, it is followed by a number of measures concatenated in the "preventive measures sub-system”. This sub-system consists of a number of solutions, among others, to prevent the risk before it actually occurs. This workflow is based on an if analysis technique that takes into account several possible scenarios depending on the comparison between customer demand and supplier stock. A detailed explanation is shown in algorithm 1.
Figure 5. Shortage alert workflow
Because operations repeat between [customer-supplier Tier I] and [supplier Tier I-supplier Tier II], and to ensure clarity and reader understanding, the [customer-supplier Tier I] operations are illustrated in Figure 5. The latter are of a deductive nature. Upon executing a command at the Tie r 2 level, it serves as input for Tier I stock database.
|
Algorithm 1: Shortage alert workflow description |
|
1: The Customer places the order 2: if -p<α<p then 3: The request is in an appropriate order and the customer is within the terms of the contract. 4: The system receives the order and then checks the stock using RFID in real time 5: if the stock is available then 6: The order is fulfilled. 7: else 8: The Potential Disruption alarm is triggered. 9: The optimization model is initiated which provides several preventive measures that may be used in mitigating or eliminating the risk. 10: if the measures are successful then 11: The order is fulfilled. 12: else 13: The Actual Disruption alarm is triggered, announcing the risk’s concretization. 14: end if 15: end if 16: else 17: if α>p then 18: The request is beyond the contracted limit, the client is notified of the discrepancy, yet the system receives the order and continues to check the stock using RFID in real time: 19: if the stock is available to cover the FULL amount, then 20: The contractual amount is fulfilled. 21: The decision to satisfy the surplus amount is left to the supplier. 22: else 23: if the stock is available to cover the contractual amount, then 24: The client is notified. 25: The contractual amount is fulfilled. 26: else 27: The Potential Disruption alarm is triggered. 28: The optimization model is initiated which provides several preventive measures that may be used in mitigating or eliminating the risk. 29: if the measures are successful then 30: The order is fulfilled. 31: else 32: The system triggers the Actual Disruption alarm. 33: end if 34: end if 35: end if 36: else 37: In this case α < p, there is no capacity risk but rather an oversupply that can be managed in the following orders. 38: end if 39: end if 40: The timer is used to designate the one-week time difference the dispatch of the EDI requests between supplier Tier I and Tier II (further detailed in the Procurement subsection) |
3.1.4 Measures to implement in case of risk materialization
To be closer to industry, we have gathered from the industrial field some measures taken in case of risk:
Assumptions:
K [1: H]: Number of backup suppliers allocated to each Tier I supplier.
Cfbk,w: transportation costs for sourcing from the backup supplier k.
Cpuk,w: unit part cost for sourcing from the backup supplier k.
Cafb: contractually agreed capacity between buyer and backup supplier.
Csupp: cost of overtime to offset the risk.
Nbcap: number of parts produced per hour by supplier i.
The first preventive measure is to schedule overtime at the supplier’s expense if there is insufficient capacity in the event that α⸦[-p: 0], otherwise it is at the customer’s expense. The number of overtime hours between the reception of the request and the end of the week necessary to fulfill the demand:
(3) Number of overtime hours=(Qti,w(1±α) - Sti,w)/Nbcap
With following overtime hours cost:
(4) Overtime hours cost = number of overtime hours*Csupp
The second preventive measure consists in sourcing the remainder from one of the backup suppliers, with a cost minimization objective function, called “disruption cost”. We suppose that for each supplier of the customer, there are several backup suppliers who deliver the same parts with the same quality in response to the same functional specification, our subsequent model will take into account only the Tier I which is directly linked to the customer. The same model can be used for the next-tier suppliers:
(5) Min disruption cost: min [((Qti,w*(1±α) - Sti,w)*Cpuk,w +Cfbk,w)*Yl]
Under the constraints:
Qti,w - Sti,w<Caf b constraint on capacity
Sum (quantity of backup suppliers) = residual (1±α)
Yl = 1 risk occurs Constraint of risk occurrence
0 if not
The resolution of the model is not the subject of this study given the availability of appropriate resolution tools such as Cplex or LP solve. If these solutions fail to solve the problem and the risk occurs and the shortage is realized, the actual disruption alert is triggered.
Among the workflow objectives is developing risk preventive measures and alternative solutions as part of a contingency plan adequate for each stakeholder of the model. Furthermore, it is necessary to monitor and control risk throughout the future. Thus, two measures are proposed to effectively manage the customer-supplier dispute and to establish an adequate cooperative management structure. The first one consists in accurately locating the source of the risk (risk localization). The second, is based on a KRI, specified for tracking and monitoring supplier performance over time. Some managerial insights are proposed to further investigate possible strategic measures that could be explored in future work to enable the stakeholders to get a more global and strategic outlook and facilitate meeting the objectives.
4.1 Risk localization
Among the main objectives of this system is risk control, therefore it is crucial to locate the exact source of the risk; in other words, to identify the responsible supplier. This will provide a two-way visibility that includes the client and its Tier I suppliers and a three-way visibility that includes all three parties (client-Tier I suppliers-Tier II suppliers).
To do this, the alert must be configured as a matrix.
Let A be the matrix assigned to the alert:
$A=\left[\begin{array}{cccc}T I[1] & T I[2] & \cdots & T[N] \\ T I I[1,1] & T I I[2,1] & \cdots & T I I[N, 1] \\ \vdots & \vdots & \ddots & \vdots \\ T I I[1, M] & T I I[2, M] & \cdots & T I I[N, M]\end{array}\right]$
Such that:
N: number of the client’s Tier 1 suppliers.
The increase in visibility by detecting/preventing risk along the supply chain has indeed allowed for a greater control of capability requirements. Moreover, through our proposed preventive measures and managerial insights we succeeded in minimizing risk occurrence, thus immunizing the SC against low-frequency, high-impact major events such as Covid-19. Nonetheless, our model is subject to intrinsic limitations arising from underlying assumptions, such as only taking three tiers into account, which does not reflect the complexity and over-stages that some real-world supply chains may exhibit. The model also relies on capacity as a warning criterion, many factors however, can also lead to a failure in meeting customer demand, such as transport delays, breakdowns, random stoppages, defective parts and other varying and unknown factors. The proposed solutions and preventive measures are thus by no means exhaustive and remain to be validated by an in-situ study.
Today’s crises have shown that supply chain risks need to be taken into account while designing appropriate strategies. The strategies developed in the past have proven to be insufficient and have shown that the ecosystem is not prepared for high impact events such as a pandemic. This study focuses on improving visibility through a model that facilitate on-time risk detection and its localization in an emerging automotive market such as Morocco since it serves as an ideal model for this study.
In the first step, we identified the drivers of resilience through a literature study. Visibility emerged as a crucial factor, consistently highlighted as a strategy to prepare the supply chain for the new normal, enabling it to either withstand or adapt to adverse effects. However, despite the extensive literature reviewed, the results remained theoretical, with no tangible tools being proposed.
In a second plan, an if analysis was done to enhance visibility resulting in an architecture that links the customer, his supplier and the supplier of his supplier. Main findings of the study can be divided into three sections.
Building on the findings of this paper, our study faces some limitations. Indeed, the model uses capacity as a warning criterion, customer demand may still not be met due to various issues such as transport delays, equipment breakdowns, unexpected stoppages, defective parts, and other unpredictable factors.
Future research scope may pursue a detailed examination of risk typology and tailored solutions for other unexpected risks including criteria’s other than capacity. It may also investigate the integration of artificial intelligence to enhance the proposed system reliability. Additionally, future work may explore the implementation of the concerned architecture within a real-world company to double prove its great usefulness in all situations and especially during complex crises.
|
SC |
Supply Chain |
|
SCV |
Supply Chain Visibility |
|
SCR |
Supply Chain Resiliency |
|
CSC |
Collaborative Supply Chain |
|
RFID |
Radio Frequency Identification |
|
IOT |
Internet of Things |
|
EDI |
Electronic Data Interchange |
|
KRI |
Key Risk Indicator |
|
KPI |
Key Performance Indicator |
|
KCI |
Key Control Indicator |
|
SCRM |
Supply Chain Risk Management |
|
MPS |
Manufacturing Planning and Scheduling |
|
TaR |
Time at Risk |
|
SMEs |
Small and Medium-Sized Enterprises |
|
BDA |
Big Data Analytics |
|
ASC |
Adaptive Supply Chain |
|
AI |
Artificial Intelligence |
|
QR |
Quick Response |
[1] Veselovská, L. (2020). Supply chain disruptions in the context of early stages of the global COVID-19 outbreak. Problems and Perspectives in Management, 18(2): 490-500. https://doi.org/10.21511/ppm.18(2).2020.40
[2] Deshmukh, S.G., Haleem, A. (2020). Framework for manufacturing in post-COVID-19 world order: An Indian perspective. International Journal of Global Business and Competitiveness, 15(1): 49-60. https://doi.org/10.1007/s42943-020-00009-1
[3] Linton, T., Vakil, B. (2020). Coronavirus is proving we need more resilient supply chains. Harvard Business Review, 5(5): 121-129. https://hbr.org/2020/03/coronavirus-is-proving-that-we-need-more-resilient-supply-chains, accessed on May 16, 2024.
[4] Ivanov, D., Dolgui, A. (2021). OR-methods for coping with the ripple effect in supply chains during COVID-19 pandemic: Managerial insights and research implications. International Journal of Production Economics, 232: 107921. https://doi.org/10.1016/j.ijpe.2020.107921
[5] Ivanov, D. (2021). Digital supply chain management and technology to enhance resilience by building and using end-to-end visibility during the COVID-19 pandemic. IEEE Transactions on Engineering Management, 1-11. https://doi.org/10.1109/TEM.2021.3095193
[6] Smail, B.O.U.M.A.H.D.I. (2023). Integration of Morocco in the global automotive value chains. African Scientific Journal, 3(17): 072-072. https://doi.org/10.5281/zenodo.7802207
[7] Haddach, A., Allal, L.B., Laglaoui, A., Ammari, M. (2017). Moroccan automotive industry: Opportunities and perspectives. Europe, 19857: 19726.
[8] Sassi, A., Ali, M.B., Ifassiouen, H., Sahaf, K., Rifai, S. (2022). The Supply Chain 4.0 in Moroccan automotive companies: A state of art. Journal of Operations Management, Optimization and Decision Support, 2(1): 49-56. https://doi.org/10.34874/IMIST.PRSM/jomods-v2i1.32955
[9] Christopher, M., Peck, H. (2024). Building the resilient supply chain. The International Journal of Logistics Management, 15(2): 1-14. https://doi.org/10.1108/09574090410700275.
[10] Fonseca, L.M., Azevedo, A.L. (2020). COVID-19: Outcomes for global supply chains. Management & Marketing, 15(s1): 424-438. https://doi.org/10.2478/mmcks-2020-0025
[11] Choi, T.M. (2021). Risk analysis in logistics systems: A research agenda during and after the COVID-19 pandemic. Transportation Research Part E: Logistics and Transportation Review, 145: 102190. https://doi.org/10.1016/j.tre.2020.102190
[12] Jones, M.D., Hutcheson, S., Camba, J.D. (2021). Past, present, and future barriers to digital transformation in manufacturing: A review. Journal of Manufacturing Systems, 60: 936-948. https://doi.org/10.1016/j.jmsy.2021.03.006
[13] Agrawal, M., Eloot, K., Mancini, M., Patel, A. (2020). Industry 4.0: Reimagining manufacturing operations after COVID-19. McKinsey & Company, 1-11. https://www.mckinsey.com/capabilities/operations/our-insights/industry-40-reimagining-manufacturing-operations-after-covid-19, accessed on May 16, 2024.
[14] Barratt, M., Oke, A. (2007). Antecedents of supply chain visibility in retail supply chains: A resource-based theory perspective. Journal of Operations Management, 25(6): 1217-1233. https://doi.org/10.1016/j.jom.2007.01.003
[15] Bartlett, P.A., Julien, D.M., Baines, T.S. (2007). Improving supply chain performance through improved visibility. The International Journal of Logistics Management, 18(2): 294-313. https://doi.org/10.1108/09574090710816986
[16] Wei, H.L., Wang, E.T. (2010). The strategic value of supply chain visibility: Increasing the ability to reconfigure. European Journal of Information Systems, 19(2): 238-249. https://doi.org/10.1057/ejis.2010.10
[17] Zhang, A.N., Goh, M., Meng, F. (2011). Conceptual modelling for supply chain inventory visibility. International Journal of Production Economics, 133(2): 578-585. https://doi.org/10.1016/j.ijpe.2011.03.003
[18] Li, L., Gong, Y., Wang, Z., Liu, S. (2023). Big data and big disaster: A mechanism of supply chain risk management in global logistics industry. International Journal of Operations & Production Management, 43(2): 274-307. https://doi.org/10.1108/IJOPM-04-2022-0266
[19] Sharma, V., Kumar, A., Kumar, M. (2021). A framework based on BWM for big data analytics (BDA) barriers in manufacturing supply chains. Materials Today: Proceedings, 47: 5515-5519. https://doi.org/10.1016/j.matpr.2021.03.374
[20] Wu, L., Chuang, C.H., Hsu, C.H. (2014). Information sharing and collaborative behaviors in enabling supply chain performance: A social exchange perspective. International Journal of Production Economics, 148: 122-132. https://doi.org/10.1016/j.ijpe.2013.09.016
[21] Taghizadeh, E., Taghizadeh, E. (2021). The impact of digital technology and Industry 4.0 on enhancing supply chain resilience. In Proceedings of the 11th Annual International Conference on Industrial Engineering and Operations Management, Singapore, pp. 9-11. https://doi.org/10.46254/AN11.20210379
[22] Bragazzi, N.L. (2020). Digital technologies-enabled smart manufacturing and Industry 4.0 in the post-COVID-19 era: Lessons learnt from a pandemic. International Journal of Environmental Research and Public Health, 17(13): 4785. https://doi.org/10.3390/ijerph17134785
[23] Sarkis, J. (2020). Supply chain sustainability: Learning from the COVID-19 pandemic. International Journal of Operations & Production Management, 41(1): 63-73. https://doi.org/10.1108/IJOPM-08-2020-0568
[24] Kumar, A., Liu, R., Shan, Z. (2020). Is blockchain a silver bullet for supply chain management? Technical challenges and research opportunities. Decision Sciences, 51(1): 8-37. https://doi.org/10.1111/deci.12396
[25] Horváth, D., Szabó, R.Z. (2019). Driving forces and barriers of Industry 4.0: Do multinational and small and medium-sized companies have equal opportunities? Technological Forecasting and Social Change, 146: 119-132. https://doi.org/10.1016/j.techfore.2019.05.021
[26] Choi, D., Chung, C.Y., Seyha, T., Young, J. (2020). Factors affecting organizations’ resistance to the adoption of blockchain technology in supply networks. Sustainability, 12(21): 8882. https://doi.org/10.3390/su12218882
[27] Büyüközkan, G., Göçer, F. (2018). Digital Supply Chain: Literature review and a proposed framework for future research. Computers in Industry, 97: 157-177. https://doi.org/10.1016/j.compind.2018.02.010
[28] Ivanov, D. (2021). Exiting the COVID-19 pandemic: After-shock risks and avoidance of disruption tails in supply chains. Annals of Operations Research, 1-18. https://doi.org/10.1007/s10479-021-04047-7
[29] Ivanov, D. (2021). Introduction to supply chain resilience: Management, modelling, technology. Springer, Cham. https://doi.org/10.1007/978-3-030-70490-2
[30] Ivanov, D. (2021). Supply chain viability and the COVID-19 pandemic: A conceptual and formal generalisation of four major adaptation strategies. International Journal of Production Research, 59(12): 3535-3552. https://doi.org/10.1080/00207543.2021.1890852
[31] Ho, W., Zheng, T., Yildiz, H., Talluri, S. (2015). Supply chain risk management: A literature review. International Journal of Production Research, 53(16): 5031-5069. https://doi.org/10.1080/00207543.2015.1030467
[32] Mwesiumo, D., Nujen, B.B., Buvik, A. (2021). Driving collaborative supply risk mitigation in buyer-supplier relationships. In Supply Chain Forum: An International Journal. Taylor & Francis, 22(4): 347-359. https://doi.org/10.1080/16258312.2021.1932567
[33] El Baz, J., Ruel, S. (2021). Can supply chain risk management practices mitigate the disruption impacts on supply chains’ resilience and robustness? Evidence from an empirical survey in a COVID-19 outbreak era. International Journal of Production Economics, 233: 107972. https://doi.org/10.1016/j.ijpe.2020.107972