Yeni Rimadeni![]() | Hizir Sofyan*
| Hizir Sofyan*![]() | Safrizal Rahman
| Safrizal Rahman![]() | Setia Pramana
| Setia Pramana![]() | Juellyan
| Juellyan![]()
© 2024 The authors. This article is published by IIETA and is licensed under the CC BY 4.0 license (http://creativecommons.org/licenses/by/4.0/).
OPEN ACCESS
The strategic siting of logistics distribution centers, particularly within the medical sector, has increasingly emerged as a crucial consideration in optimizing the supply chain. This study focuses on identifying the most advantageous location for a new logistics distribution center in Aceh Province, leveraging the integration of the analytical hierarchy process (AHP) and geographic information systems (GIS) overlay techniques. Parameters were weighted using AHP, and spatial analysis facilitated the classification of zones into three suitability categories: low, moderate, and high. It was determined that the optimal location for the establishment of a new center would be within a high suitability zone. Six potential sites, designated as Locations A through F, were initially identified. Subsequent evaluation, which included considerations of access road availability and the capacity to uniformly service all health-related warehouses, led to the selection of Location C as the most ideal. This selection underscores the importance of comprehensive spatial and hierarchical analysis in the decision-making process for logistics operations, ensuring effective distribution networks within critical sectors such as healthcare.
AHP, Aceh, geographic information system, logistic distribution center, weight factor
Logistics is crucial to effectively managing supply requirements and competing in the trade industry. Hence, identifying the logistics center is a crucial tactic that must be executed. An essential factor to consider when selecting a logistics center is its ability to facilitate the integration of diverse modes of transportation globally [1-3]. Nevertheless, significant calamities frequently obliterate transportation infrastructure and restrict transportation capacity. This results in the impeding and intricate nature of the logistics distribution process. An alternative is to utilize air transportation, specifically helicopters. Nevertheless, utilizing helicopters in distribution incurs significant costs and involves intricate procedures [4-6]. Hence, identifying the logistics center is an aspect that necessitates additional investigation. An assessment encompassing socio-economic, geographical, and disaster factors must be conducted to determine the optimal placement for a strategic logistics center. In terms of socio-economics, the logistics center should be strategically located to facilitate the efficient transportation of goods between different locations. Additionally, it should have convenient accessibility to minimize distribution costs [7, 8]. The logistics center must be located in a geographically safe area, free from natural disasters that could harm its infrastructure or the transportation routes connecting it to the distribution area. Natural disasters encompass seismic events such as earthquakes, tidal waves known as tsunamis, mass movements of land called landslides, and other catastrophic occurrences of natural origin [9-13].
Aceh, located in Indonesia, exhibits remarkably elevated seismic activity. This phenomenon results from multiple seismic sources, including subduction zones and faults that traverse the province. The 2004 earthquake in Indonesia was one of the most significant seismic events ever recorded. There was a tsunami that followed it, which caused significant property damage and over 250,000 fatalities. Transportation reached a standstill during this event, causing significant challenges in distributing essential logistics such as medicine and food [14-17]. Distributing medicines is one of the essential steps that must be carried out immediately when a disaster occurs [18, 19]. However, the situation changes if, simultaneously, the logistics center is impacted by a disaster, particularly the medical logistics center. This will result in logistical delays as the distribution of logistics needs to be carried out from distant logistics centers, which inevitably takes more time [5, 20-27]. An additional instance that can exemplify the significance of the medical logistics distribution process is the COVID-19 pandemic. The urgent priority in this situation is the immediate distribution of medicines and vaccines to all health facilities in response to the virus's rapid transmission [2, 28-30].
Hence, identifying the logistics center will require a comprehensive analysis involving multiple disciplines. To determine the optimal location for a logistics center and ensure its safety from potential natural disasters, it is necessary to conduct comprehensive reviews of various aspects. Multi-disciplinary assessment results are utilized to identify numerous study variables that must be assigned relative importance. Incorporating interdisciplinary research findings into the GIS framework assigns relative importance to numerous study variables identified through multi-disciplinary assessment results [23, 31-36]. The AHP and analytical network process (ANP) methods are two approaches that can be employed for weighting criteria [37]. The two approaches are applicable and can be seamlessly incorporated with GIS principles. Several studies have used the AHP framework to select a site. The AHP assesses and renders decisions involving multiple criteria. This approach offers multiple options based on specific criteria and assigns a relative score to each option. The AHP enables incorporating both subjective and objective elements into the decision-making process, facilitating the identification of the most crucial factors in intricate scenarios [37-46].
2.1 Research location
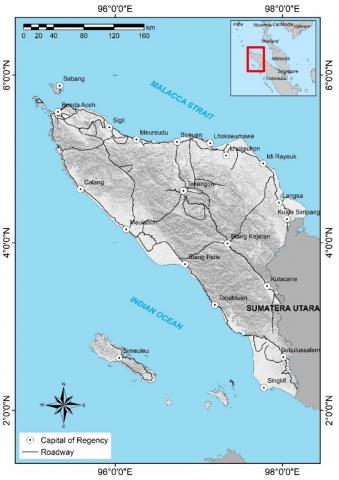
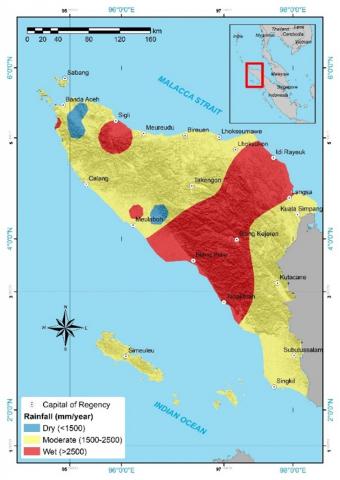
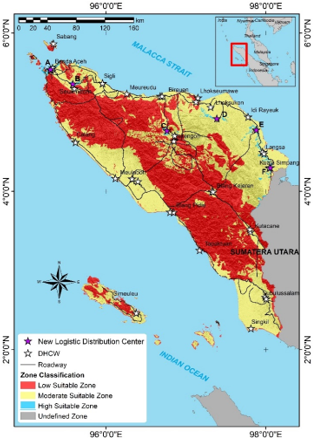
A case study was conducted in this study to test the results of the AHP analysis. The selected case study location is situated in Aceh Province, Indonesia. Geographically, the research site is located at 20-60 N and 950-980 E. On the northern and eastern sides, Aceh Province is bordered by Malaysia and the Strait of Malacca; on the southern side by North Sumatra Province; and on the western side by the Indian Ocean. Figure 1 displays the map of the case study location.
2.2 Material
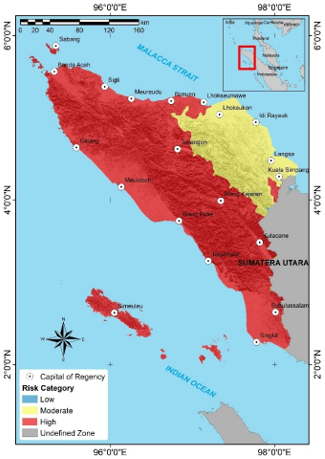
The data used in this study consists of secondary data collected from various references. The data consists of shapefiles for each parameter used in the study. Seven parameters were selected for this research, which include four hazard parameters (earthquake, landslide, tsunami, and volcanic activity), as well as land cover type, soil type, and annual rainfall. The first parameter used in this study is the earthquake vulnerability parameter. According to Priambodo et al. [47], the earthquake hazard vulnerability zones are divided into three categories: low, moderate, and high (descriptions for each classification can be seen in Table 1). Based on Priambodo et al. [47], the classification of earthquake hazard vulnerability zones in Aceh Province is divided into two categories: moderate and high (refer to Figure 2a).
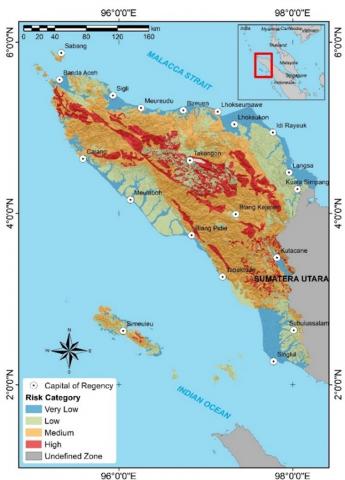
The second parameter used in this study is the landslide vulnerability zone. The landslide vulnerability zone is divided into four classifications: very low, low, medium, and high (each classification is explained in Table 1) [48]. In general, the coastal areas of Aceh Province are classified as having very low to low landslide vulnerability zones. This is because the coastal areas have relatively gentle slopes and lower elevations. On the other hand, the central areas with steeper relief and higher elevations are classified as medium- to high-landslide vulnerability zones (Figure 2b).
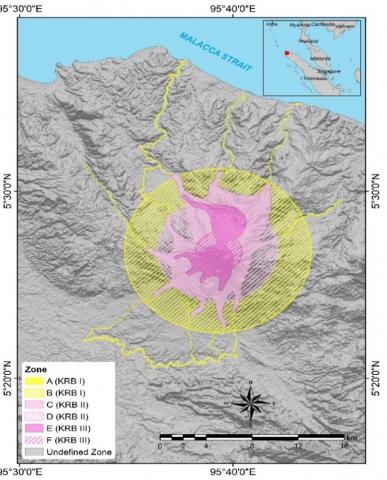
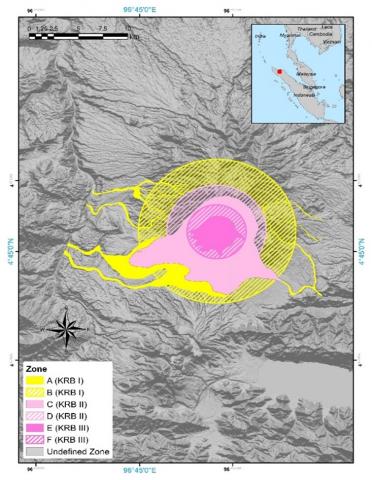
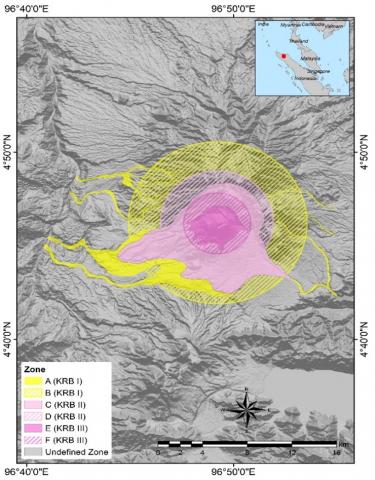
Moving on to the aspect of tsunami hazards, the tsunami hazard vulnerability zones in this study are divided into three categories: low, moderate, and high (descriptions for each classification are explained in Table 1). The map displaying the distribution of tsunami hazard vulnerability zones is shown in Figure 2c [49]. The last hazard parameter examined is the volcanic hazard vulnerability zone. Aceh Province has three active volcanoes, according to data from the Indonesian Meteorology, Climatology, and Geophysics Agency (BMKG): Seulawah Agam, Bur Ni Telong, and Peut Sagoe [50-52]. The volcanic hazard vulnerability zones are divided into six zones: A, B, C, D, E, and F (descriptions for each zone are displayed in Table 1). The first three zone groups, A, C, and E, represent zones of lava flow and lahars, while the other three zone groups, B, D, and F, represent zones of projectile rocks and volcanic ashfall. The distribution maps of the zones for each volcano are shown in Figure 3.
Figure 1. Research location
(a)
(b)
(c)
Figure 2. Hazard Map of Aceh, (a) Earthquake [47], (b) Landslide [48], (c) Tsunami Hazard Map of Banda Aceh City [49]
(a)
(b)
(c)
Figure 3. Volcano Hazard Map of Aceh, (a) Seulawah Agam [51], (b) Bur Ni Telong [52], (c) Peut Sagoe [49, 50]
Table 1. Hazard zone classification
|
Earthquake Hazard Zone Classification [47] |
|
|
Classification Zone |
Description |
|
Low |
The area has the potential to be affected by earthquake shaking with an intensity scale between V-VI MMI (Modified Mercally Intensity) |
|
Moderate |
The area has the potential to be hit by an earthquake with an intensity scale between VII-VIII MMI (Modified Mercally Intensity) |
|
High |
The area has the potential to be hit by strong earthquake shaking with an intensity scale greater than VIII MMI (Modified Mercally Intensity) |
|
Landslide Zone Classification [48] |
|
|
Classification Zone |
Description |
|
Very Low |
The zone has very low susceptibility to landslide evidence. The zone was rarely or never been subjected to landslide. There is no landmark of old or new landslide found in this zone, except on the small area on the river sides. The area is mostly flat to gentle undulating areas with natural slope less than 5-15%, and the slope is not formed by landslide deposits, filling material or plastic and swelling clay |
|
Low |
The zone has low susceptibility to landslide evidence. Landslide rarely occur unless the slope is disturbed and old landslide has been stabilized during the past period. Small landslide may occur especially on the river side or gulley. Interval of the natural slope is gentle (5-15%) to steep (30-50%), depending on the physical and engineering properties of rock and soil forming the slope. On the steep slope area, slope is mostly composed of rock with thin soil, and converted by dense vegetation in the form of forest and plantation |
|
Medium |
The zone has moderately susceptibility to landslide evidence. Landslide may occure in this zone, especially along the river side, scarp, road cut, of the slope to be disturbed. Old landslide may be activity especially when induced by high rainfall and strong erosion process. Interval of the natural slope is gentle (5-15%) to very steep (>70%), depending on the physical and engineering properties of rock and soil forming the slope. The slope is mostly covered by poor to very poor vegetation |
|
High |
The zone has high degree susceptibility to landslide. In this zone, landslide occur very frequently. Old and new landslides still occur induced by high rainfall or strong erosion process. Interval of the natural slope is moderate (30-50%) to very steep (>75%), depending on the physical and engineering properties of rock and soil forming the slope. The slope is mostly very poor coverage vegetation |
|
Tsunami Hazard Zone Classification [49] |
|
|
Classification Zone |
Description |
|
Low |
This area has the potential to be hit by a tsunami with an inundation height of less than 1m with a tsunami intensity scale of V or less |
|
Moderate |
This area has the potential to be hit by a tsunami with an inundation height of 1-3m with a tsunami intensity scale of V-VI |
|
High |
This area has the potential to be hit by a tsunami with an inundation height of >3m with a tsunami intensity scale of VII or more |
|
Classification of Volcanic Hazard Zone [50-52] |
|
|
Classification Zone |
Description |
|
A (KRB I) |
Potentially affected by lava flow |
|
B (KRB I) |
Potentially affected by ashfall and possible incandescent rockfalls |
|
C (KRB II) |
Potential for hot clouds, lava flows, and toxic gases |
|
D (KRB II) |
Potential for incandescent rock ejections and heavy ash rains |
|
E (KRB III) |
High potential for hot clouds, lava flows, and toxic gases |
|
F (KRB III) |
High potential for incandescent rockfalls and heavy ashfalls |
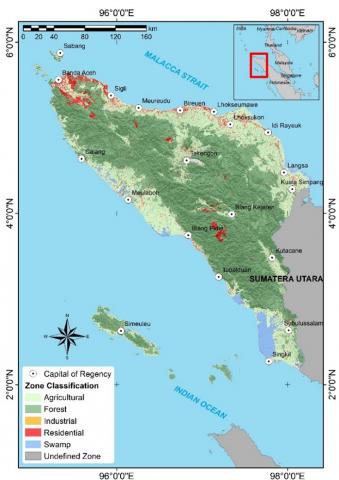
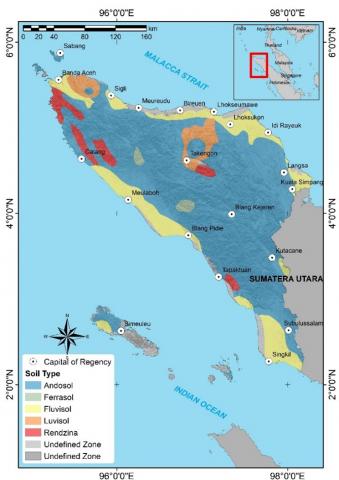
The next parameter used in the study is the land cover parameter. This parameter is used to determine the land use in a particular area. By understanding the land use types, we can select a more suitable area for the development of a logistic distribution center (LDC). Based on the Ministry of Environment and Forestry (2019), the land cover classification is divided into 19 categories, which are then modified and simplified into five classifications: industrial zone (including airports, seaports, and mining areas), forest zone (including primary and secondary dryland forests, plantation forests, and scrub zones), swamp zone (including swamp scrub, secondary mangrove forests, and primary and secondary swamp forests), residential zone (including residential areas, open lands, transmigration areas, savannahs, and grasslands), and agricultural zone (including plantations, dryland farming areas, mixed dryland farming areas, and ponds). More detailed explanations can be found in Table 2, while the map showing the distribution of land cover types in Aceh Province is displayed in Figure 4a [53]. Soil type is one of the parameters used in this study. The classification of soil types is based on the classification by the Food and Agriculture Organization of the United Nations (FAO/UNESCO). According to this classification, there are five soil types found in the study area: andosol, ferrasol, fluvisol, luvisol, and rendzina. The description of each soil type is provided in Table 2, while the map showing the distribution of soil types is displayed in Figure 4b [54]. The last parameter used in this study is annual rainfall. Essentially, these two parameters (rainfall and soil type) are closely related to each other. High rainfall can certainly affect the level or precipitation capacity of the soil in a particular location [55]. The classification of annual rainfall in this study is based on Indonesia's agroclimate resources. The average annual rainfall is divided into three classifications: dry, moderate, and wet. The classification and detailed descriptions are explained in Table 2. Furthermore, the map displaying the distribution of average annual rainfall in Aceh Province is shown in Figure 4c [56-58].
Table 2. Land cover, soil type, and rainfall classification
|
Land Cover Zone Classification [53] |
||
|
Classification Zone |
Description |
|
|
Industrial |
Airports, ports and mining zones fall under this zone. These zones are grouped by land use as areas that have been utilized and cannot be changed as new zones |
|
|
Forest |
Primary and secondary dryland forest, plantation forest and scrub zones belong to this zone. These zones are not recommended for use as they are mostly protected forest areas |
|
|
Swamp |
Swamp scrub, secondary mangrove forest, primary and secondary swamp forest belong to this zone. This zone is not recommended for use because it takes time to develop the area and also in terms of inadequate access |
|
|
Residential |
Residential, open land, transmigration, savannah and grassland zones fall under this zone. This zone is highly recommended for use as it already has access points and is easy to develop |
|
|
Agricultural |
Plantation, dryland farming, mixed dryland farming and ponds are classified in this zone. This zone is recommended for use as it already has access points and is easy to develop |
|
|
Soil Type Classification [54] |
||
|
Soil Type |
Contents |
Description |
|
Andosol |
Volcanic eject |
Andosols are highly porous, dark-coloured soils developed from parent material of volcanic origin, such as volcanic ash, tuff, and pumice |
|
Fluvisol |
Alluvial lowlands |
Fluvisols are found typically on level topography that is flooded periodically by surface waters or rising groundwater, as in river floodplains and deltas and in coastal lowlands |
|
Luvisol |
Clay accumulation; distinct seasons |
The mixed mineralogy, high nutrient content, and good drainage of these soils make them suitable for a wide range of agriculture, from grains to orchards to vineyards |
|
Ferralsol |
Deeply weathered, red or yellow soils of the humid tropics |
Clay assemblage dominated by low activity clays (mainly kaolinite) and a high content of sesquioxides |
|
Acrisol |
Acidic soils with a layer of clay accumulation; seasonally dry, humid tropics |
Clays with low cation exchange capacity |
|
Rendzina |
Humus-rich; shallow soils |
Carbonates or occasionally sulfate-rich |
|
Rainfall Zone Classification [57, 58] |
||
|
Classification Zone |
Description |
|
|
Wet |
The area that has an annual rainfall of >2,500mm/year |
|
|
Moderate |
The area that has an annual rainfall of 1,500-2,500mm/year |
|
|
Dry |
The area that has an annual rainfall <1,500mm/year |
|
(a)
(b)
(c)
Figure 4. (a) Landcover Map [53], (b) Soil Map [54], (c) Annual Rainfall Map [56]
2.3 Method
2.3.1 AHP
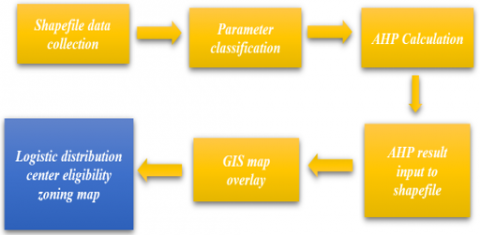
The method used in this research is AHP combined with the concept of GIS overlay. The study begins with the collection of shapefile data for each parameter, which is then classified based on specific references. The 7 parameters are analyzed, and weightings are calculated based on their level of importance. The higher the level of importance, the greater the assigned value. AHP is one of the methods classified under the multi-criteria decision-making (MCDM) approach. AHP is a popular method for decision-making compared to other methods because it can determine criteria that have significant importance compared to other parameters [59, 60]. Basically, the AHP method consists of three stages: creating a hierarchy tree based on importance levels, determining weights through pairwise comparison, and estimating the consistency level of the weighting [60, 61]. In other words, the weights assigned to indicators in AHP indicate the dominance and significance of each element compared to other indicators. Consistency between evaluations and weights is a critical aspect of AHP for factor weighting. The Consistency Index (CI) is used to ensure this consistency, which is defined as follows:
$C I=\frac{\lambda_{\max }-n}{n-1}$ (1)
where, n represents the order of a matrix, and λmax indicates the principal eigenvalue of a pairwise comparison matrix. Finally, the consistency ratio (CR) can be calculated using the following equation:
$C R=\frac{C I}{R I}$ (2)
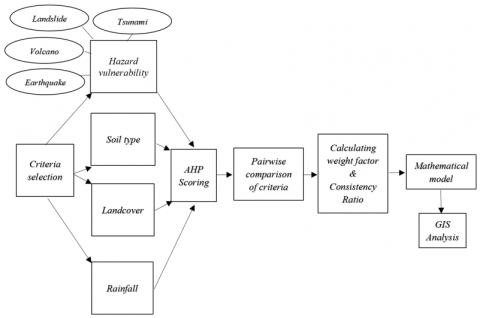
where, RI represents the random consistency index, which can be seen in Table 3. For simplicity, Figure 5 displays a detailed flowchart of the AHP analysis. The results of the AHP calculations for the 7 parameters, along with their respective sub-criteria, can be seen in Table 4.
2.3.2 GIS analysis
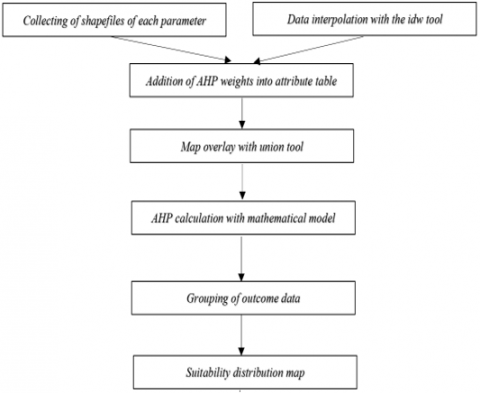
After the AHP weight calculations are completed, the next step is to input the calculated weights into each parameter's respective shapefile. In this study, GIS analysis is conducted using ArcGIS software. Some map shapefiles are obtained directly from secondary data, while there are also parameter map shapefiles obtained through interpolating secondary data, such as rainfall data. The average rainfall map is obtained by interpolating data from several rainfall observation stations owned by BMKG. Table 5 displays the interpolated rainfall data using the IDW tool in ArcGIS, resulting in a rainfall map as shown in Figure 4c.
Once each parameter map is prepared, the next step is to add the AHP weighting data field to each parameter. The data entered includes the weight factor of the main parameter and the pairwise weight factor for each parameter. These two values are then multiplied to obtain the weight value for each parameter. After all the parameters are weighted according to the AHP calculations, the next step is to apply the overlay technique to the seven weighted parameter maps. The overlay technique used is union, where all the parameters are combined into a new shapefile [62]. Next, the result of the overlay (union) is assigned a new attribute or field that is filled with values calculated using the mathematical model obtained from the AHP calculations. The calculation result with the mathematical model yields the AHP calculation values, which are then filtered based on predefined range classes. This filtering is useful for classifying zones that have the best potential to be selected as the location for the LDC. A detailed flowchart of the GIS analysis can be seen in Figure 6. In simpler terms, the overall analysis process can be seen in the research diagram displayed in Figure 7.
Table 3. Random consistency index (RI)
|
n |
RI |
|
1 |
0 |
|
2 |
0 |
|
3 |
0.58 |
|
4 |
0.90 |
|
5 |
1.12 |
|
6 |
1.24 |
|
7 |
1.32 |
|
8 |
1.41 |
|
9 |
1.45 |
|
10 |
1.49 |
|
11 |
1.52 |
|
12 |
1.54 |
Figure 5. AHP flowchart
Table 4. AHP calculation
|
AHP Pairwise Comparison Matrix (PCM) Calculation |
|||||||||||||||||||||||||||||||||||||||||
|
Soil Type |
Land Cover |
Earthquake Zone |
Tsunami Zone |
Landslide Zone |
Volcano Eruption |
Rainfall |
Priorities (P) |
Principal Eigen Value (PEV) |
Eigen Vector |
||||||||||||||||||||||||||||||||
|
Soil Type |
1.000 |
0.333 |
0.111 |
0.111 |
0.111 |
0.111 |
4.000 |
0.027 |
0.208 |
7.812 |
|||||||||||||||||||||||||||||||
|
Land Cover |
3.000 |
1.000 |
0.111 |
0.111 |
0.111 |
0.111 |
5.000 |
0.038 |
0.303 |
8.053 |
|||||||||||||||||||||||||||||||
|
Earthquake |
9.000 |
9.000 |
1.000 |
1.000 |
1.000 |
1.000 |
9.000 |
0.230 |
1.647 |
7.166 |
|||||||||||||||||||||||||||||||
|
Tsunami |
9.000 |
9.000 |
1.000 |
1.000 |
1.000 |
1.000 |
9.000 |
0.230 |
1.647 |
7.166 |
|||||||||||||||||||||||||||||||
|
Landslide |
9.000 |
9.000 |
1.000 |
1.000 |
1.000 |
1.000 |
9.000 |
0.230 |
1.647 |
7.166 |
|||||||||||||||||||||||||||||||
|
Volcano |
9.000 |
9.000 |
1.000 |
1.000 |
1.000 |
1.000 |
9.000 |
0.230 |
1.647 |
7.166 |
|||||||||||||||||||||||||||||||
|
Rainfall |
0.250 |
0.200 |
0.111 |
0.111 |
0.111 |
0.111 |
1.000 |
0.015 |
0.133 |
7.988 |
|||||||||||||||||||||||||||||||
|
Earthquake Vulnerability Zone Pairwise Comparison Matrix (PCM) Calculation |
|||||||||||||||||||||||||||||||||||||||||
|
Earthquake Zone |
Low |
Moderate |
High |
Priorities (P) |
PEV |
Eigen Vector |
|||||||||||||||||||||||||||||||||||
|
Low |
1.000 |
3.000 |
9.000 |
0.655 |
2.019 |
3.080 |
|||||||||||||||||||||||||||||||||||
|
Moderate |
0.333 |
1.000 |
7.000 |
0.290 |
0.892 |
3.080 |
|||||||||||||||||||||||||||||||||||
|
High |
0.111 |
0.143 |
1.000 |
0.055 |
0.169 |
3.080 |
|||||||||||||||||||||||||||||||||||
|
Landslide Vulnerability Zone Pairwise Comparison Matrix (PCM) Calculation |
|||||||||||||||||||||||||||||||||||||||||
|
Landslide Zone |
Very Slow |
Low |
Medium |
High |
Priorities (P) |
PEV |
Eigen Vector |
||||||||||||||||||||||||||||||||||
|
Very Slow |
1.000 |
2.000 |
2.000 |
9.000 |
0.432 |
1.805 |
4.176 |
||||||||||||||||||||||||||||||||||
|
Low |
0.500 |
1.000 |
3.000 |
9.000 |
0.338 |
1.446 |
4.275 |
||||||||||||||||||||||||||||||||||
|
Medium |
0.500 |
0.333 |
1.000 |
9.000 |
0.195 |
0.830 |
4.249 |
||||||||||||||||||||||||||||||||||
|
High |
0.111 |
0.111 |
0.111 |
1.000 |
0.034 |
0.141 |
4.160 |
||||||||||||||||||||||||||||||||||
|
Tsunami Vulnerability Zone Pairwise Comparison Matrix (PCM) Calculation |
|||||||||||||||||||||||||||||||||||||||||
|
Tsunami Zone |
Low |
Moderate |
High |
Priorities (P) |
PEV |
Eigen Vector |
|||||||||||||||||||||||||||||||||||
|
Low |
1.000 |
4.000 |
9.000 |
0.701 |
2.178 |
3.108 |
|||||||||||||||||||||||||||||||||||
|
Moderate |
0.250 |
1.000 |
6.000 |
0.243 |
0.755 |
3.108 |
|||||||||||||||||||||||||||||||||||
|
High |
0.111 |
0.167 |
1.000 |
0.056 |
0.175 |
3.108 |
|||||||||||||||||||||||||||||||||||
|
Vulcanic Vulnerability Zone Pairwise Comparison Matrix (PCM) Calculation |
|||||||||||||||||||||||||||||||||||||||||
|
Volcano Eruption |
A |
B |
C |
D |
E |
F |
Priorities (P) |
PEV |
Eigen Vector |
||||||||||||||||||||||||||||||||
|
A |
1.000 |
2.000 |
2.000 |
3.000 |
4.000 |
9.000 |
0.329 |
2.074 |
6.311 |
||||||||||||||||||||||||||||||||
|
B |
0.500 |
1.000 |
2.000 |
2.000 |
3.000 |
9.000 |
0.232 |
1.479 |
6.365 |
||||||||||||||||||||||||||||||||
|
C |
0.500 |
0.500 |
1.000 |
2.000 |
9.000 |
9.000 |
0.222 |
1.564 |
7.059 |
||||||||||||||||||||||||||||||||
|
D |
0.333 |
0.500 |
0.500 |
1.000 |
2.000 |
9.000 |
0.128 |
0.778 |
6.080 |
||||||||||||||||||||||||||||||||
|
E |
0.250 |
0.333 |
0.111 |
0.500 |
1.000 |
9.000 |
0.070 |
0.491 |
6.976 |
||||||||||||||||||||||||||||||||
|
F |
0.111 |
0.111 |
0.111 |
0.111 |
0.111 |
1.000 |
0.019 |
0.128 |
6.689 |
||||||||||||||||||||||||||||||||
|
Landcover Zone Classification Pairwise Comparison Matrix (PCM) Calculation |
|||||||||||||||||||||||||||||||||||||||||
|
Land Cover |
Industrial |
Forest |
Swamp |
Residential |
Agricultural |
Priorities (P) |
PEV |
Eigen Vector |
|||||||||||||||||||||||||||||||||
|
Industrial |
1.000 |
2.000 |
0.500 |
0.111 |
0.125 |
0.050 |
0.269 |
5.366 |
|||||||||||||||||||||||||||||||||
|
Forest |
0.500 |
1.000 |
0.500 |
0.111 |
0.250 |
0.044 |
0.232 |
5.323 |
|||||||||||||||||||||||||||||||||
|
Swamp |
2.000 |
2.000 |
1.000 |
0.111 |
0.167 |
0.070 |
0.364 |
5.207 |
|||||||||||||||||||||||||||||||||
|
Residential |
9.000 |
9.000 |
9.000 |
1.000 |
4.000 |
0.581 |
3.076 |
5.295 |
|||||||||||||||||||||||||||||||||
|
Agricultural |
8.000 |
4.000 |
6.000 |
0.250 |
1.000 |
0.255 |
1.396 |
5.463 |
|||||||||||||||||||||||||||||||||
|
Soil Type Pairwise Comparison Matrix (PCM) Calculation |
|||||||||||||||||||||||||||||||||||||||||
|
Soil Type |
Andosol |
Fluvisol |
Luvisol |
Ferrasol |
Acrisol |
Rendzina |
Priorities (P) |
PEV |
Eigen Vector |
||||||||||||||||||||||||||||||||
|
Andosol |
1.000 |
9.000 |
9.000 |
4.000 |
5.000 |
9.000 |
0.575 |
3.625 |
6.310 |
||||||||||||||||||||||||||||||||
|
Fluvisol |
0.111 |
1.000 |
2.000 |
2.000 |
2.000 |
0.500 |
0.102 |
0.705 |
6.947 |
||||||||||||||||||||||||||||||||
|
Luvisol |
0.111 |
0.500 |
1.000 |
1.000 |
2.000 |
1.000 |
0.081 |
0.518 |
6.423 |
||||||||||||||||||||||||||||||||
|
Ferrasol |
0.250 |
0.500 |
1.000 |
1.000 |
1.000 |
2.000 |
0.092 |
0.590 |
6.396 |
||||||||||||||||||||||||||||||||
|
Acrisol |
0.200 |
0.500 |
0.500 |
1.000 |
1.000 |
2.000 |
0.079 |
0.521 |
6.579 |
||||||||||||||||||||||||||||||||
|
Rendzina |
0.111 |
2.000 |
1.000 |
0.500 |
0.500 |
1.000 |
0.072 |
0.505 |
7.034 |
||||||||||||||||||||||||||||||||
|
Rainfall Pairwise Comparison Matrix (PCM) Calculation |
|||||||||||||||||||||||||||||||||||||||||
|
Rainfall |
Wet |
Moderate |
Dry |
Priorities (P) |
PEV |
Eigen Vector |
|||||||||||||||||||||||||||||||||||
|
Wet |
1.000 |
0.500 |
1.000 |
0.250 |
0.750 |
3.000 |
|||||||||||||||||||||||||||||||||||
|
Moderate |
2.000 |
1.000 |
2.000 |
0.500 |
1.500 |
3.000 |
|||||||||||||||||||||||||||||||||||
|
Dry |
1.000 |
0.500 |
1.000 |
0.250 |
0.750 |
3.000 |
|||||||||||||||||||||||||||||||||||
Table 5. Annual rainfall data [56]
|
X |
Y |
Station |
Rainfall (mm/year) |
|
96.42702 |
4.257144 |
Krueng Seunagan |
617.5 |
|
95.56333 |
5.37025 |
Desa Seuneubok |
2138.8 |
|
95.36989 |
5.536033 |
Desa Cot Irie |
1707.43 |
|
96.58098 |
4.0512 |
Gunung Kong |
4456.5 |
|
95.45833 |
5.422558 |
Desa Kp. Lheue |
1059.1 |
|
95.49589 |
5.363611 |
Desa Siron Blang |
127 |
|
97.95225 |
4.164472 |
Peunaron |
2288.11 |
|
95.2391 |
5.359892 |
Pulau Tiga |
2854.68 |
|
96.20003 |
4.311306 |
Sarah Mane |
2647.8 |
|
95.85882 |
5.220469 |
Sawang Teubee |
3272.45 |
|
97.6803 |
4.634925 |
U. Gadeng |
2748.97 |
Figure 6. GIS analysis flowchart
Figure 7. Research flow chart
3.1 Results
3.1.1 Weight factor and mathematical model
The results of the weight calculations for AHP are presented in Table 6. The AHP calculations are based on weighting according to the level of importance of each parameter. The AHP weights are calculated for both the main criteria and sub-criteria. Based on the AHP calculations, a mathematical model can be derived that can be used in GIS analysis. The model equation is as follows:
$\begin{gathered}L D C=0.23(E+L s+T s+V)+0.038 L c+0.027 S t +0.017 R\end{gathered}$
where, LDC represents the logistic distribution center, E represents the weight of the earthquake parameter, Ls represents the weight of the landslide parameter, Ts represents the weight of the tsunami parameter, V represents the weight of the volcano parameter, Lc represents the weight of the landcover parameter, St represents the weight of the soil type parameter, and R represents the weight of the rainfall parameter. Furthermore, the results of the CR testing are displayed in Table 7. In addition to the CR testing, sensitivity analysis is also conducted, and the results are presented in Table 8.
Table 6. AHP Weight factor scale result
|
Parameter |
AHP Weight Factor Scale |
|
|
Earthquake |
0.23 |
|
|
Landslide |
0.23 |
|
|
Tsunami |
0.23 |
|
|
Volcano |
0.23 |
|
|
Landcover |
0.038 |
|
|
Soil Type |
0.027 |
|
|
Rainfall |
0.015 |
|
|
AHP Pairwise Calculation |
||
|
Parameter |
AHP Pairwise Weight Factor |
AHP Weight Factor |
|
Earthquake Hazard |
||
|
Low |
0.655 |
0.23 |
|
Moderate |
0.29 |
|
|
High |
0.055 |
|
|
Landslide Hazard |
||
|
Very Low |
0.432 |
0.23 |
|
Low |
0.338 |
|
|
Medium |
0.195 |
|
|
High |
0.034 |
|
|
Tsunami Hazard |
||
|
Low |
0.701 |
0.23 |
|
Moderate |
0.243 |
|
|
High |
0.056 |
|
|
Volcanic Hazard |
||
|
A (KRB I) |
0.329 |
0.23 |
|
B (KRB I) |
0.232 |
|
|
C (KRB II) |
0.222 |
|
|
D (KRB II) |
0.128 |
|
|
E (KRB III) |
0.07 |
|
|
F (KRB III) |
0.019 |
|
|
Landcover |
||
|
Industrial |
0.05 |
0.038 |
|
Forest |
0.044 |
|
|
Swamp |
0.07 |
|
|
Residential |
0.581 |
|
|
Agricultural |
0.255 |
|
|
Soil Type |
||
|
Andosol |
0.575 |
0.027 |
|
Fluvisol |
0.102 |
|
|
Luvisol |
0.081 |
|
|
Ferralsol |
0.092 |
|
|
Acrisol |
0.079 |
|
|
Rendzina |
0.072 |
|
|
Rainfall |
||
|
Wet |
0.25 |
0.017 |
|
Moderate |
0.5 |
|
|
Dry |
0.25 |
|
Table 7. Consistency ratio testing
|
Parameter |
Eigen Value |
CI |
n |
RI |
CR |
|
Main criteria |
7.503 |
0.084 |
7.000 |
1.320 |
0.063 |
|
Soil type |
6.615 |
0.123 |
6.000 |
1.240 |
0.099 |
|
Land cover |
5.331 |
0.083 |
5.000 |
1.120 |
0.074 |
|
Earthquake |
3.080 |
0.040 |
3.000 |
0.580 |
0.069 |
|
Tsunami |
3.108 |
0.054 |
3.000 |
0.580 |
0.093 |
|
Landslide |
4.215 |
0.072 |
4.000 |
0.900 |
0.080 |
|
Volcano |
6.580 |
0.116 |
6.000 |
1.240 |
0.094 |
|
Rainfall |
3.000 |
0.000 |
3.000 |
0.580 |
0.000 |
Table 8. Sensitivity analysis
|
Criterion |
Trial 1 |
Trial 2 |
Main Result |
|
Soil Type |
2.56 |
3.19 |
2.66 |
|
Land Cover |
3.12 |
4.46 |
3.76 |
|
Earthquake Zone |
23.05 |
22.6 |
22.98 |
|
Tsunami Zone |
23.05 |
22.6 |
22.98 |
|
Landslide Zone |
23.05 |
22.6 |
22.98 |
|
Volcano Eruption |
23.05 |
22.6 |
22.98 |
|
Rainfall |
2.1 |
1.94 |
1.66 |
3.1.2 GIS analysis
The GIS analysis was conducted using the ArcGIS software. A case study was developed using the obtained mathematical model, and the study location was Aceh Province, Indonesia. The weights obtained from the AHP analysis for each parameter were incorporated into shapefiles or polygons representing each parameter in the case study. The map overlay was performed using the ArcGIS software, specifically utilizing the union tool (as explained in Section 3.2.2). The calculation of the LDC in the Aceh region was carried out using the equation mentioned in Section 4.1.1. Subsequently, grouping was performed based on predetermined ranges, resulting in a map illustrating the distribution of suitability zones for the construction of a LDC in Aceh Province, as shown in Figure 8.
Figure 8. The recommendation of logistic distribution center location based on AHP and GIS analysis
3.2 Discussion
3.2.1 Weight factor
The process of analysis or weighting using the AHP method can be seen more concisely in Figure 7. As explained earlier, disaster parameters are given higher priority than other parameters, resulting in a weight value of 0.23 for the disaster parameter. As for the alternatives or sub-criteria within each disaster parameter, zones with the lowest risk receive the highest weight values compared to other zones. This is done with the aim of identifying strategic and safe locations for potential natural disasters. The parameters that are considered to be represented by the earthquake vulnerability parameter are the earthquake source zone parameters (subduction zones and faults) and the distribution of earthquake acceleration levels. Both parameters serve the purpose of identifying areas that would experience greater impacts during an earthquake event and determining the areas closest to the earthquake source. However, these two parameters are adequately represented since the analysis or determination of earthquake vulnerability zones already incorporates them [14, 63, 64]. The second parameter chosen is the landslide vulnerability parameter. The landslide vulnerability parameter is considered to represent three other parameters: elevation, terrain morphology, and slope. This is because in the analysis of vulnerability zones, these three parameters are inherently included in the analysis process [65, 66]. This parameter is primarily used with the aim of minimizing the possibility of soil movement at the future distribution center location.
Another selected disaster parameter is tsunami hazard vulnerability. This aspect is considered to be one of the crucial parameters in this study. The classification of tsunami hazard vulnerability zones is primarily conducted in coastal areas, which are the areas that receive the most severe impacts.
The volcanic eruption hazard The volcanic eruption hazard parameter is the last selected disaster parameter. This parameter is used to avoid areas that are prone to disaster if a volcano erupts.
One of the limitations of this study is the lack of socio-economic parameters included in the analysis. Socio-economic parameters that could be important to incorporate include land ownership data for each area. This information would be useful in determining whether a location has the rights or permits to construct buildings or if the location has the appropriate purchasing power when it is selected as a LDC area.
Residential zones are selected as sub-criteria with the highest weight. This is due to the accessibility criterion, as residential areas generally have open and easily accessible roads. Similarly, agricultural zones are chosen with the assumption that their access is guaranteed since they are usually located near residential areas. However, the weight of these zones is not equivalent to that of residential zones due to factors such as land conversion. Generally, access to agricultural zones is not as good as that of residential zones, so if agricultural zones are converted into LDC locations, the effectiveness of the logistic distribution may be reduced due to their potentially more remote locations compared to residential areas.
Industrial zones have a lower weight because they typically serve as ports or mining areas, which are less strategic if located in inland areas (in the case of mining areas). Ports and airports are already considered separate strategic areas, making them unsuitable for selection as LDC locations. Wetland zones also have a lower weight due to cost-effectiveness considerations. It would require extra costs to reclaim wetland areas, making them less recommended as LDC locations. Additionally, these zones have limited accessibility. Forest zones are strongly discouraged as they not only lack accessibility but are also often protected forest areas, making them highly unsuitable as LDC locations.
Regarding soil types, weighting is based on the soil content, where materials with higher precipitation levels receive higher weight values compared to those with lower precipitation levels. As for the rainfall parameter, moderate rainfall has a higher weight than wet and dry rainfall. This is because excessive rainfall increases the likelihood of soil movement in areas with high relief and slope, while low rainfall increases the possibility of limited or difficult access to water. The results of the consistency level testing can be seen in Table 7. The CR obtained from the AHP analysis with 7 parameters is 0.063 < 0.1. Similarly, for all criteria, the CR is also <0.1. Therefore, it can be concluded that the degree of inconsistency is considered satisfactory [37]. The CR refers to how consistent or stable the pairwise comparisons that have been established are. Calculating the CR is important to ensure that the final results of the AHP analysis are more reliable and valid. When the CR value approaches zero, it indicates that the pairwise comparisons are highly consistent (an example of such a result is the calculation of the sub-criteria rainfall (CR = 0.000)). However, if the CR value is too high, it indicates that the calculations are inconsistent and a recalculation is necessary [67-69]. Fundamentally, the AHP method has advantages in terms of its usage. It can be easily scaled and adjusted according to its level of importance. The method is highly compatible with GIS analysis due to its simple weighting system. However, a different scenario arises when there are excessive alternative variations and expert opinions, which can lead to an extensive workflow due to differing results. Inconsistency can also be experienced with this method when there are too many variations in decision-making. However, this can be minimized by conducting CR testing [70, 71]. One of the other MCDM methods that can be used as a benchmark with the AHP method is the Preference Ranking Organization Method for Enrichment Evaluation (PROMETHEE). This method has the advantage of providing rankings for alternatives, either partially or as a whole. However, it does not explain in detail the method for determining the importance level of each parameter [70, 72]. Therefore, in research that involves determining criteria based on their importance level and does not involve too many alternatives, the AHP method is highly recommended for use. This is because it can easily be combined with GIS, making it a suitable choice for such studies.
3.2.2 Sensitivity analysis
Sensitivity analysis is conducted with the aim of determining the parameters that have the greatest impact on determining the location of LDCs. Sensitivity testing is performed through two trials: trial 1 involves changing the importance values of alternatives (sub-criteria), while trial 2 involves changing the importance values of main criteria (this reweighting process is done by seeking opinions from two different experts). The results of the sensitivity analysis are presented in Table 8.
In trial 1, the altered alternatives or sub-criteria are related to parameters such as landslides, tsunamis, earthquakes, and landcover. In trial 2, the importance values of the main criteria are changed, specifically for non-hazard parameters such as rainfall, soil type, and landcover. Based on Table 8, it can be observed that there is an increase in priority for hazard-related parameters in trial 1, while non-hazard parameters experience a decrease. Similarly, in trial 2, there is an increase in priority for hazard-related parameters, while non-hazard parameters experience a decrease. Based on these results, it can be concluded that hazard-related parameters (including earthquakes, tsunamis, landslides, and volcanoes) have the greatest impact in the AHP analysis for determining LDC locations.
3.2.3 Case study
The province of Aceh was chosen as the case study location based on the results of the AHP analysis and modeling in this study. The selection of parameters and their respective weights is fundamentally based on the existing conditions in the Indonesian region, particularly Aceh. Indonesia is an area that is highly prone to disasters [73]. Therefore, disaster-related parameters become crucial factors to include in the AHP analysis for determining the location of LDCs. Earthquakes are one of the significant parameters in this study, considering their frequent occurrence in the province of Aceh. One of the largest earthquakes ever recorded in Aceh was the 9.1 Mw earthquake in 2004, accompanied by a devastating tsunami that caused infrastructure damage and the loss of lives. Building upon this event, the earthquake parameter becomes an essential component to be considered in this study. The high occurrence of earthquakes in Aceh can be attributed to various factors, including the presence of seismic sources such as subduction zones and the Sumatra fault passing through the region [74-76]. In addition to earthquakes and tsunamis, the presence of active volcanoes also underlies the reason why disaster-related parameters are prioritized over others. Furthermore, the occurrence of landslides in highland areas, such as the Tangse region, is another strong reason for prioritizing disaster-related parameters. Therefore, the prioritization of disaster-related parameters, including earthquakes, tsunamis, active volcanoes, and landslides, is justified based on their significant impact and occurrence in the study area. [77, 78]. Using ArcGIS software (with the "Union" tool), a map overlay was performed on the seven parameter maps generated (Figures 2-4). The result of the map overlay is presented in Figure 8. Based on the overlay of the seven parameter maps, which were assigned AHP weight values, calculation values ranging from 0.0017 to 0.3000 were obtained. These values were then divided into three equally sized ranges: 0-0.1 (low suitable zone) with a total area of 29,033.58 km², 0.1-0.2 (moderate suitable zone) with a total area of 28,663.028 km², and 0.2-0.3 (high suitable zone) with a total area of 117.76 km². This division is based on the weighting of each parameter class, where classes with higher importance criteria have higher weights than those with less important criteria (using the benefit criteria concept). Therefore, locations with higher AHP values are chosen as highly suitable locations compared to locations with lower AHP values [79-81]. Figure 8 displays the overlay of the map, including the locations of health warehouses in each district within Aceh Province (indicated by white star symbols) and the recommended locations for the new LDC based on the analysis (indicated by purple star symbols). The new recommended locations are chosen within the high-suitable zone, which fulfills specific criteria such as easy road access, strategic positions (close to city centers), and the ability to reach the health warehouses in each district. Based on these criteria, location C can be selected as the LDC for Aceh Province. This decision is influenced by the central position of location C within Aceh Province, allowing for evenly distributed travel distances to the health warehouses in each district, whether they are located in the northern or southern parts of the province. On the other hand, locations A, B, D, E, and F can still be considered as potential LDC locations due to their accessibility via national roads. However, their positions, being either too far north or too far south in the province, make them less prioritized as the central LDC. Furthermore, no suitable zones for selecting a LDC were found in the western part of Aceh Province based on the AHP analysis mentioned above.
The AHP method has proven to be a useful approach for weighting parameters based on their level of importance. In determining the location of LDCs, seven parameters were considered. These parameters include four disaster-related factors (earthquake hazard, landslide hazard, tsunami hazard, and volcanic eruption hazard), land cover, soil type, and rainfall. The selection of each parameter was carefully considered to adapt to the environmental conditions and obtain the most ideal results. However, there are several limitations that need to be considered when using the AHP approach for weighting. One prominent limitation is the significant level of bias that can arise if expert opinions vary greatly. This can make it challenging to prioritize parameters with higher importance. One way to minimize bias or errors is by conducting a CR test and sensitivity analysis. These tests can help assess the validity of the AHP analysis results and identify parameters that have the most significant impact.
Based on the applied case study, the results yielded a high level of accuracy and alignment with expectations. The suitability zones were distributed according to the weighted importance levels, and the high suitable zone was only found in specific areas that truly met the ideal criteria based on the weighting of each parameter. However, it is worth noting that this research has limitations, such as the absence of socio-economic parameters in the AHP analysis to determine LDCs. It is hoped that future studies will address this limitation by incorporating more complex parameters to achieve more ideal and accurate results. Additionally, the inclusion of additional weighting methods could provide further comparative insights.
The research was conducted in Aceh Province, Indonesia. Data analysis and manuscript preparation are part of the Doctoral Dissertation Research Program (PDD) funded by the Ministry of Education, Culture, Research, and Technology of Indonesia under contract number [658/UN11.2.1/PT.01.03/DPRM/2023].
Hizir Sofyan, as the corresponding author, has contributed to overseeing all the authors in preparing the manuscript. Y. Rimadeni has prepared the manuscript and collected shapefile data from various references. S. Rahman has conducted the AHP weighting. S. Pramana has participated in interpreting the AHP results and manuscript preparation. Juellyan has prepared all the maps and figures, as well as interpreted the results.
[1] Yıldırım, V.O.L.K.A.N., Atasoy, B.U.R.A., Başer, V. (2021). Determining most suitable areas for logistics centers by using GIS and S-MCDM. https://www.researchgate.net/publication/353973274.
[2] Yang, Y., Ma, C., Zhou, J., Dong, S., Ling, G., Li, J. (2022). A multi-dimensional robust optimization approach for cold-chain emergency medical materials dispatch under COVID-19: A case study of Hubei Province. Journal of Traffic and Transportation Engineering (English Edition), 9(1): 1-20. https://doi.org/10.1016/j.jtte.2022.01.001
[3] Ertem, M.A., Akdogan, M.A., Kahya, M. (2022). Intermodal transportation in humanitarian logistics with an application to a Turkish network using retrospective analysis. International Journal of Disaster Risk Reduction, 72: 102828. https://doi.org/10.1016/j.ijdrr.2022.102828
[4] Xavier, I.R., de Mello Bandeira, R.A., de Oliveira Silva, L., Bandeira, A.D.P.F., Campos, V.B.G. (2019). Employing helicopters in the modelling of last mile distribution system in large-scale disasters. Transportation Research Procedia, 37: 306-313. https://doi.org/10.1016/j.trpro.2018.12.197
[5] Wang, D., Yang, K., Yang, L., Dong, J. (2023). Two-stage distributionally robust optimization for disaster relief logistics under option contract and demand ambiguity. Transportation Research Part E: Logistics and Transportation Review, 170: 103025. https://doi.org/10.1016/j.tre.2023.103025
[6] Xavier, I.R., Bandeira, R.A., Bandeira, A.P., Campos, V.B., Silva, L.O. (2020). Planning the use of helicopters in distribution of supplies in response operations of natural disasters. Transportation Research Procedia, 47: 633-640. https://doi.org/10.1016/j.trpro.2020.03.141
[7] Saldanha-da-Gama, F. (2022). Facility location in logistics and transportation: An enduring relationship. Transportation Research Part E: Logistics and Transportation Review, 166: 102903. https://doi.org/10.1016/j.tre.2022.102903
[8] Timperio, G., Kundu, T., Klumpp, M., de Souza, R., Loh, X.H., Goh, K. (2022). Beneficiary-centric decision support framework for enhanced resource coordination in humanitarian logistics: A case study from ASEAN. Transportation Research Part E: Logistics and Transportation Review, 167: 102909. https://doi.org/10.1016/j.tre.2022.102909
[9] Baharmand, H., Comes, T., Lauras, M. (2019). Bi-objective multi-layer location-allocation model for the immediate aftermath of sudden-onset disasters. Transportation Research Part E: Logistics and Transportation Review, 127: 86-110. https://doi.org/10.1016/j.tre.2019.05.002
[10] Nayeem, M.K., Alam, S.T. (2022). A scenario-based stochastic programming model for multi-commodity distribution considering disruption in distribution network. Results in Control and Optimization, 8: 100167. https://doi.org/10.1016/j.rico.2022.100167
[11] Zhu, T., Boyles, S.D., Unnikrishnan, A. (2022). Two-stage robust facility location problem with drones. Transportation Research Part C: Emerging Technologies, 137: 103563. https://doi.org/10.1016/j.trc.2022.103563
[12] Wang, S.L., Sun, B.Q. (2023). Model of multi-period emergency material allocation for large-scale sudden natural disasters in humanitarian logistics: Efficiency, effectiveness and equity. International Journal of Disaster Risk Reduction, 85: 103530. https://doi.org/10.1016/j.ijdrr.2023.103530
[13] Oksuz, M.K., Satoglu, S.I. (2020). A two-stage stochastic model for location planning of temporary medical centers for disaster response. International Journal of Disaster Risk Reduction, 44: 101426. https://doi.org/10.1016/j.ijdrr.2019.101426
[14] Juellyan, J., Setiawan, B., Hasan, M., Saidi, T. (2022). Quantifying the seismicity parameters of a new model of seismic source zone for Aceh and surrounding areas. Aceh International Journal of Science and Technology, 11(3): 210-219. https://doi.org/10.13170/aijst.11.3.28360
[15] Lay, T., Kanamori, H., Ammon, C.J., Nettles, M., Ward, S.N., Aster, R.C., Beck, S.L., Bilek, S.L., Brudzinski, M.R., Butler, R., Deshon, H.R., Ekström, G., Satake, K., Sipkin, S. (2005). The great Sumatra-Andaman earthquake of 26 December 2004. Science, 308(5725): 1127-1133. https://doi.org/10.1126/science.1112250
[16] Sengara, I.W. (2008). Seismic hazard and microzonation for a district in Banda Aceh city post 2004 great Sumatra earthquake. In the 14th World Conference on Earthquake Engineering, Beijing, China, pp. 12-17.
[17] Bruni, M.E., Beraldi, P., Khodaparasti, S. (2018). A fast heuristic for routing in post-disaster humanitarian relief logistics. Transportation Research Procedia, 30: 304-313. https://doi.org/10.1016/j.trpro.2018.09.033
[18] Sellevold, E., May, T., Gangi, S., Kulakowski, J., McDonnell, I., Hill, D., Grabowski, M. (2020). Asset tracking, condition visibility and sustainability using unmanned aerial systems in global logistics. Transportation Research Interdisciplinary Perspectives, 8: 100234. https://doi.org/10.1016/j.trip.2020.100234
[19] Maghfiroh, M.F., Hanaoka, S. (2020). Multi-modal relief distribution model for disaster response operations. Progress in Disaster Science, 6: 100095. https://doi.org/10.1016/j.pdisas.2020.100095
[20] Jamkhaneh, H.B., Shahin, R., Tortorella, G.L. (2022). Analysis of Logistics 4.0 service quality and its sustainability enabler scenarios in emerging economy. Cleaner Logistics and Supply Chain, 4: 100053. https://doi.org/10.1016/j.clscn.2022.100053
[21] Tantri, F., Amir, S. (2022). Optimizing response strategies of healthcare system in a large-scale disaster. Journal of Safety Science and Resilience, 3(4): 288-301. https://doi.org/10.1016/j.jnlssr.2022.06.001
[22] Omidvari, M., Nouri, J., Mapar, M. (2015). Disaster risk assessment pattern in higher education centers. Global Journal of Environmental Science and Management, 1(2): 125-136. https://doi.org/10.7508/gjesm.2015.02.004
[23] Alavipoor, F.S., Karimi, S., Balist, J., Khakian, A.H. (2016). A geographic information system for gas power plant location using analytical hierarchy process and fuzzy logic. Global Journal of Environmental Science and Management, 2(2): 197-207. https://doi.org/10.7508/gjesm.2016.02.010
[24] da Silva, R.C., de Azevedo, A.R., Cecchin, D., do Carmo, D., Marvila, M.T., Adesina, A. (2022). Study on the implementation of reverse logistics in medicines from health centers in Brazil. Cleaner Waste Systems, 2: 100015. https://doi.org/10.1016/j.clwas.2022.100015
[25] Khodaee, V., Kayvanfar, V., Haji, A. (2022). A humanitarian cold supply chain distribution model with equity consideration: The case of COVID-19 vaccine distribution in the European Union. Decision Analytics Journal, 4: 100126. https://doi.org/10.1016/j.dajour.2022.100126
[26] Praneetpholkrang, P., Kanjanawattana, S. (2021). A multi-objective optimization model for shelter location-allocation in response to humanitarian relief logistics. The Asian Journal of Shipping and Logistics, 37(2): 149-156. https://doi.org/10.1016/j.ajsl.2021.01.003
[27] Gao, X., Jin, X., Zheng, P., Cui, C. (2021). Multi-modal transportation planning for multi-commodity rebalancing under uncertainty in humanitarian logistics. Advanced Engineering Informatics, 47: 101223. https://doi.org/10.1016/j.aei.2020.101223
[28] Božić, D., Šego, D., Stanković, R., Šafran, M. (2022). Logistics in healthcare: A selected review of literature from 2010 to 2022. Transportation Research Procedia, 64: 288-298. https://doi.org/10.1016/j.trpro.2022.09.033
[29] Aydin, N., Cetinkale, Z. (2023). Simultaneous response to multiple disasters: Integrated planning for pandemics and large-scale earthquakes. International Journal of Disaster Risk Reduction, 86: 103538. https://doi.org/10.1016/j.ijdrr.2023.103538
[30] Perdana, T., Onggo, B.S., Sadeli, A.H., Chaerani, D., Achmad, A.L.H., Hermiatin, F.R., Gong, Y. (2022). Food supply chain management in disaster events: A systematic literature review. International Journal of Disaster Risk Reduction, 79: 103183. https://doi.org/10.1016/j.ijdrr.2022.103183
[31] Nickdoost, N., Jalloul, H., Choi, J. (2022). An integrated framework for temporary disaster debris management sites selection and debris collection logistics planning using geographic information systems and agent-based modeling. International Journal of Disaster Risk Reduction, 80: 103215. https://doi.org/10.1016/j.ijdrr.2022.103215
[32] Yu, W. (2020). Reachability guarantee based model for pre-positioning of emergency facilities under uncertain disaster damages. International Journal of Disaster Risk Reduction, 42: 101335. https://doi.org/10.1016/j.ijdrr.2019.101335
[33] Falowo, O.O., Ojo, O. (2023). Multi-criteria groundwater potential zonation using GIS-based fuzzified AHP: Case study of Ondo metropolis Southwestern Nigeria. Solid Earth Sciences, 8(4): 319-344. https://doi.org/10.1016/j.sesci.2023.11.002
[34] Ma, Y., Wang, J., Xiong, J., Sun, M., Wang, J. (2024). Risk assessment for cropland abandonment in mountainous area based on AHP and PCA-Take Yunnan Province in China as an example. Ecological Indicators, 158: 111287. https://doi.org/10.1016/j.ecolind.2023.111287
[35] Ahmad, M.S., Khan, S. (2023). Comparative analysis of analytical hierarchy process (AHP) and frequency ratio (FR) models for landslide susceptibility mapping in Reshun, NW Pakistan. Kuwait Journal of Science, 50(3): 387-398. https://doi.org/10.1016/j.kjs.2023.01.004
[36] Acar, C., Haktanır, E., Temur, G.T., Beskese, A. (2024). Sustainable stationary hydrogen storage application selection with interval-valued intuitionistic fuzzy AHP. International Journal of Hydrogen Energy, 49: 619-634. https://doi.org/10.1016/j.ijhydene.2023.10.081
[37] Saaty, T.L. (2004). Decision making-the analytic hierarchy and network processes (AHP/ANP). Journal of Systems Science and Systems Engineering, 13: 1-35. https://doi.org/10.1007/s11518-006-0151-5
[38] Harishnaika, N., Arpitha, M., Ahmed, S.A., Ashwini, K.S. (2023). Geospatial investigation of site suitability for ecotourism development using AHP and GIS techniques in Uttara Kannada district, Karnataka state, India. World Development Sustainability, 3: 100114. https://doi.org/10.1016/j.wds.2023.100114
[39] Chen, Y., Lin, Q., Wang, Y., Li, H. (2024). AHP-based quantitative evaluation of radiation safety in nuclear technology utilization units. Journal of Radiation Research and Applied Sciences, 17(1): 100806. https://doi.org/10.1016/j.jrras.2023.100806
[40] Abdullah, A.G., Shafii, M.A., Pramuditya, S., Setiadipura, T., Anzhar, K. (2023). Multi-criteria decision making for nuclear power plant selection using fuzzy AHP: Evidence from Indonesia. Energy and AI, 14: 100263. https://doi.org/10.1016/j.egyai.2023.100263
[41] Arshad, M., Hasan, M.A., Al Mesfer, M.K., Al Alwan, B.A., Qureshi, M.N., Eldirderi, M. (2023). Sustainable landfill sites selection using geospatial information and AHP-GDM approach: A case study of Abha-Khamis in Saudi Arabia. Heliyon, 9(6). https://doi.org/10.1016/j.heliyon.2023.e16432
[42] [Guo, Q., Liu, M. (2023). Dynamic assessment of eco-civilization in Guangdong Province based on geographic information system (GIS) and analytic hierarchy process (AHP). Heliyon, 9(12). https://doi.org/10.1016/j.heliyon.2023.e22579
[43] Abdullahi, A., Jothimani, M., Getahun, E., Gunalan, J., Abebe, A. (2023). Assessment of potential groundwater Zones in the drought-prone Harawa catchment, Somali region, eastern Ethiopia using geospatial and AHP techniques. The Egyptian Journal of Remote Sensing and Space Science, 26(3): 628-641. https://doi.org/10.1016/j.ejrs.2023.07.005
[44] Etongo, D., Bristol, U., Epule, T.E., Bandara, A., Sinon, S. (2023). Expert elicitations of smallholder agroforestry practices in Seychelles: A SWOT-AHP analysis. Regional Sustainability, 4(3): 282-295. https://doi.org/10.1016/j.regsus.2023.08.006
[45] Malakar, S., Rai, A.K. (2023). Estimating seismic vulnerability in West Bengal by AHP-WSM and AHP-VIKOR. Natural Hazards Research, 3(3): 464-473. https://doi.org/10.1016/j.nhres.2023.06.001
[46] Sáenz-Royo, C., Chiclana, F., Herrera-Viedma, E. (2024). Ordering vs. AHP. Does the intensity used in the decision support techniques compensate? Expert Systems with Applications, 238: 121922. https://doi.org/10.1016/j.eswa.2023.121922
[47] Priambodo, I.C., Omang, A., Athanasius. (2014). Earthquake hazard zone map Aceh Darussalam province. Aceh.
[48] Surono. (2009). Landslide hazard map of nanggroe Aceh Darussalam province. Aceh.
[49] Athanasius. (2012). Tsunami hazard map Banda Aceh City, Aceh Darussalam Province. Banda Aceh.
[50] Rizal, S., Sumpena, A.D., Pujowarsito. (2007). Volcanic hazard map of peut sagoe volcano sumatra, Nanggroe Aceh Darussalam. Aceh.
[51] Kartadinata, M.N., Patria, C., Purwoto. (2007). Volcanic hazard map of seulawah agam volcano sumatra, Nanggroe Aceh Darussalam Province. Aceh.
[52] Hadisantono, R.D., Rizal, S., Pujowarsito, Purwoto, Patria, C. (2008). Volcanic hazard map of bur ni telong volcano sumatra, Nanggroe Aceh Darussalam Province. Aceh.
[53] Ministry of Environment and Forestry. (2019). Land Cover Map of Aceh Province. Aceh.
[54] Food and Agriculture Organization of the United Nations. (2003). The Digital Soil Map of The World.
[55] Dunkerley, D. (2021). The importance of incorporating rain intensity profiles in rainfall simulation studies of infiltration, runoff production, soil erosion, and related land surface processes. Journal of Hydrology, 603: 126834. https://doi.org/10.1016/j.jhydrol.2021.126834
[56] Meteorology Climatology and Geophysics Agency. (2013). Rainfall data for January-December 2013 at each observation station in Aceh Province. Aceh.
[57] Pramudia, A., Susanti, E., Auranda, M. (2021). Analysis of rainfall data to develop the classification criteria for identifying agro-climate resources on the field. In IOP Conference Series: Earth and Environmental Science. IOP Publishing, 824(1): 012065. https://doi.org/10.1088/1755-1315/824/1/012065
[58] Susanti, E., Surmaini, E., Pramudia, A., Heryani, N., Estiningtyas, W., Suciantini, S., Apriyana, Y. (2021). Pemutakhiran Peta sumberdaya agroklimat Indonesia untuk mendukung perencanaan pertanian. Jurnal Tanah dan Iklim, 45(1): 47-58. https://doi.org/10.21082/jti.v45n1.2021.47-58
[59] Jena, R., Pradhan, B., Beydoun, G. (2020). Earthquake vulnerability assessment in Northern Sumatra province by using a multi-criteria decision-making model. International Journal of Disaster Risk Reduction, 46: 101518. https://doi.org/10.1016/j.ijdrr.2020.101518
[60] Shadmaan, M.S., Popy, S. (2023). An assessment of earthquake vulnerability by multi-criteria decision-making method. Geohazard Mechanics, 1(1): 94-102. https://doi.org/10.1016/j.ghm.2022.11.002
[61] Aghataher, R., Delavar, M.R., Nami, M.H., Samnay, N. (2008). A fuzzy-AHP decision support system for evaluation of cities vulnerability against earthquakes. World Applied Sciences Journal, 3(1): 66-72.
[62] Esri. How Union Works. https://pro.arcgis.com/en/pro-app/3.1/tool-reference/analysis/how-union-analysis-works.htm.
[63] Mulargia, F., Stark, P.B., Geller, R.J. (2017). Why is probabilistic seismic hazard analysis (PSHA) still used? Physics of the Earth and Planetary Interiors, 264: 63-75. https://doi.org/10.1016/j.pepi.2016.12.002
[64] Yu, R., Song, Y., Guo, X., Yang, Q., He, X., Yu, Y. (2022). Seismic hazard analysis for engineering sites based on the stochastic finite-fault method. Earthquake Science, 35(5): 314-328. https://doi.org/10.1016/j.eqs.2022.05.007
[65] Sonker, I., Tripathi, J.N., Singh, A.K. (2021). Landslide susceptibility zonation using geospatial technique and analytical hierarchy process in Sikkim Himalaya. Quaternary Science Advances, 4: 100039. https://doi.org/10.1016/j.qsa.2021.100039.
[66] Pavel, M., Nelson, J.D., Fannin, R.J. (2011). An analysis of landslide susceptibility zonation using a subjective geomorphic mapping and existing landslides. Computers & Geosciences, 37(4): 554-566. https://doi.org/10.1016/j.cageo.2010.10.006
[67] Khan, A., Chatterjee, S., Weng, Y. (2021). 3 - UHI drivers and mapping the urban thermal environment. In Urban Heat Island Modeling for Tropical Climates, pp. 69-115. https://doi.org/10.1016/B978-0-12-819669-4.00003-9
[68] Polykretis, C. (2023). Comparison of “subjectivity” and “objectivity” in expert-based landslide susceptibility modeling. In Geoinformatics for Geosciences, Elsevier, pp. 281-308. https://doi.org/10.1016/B978-0-323-98983-1.00017-X
[69] Basak, D., Bose, A., Roy, S., Chowdhury, I.R. (2023). Understanding the forest cover dynamics and its health status using GIS-based analytical hierarchy process: A study from Alipurduar district, West Bengal, India. In Water, Land, and Forest Susceptibility and Sustainability, Elsevier, pp. 475-508. https://doi.org/10.1016/B978-0-323-91880-0.00014-3
[70] Ma, W., Du, Y., Liu, X., Shen, Y. (2022). Literature review: Multi-criteria decision-making method application for sustainable deep-sea mining transport plans. Ecological Indicators, 140: 109049. https://doi.org/10.1016/j.ecolind.2022.109049
[71] Yannis, G., Kopsacheili, A., Dragomanovits, A., Petraki, V. (2020). State-of-the-art review on multi-criteria decision-making in the transport sector. Journal of Traffic and Transportation Engineering (English Edition), 7(4): 413-431. https://doi.org/10.1016/j.jtte.2020.05.005
[72] Sen, D.K., Datta, S., Patel, S.K., Mahapatra, S.S. (2015). Multi-criteria decision making towards selection of industrial robot: Exploration of PROMETHEE II method. Benchmarking: An International Journal, 22(3): 465-487. https://doi.org/10.1108/BIJ-05-2014-0046
[73] Warsito, G.M., Budiharsana, M.P., Burns, S., Hartono, B. (2021). Hazed targets of the silver bullets: Transformation of disaster risk reduction policy into measurable actions in Indonesia development agenda. International Journal of Disaster Risk Reduction, 54: 102029. https://doi.org/10.1016/j.ijdrr.2020.102029
[74] Muksin, U., Bauer, K., Muzli, M., Ryberg, T., Nurdin, I., Masturiyono, M., Weber, M. (2019). AcehSeis project provides insights into the detailed seismicity distribution and relation to fault structures in Central Aceh, Northern Sumatra. Journal of Asian Earth Sciences, 171: 20-27. https://doi.org/10.1016/j.jseaes.2018.11.002
[75] Yunita, H., Setiawan, B., Saidi, T., Abdullah, N. (2018). Site response analysis for estimating seismic site amplification in the case of Banda Aceh-Indonesia. In MATEC Web of Conferences, EDP Sciences, 197: 10002. https://doi.org/10.1051/matecconf/201819710002
[76] Setiawan, B., Hasan, M., Yunita, H., Sungkar, M., Saidi, T. (2023). Comparing gardner-knopoff, gruenthal, and uhrhammer earthquake declustering methods in Aceh, Indonesia. In IOP Conference Series: Earth and Environmental Science, IOP Publishing, 1245(1): 012010. https://doi.org/10.1088/1755-1315/1245/1/012010
[77] Basri, H., Rusdi, M., Lubis, N.R. (2021). Expert judgement criteria for mapping landslide susceptibility in tangse sub-district, Pidie District, Aceh Province, Indonesia. In IOP Conference Series: Earth and Environmental Science, IOP Publishing, 667(1): 012059. https://doi.org/10.1088/1755-1315/667/1/012059
[78] Amri, U., Azizah, C., Robo, S., Ismy, R., Sastriawan, H. (2023). Lake cliff landslide mitigation–A case study of lut tawar peusangan lake, Aceh, Indonesia. Journal of Ecological Engineering, 24(2): 165-172, https://doi.org/10.12911/22998993/156699
[79] Vafaei, N., Ribeiro, R.A., Camarinha-Matos, L.M. (2016). Normalization techniques for multi-criteria decision making: Analytical hierarchy process case study. In Technological Innovation for Cyber-Physical Systems: 7th IFIP WG 5.5/SOCOLNET Advanced Doctoral Conference on Computing, Electrical and Industrial Systems, DoCEIS 2016, Costa de Caparica, Portugal, April 11-13, 2016, Proceedings. Springer International Publishing. Springer, Cham, 7: 261-269. https://doi.org/10.1007/978-3-319-31165-4_26
[80] Vafaei, N., Ribeiro, R.A., Camarinha-Matos, L.M. (2020). Selecting normalization techniques for the analytical hierarchy process. In Technological Innovation for Life Improvement: 11th IFIP WG 5.5/SOCOLNET Advanced Doctoral Conference on Computing, Electrical and Industrial Systems, DoCEIS 2020, Costa de Caparica, Portugal, July 1-3, 2020, Proceedings. Springer International Publishing. Springer, Cham. 11: 43-52. https://doi.org/10.1007/978-3-030-45124-0_4
[81] Rahmat, Z.G., Niri, M.V., Alavi, N., Goudarzi, G., Babaei, A.A., Baboli, Z., Hosseinzadeh, M. (2017). Landfill site selection using GIS and AHP: A case study. Behbahan, Iran. KSCE Journal of Civil Engineering, 21: 111-118. https://doi.org/10.1007/s12205-016-0296-9