Dian Trihastuti*![]() | Dian Retno Sari Dewi
| Dian Retno Sari Dewi![]() | Hadi Santosa | Evi Yuliawati
| Hadi Santosa | Evi Yuliawati![]()
© 2024 The authors. This article is published by IIETA and is licensed under the CC BY 4.0 license (http://creativecommons.org/licenses/by/4.0/).
OPEN ACCESS
The textile industry is one of the manufacturing industries experiencing rapid growth. This follows the magnitude of the impact of the textile industry supply chain from an economic and environmental perspective. Thus, analyzing the supply chain structure at the macro level is essential to understand the supply chain better. This study develops an approach that uses Input Output (IO) data taken from the World Input-Output Database (WIOD) to measure environmental impacts at the economic sector level. This study aims to design the textile industry's supply chain structure and identify the method used, which combines IO analysis and DEMATEL (Decision-Making Trial and Evaluation Laboratory). The novelty of this research is that it proposes a method to calculate the expected interaction of CO2 emission within the supply chain. The results show the three-tier supply chain structure of textile industries in Indonesia. The leading suppliers of textile industries are the Manufacture of chemicals and chemical products (r11), wholesale trade (r29), and Crop and animal production (r1). Meanwhile, the sectors most polluting in the supply chain are electricity and gas (r24), the Manufacture of chemicals and chemical products (r11), and crop and animal production (r1).
DEMATEL, environmental, input-output, supply chain, textile industry, WIOD
Concern about a sustainable supply chain has grown significantly during the last two decades. One reason is the increased awareness among stakeholders of the impact of industry actions that cause environmental issues. A sustainable supply chain is usually justified in terms of its contribution to an expansion of economic activity, an improvement in environmental quality, and enhancing human well-being [1]. Nowadays, companies are trying to incorporate sustainability standards into their strategic design planning to reduce ecological and social risks and ensure profitability and growth [2]. Moreover, sustainable supply chain (SC) management becomes an important strategic decision for the manufacturing industries.
Stricter regulations by governments and pressure from various stakeholders concerning environmental issues have contributed to the rising importance of including sustainability in the supply chain design [2]. Consequently, environmental aspects of SC have been discussed in the literature [3]. Although some companies consider environmental improvement, the practice in a SC is not easy. One of the reasons is that SC consists of cross-function parties.
A practical, sustainable supply chain design requires developing analytical models and designing appropriate measurement tools. Therefore, it is important to understand the quantitative impact of environmental issues in supply chain decision-making. This research explores a two-dimensional sustainable supply chain design, which includes economic and environmental aspects. Determining the relationship between parties and quantifying its implication will help decision-makers identify strategies to manage and coordinate the relations within the SC [4].
A sustainable supply chain structure is a long and complex problem. Designing an effective, sustainable supply chain requires the development of analytical models and appropriate measurement tools. Currently, the majority of supply chain structure research uses a micro-level approach. One approach used is the development of mathematical models. A number of studies in the last decade have proposed various optimization models to overcome sustainable supply chain design problems [5-7]. Apart from that, some studies consider a combination of cost factors and emission reductions from production and transportation processes as criteria in decision-making [8, 9]. Zhang et al. [10] designed a network model that minimizes total costs, maximizes customer demand coverage and minimizes negative environmental impacts.
Previous research shows the use of IO analysis in the supply chain design of specific products/processes. IO analysis was initially only used to analyze changes in my economy. However, IO integration has been developed with other approaches, such as LCA, DEMATEL, and ANP. You et al. [7] developed a Multi-Objective (MO) model by integrating an LCA approach to design an optimal biofuel supply chain. On the same research object, Yue et al. [11] developed a model to minimize total costs and GHG (Green House Gases) emissions both directly/indirectly. The model combines MO-MILP (Multi-Objective – Multi Integer Linear Programming), Life Cycle Assessment (LCA), and IO analysis to provide the results of the biofuel supply chain's techno-economic, social and emissions analysis. This research focuses on the biofuel supply chain, and the social indicator is the number of local jobs gained.
Based on previous research, IO analysis has been used in macro-level research. However, research that uses IO analysis at the macro level generally looks at environmental impacts due to the dynamics of global economic change [12-14]. Feng et al. [15] used IO analysis to evaluate the remanufacturing industrial sector, focusing on the impact on other industrial sectors, emission reduction, and the national economy. Research on supply chain design at the macro level is still rare, even though supply chain design requires a comprehensive, holistic analysis of the supply chain.
Several previous research studies have used the integration of IO analysis with the DEMATEL method for decision-making regarding supplier selection [16], sharing economy [17], and supply chain design, which considers environmental impacts in the steel industry [4]. However, the relationship between sectors has not yet been deeply discussed. Therefore, this research adopts an IO analysis approach and integrates it with the DEMATEL to understand the close relationship between sectors. DEMATEL was selected over other MCDM techniques due to its ability to analyze the relationship between sectors based on the relation's intensity, not only similarity as other techniques provide.
The textile industry in Indonesia is a case study in this research. The textile industry is one of the manufacturing industries experiencing rapid growth. The Indonesian Ministry of Industry has made the textile industry one of the development priorities in the Making Indonesia 4.0 Roadmap program. The development of the textile industry through Industry 4.0 aims to increase the domestic textile industry's competitiveness by utilizing technology capable of producing clothing and textiles for more specific needs [18]. Unfortunately, the economic contribution of Indonesia's fashion or textile industry is not directly proportional to its impact on the environment. Among the G20 countries, the textile industry of Indonesia ranks 2nd as the cause of water pollution [19]. Until now, the process of creating an environmentally friendly textile industry has faced many challenges.
The growth of the textile industry indicates the magnitude of the impact of the textile industry supply chain from an economic and environmental perspective. The textile industry supply chain begins with fiber production using raw materials from various types of plants, followed by the yarn and fabric production process. The final stage is producing consumer products, such as clothing and garment products. Apart from that, many other industries indirectly form the textile industry supply chain, which indirectly becomes part of the environmental impact of textile industry activities. This is why analyzing the supply chain structure at the macro level is important. Thus, the research question is how the supply chain structure would explain the economic and environmental impact in the textile industry.
This study develops an approach that uses Input Output (IO) data taken from the World Input-Output Database (WIOD) to measure environmental impacts at the economic sector level. The purpose of this study is to design the supply chain structure of the textile industry and identify the relationships and linkages between sectors in the supply chain to analyze the industry with the most significant environmental impact. The method combines DEMATEL (Decision-Making Trial and Evaluation Laboratory) and the IO model. This macro-level analysis approach uses Indonesia's macroeconomic data as a case study based on the textile industry supply chain in three tiers. The integration model is expected to produce a quantitative analysis of economic and environmental impacts on designing the supply chain structure of the textile industry.
The research method consists of two parts. The first part is to design the SC structure for the textile industry. The second part is to find the most effective CO2 emitted industry among the supplier industries of textile SC in Indonesia as a case study.
2.1 Designing the textile industry SC structure
The SC structure is designed by determining the diagram of cause-effect relationships among various sectors. This research employs I/O and DEMATEL methods. DEMATEL is suitable for researching and solving complex and intertwined problem groups because it can verify interdependence between factors. Besides, it provides a chart that illustrates the interrelationship between factors useful for improvement [20].
The steps of DEMATEL methods are presented as follows:
Step 1. Formation of Pair-Wise Comparison Matrix (M). The matrix M shows the relationship between two industrial sectors. This research uses the economic IO table as matrix M.
$M=\left[\begin{array}{ccc}a_{11} & \cdots & a_{1 n} \\ \vdots & \ddots & \vdots \\ a_{m 1} & \cdots & a_{m n}\end{array}\right]$
This research uses the 2014 World IO table from the WIOD database [21], where ann is the economic coefficient value between sector m to sector n.
Step 2. Create the normal matrix (N). The formula of matrix N:
$N=\delta . M$ (1)
where $\delta=\left(\frac{1}{\max \sum_{j=1}^n a_{i j}}\right)$ (2)
It is a step to normalize the matrix M by multiplication of the matrix M with δ. The result shows a relationship between two by two industrial sectors.
Step 3: Calculating the total relation matrix (T).
$T=N \cdot(I-N)^{-1}$ (3)
Step 4: Calculate the superiority vector (R+J) and the relation vector (R-J).
R represents the sum of rows, while J is the sum of columns of the matrix T.
$R=\left(R_i\right)_{n \times 1}=\left[\sum_{j=1}^n T_{i j}\right]_{n \times 1}$ (4)
$J=\left(C_i\right)_{1 \times n}=\left[\sum_{i=1}^n T_{i j}\right]_{1 \times n}$ (5)
The superiority vector indicates the importance of factors. The more value of the factor, the more interaction that factor has with other factors, and the more important the factor is. Meanwhile, the relation vector indicates the influence of each factor on other factors [4, 22]. The average of the values in matrix T is the threshold value for factors. Only factors with values bigger than the threshold were taken into account. Then, factors with values smaller than the threshold are considered zero.
Step 5: plotting the causal influence diagram.
The position of each factor is specified with the coordinates of Ri+Ci and Ri-Ci. In plotting the diagram, Ri+Ci is on the horizontal axis, while Ri-Ci is on the vertical axis.
Step 6: drawing the relation map.
2.2 Analyse CO2 emitted industry
The next step is to analyze the CO2 emitted industry among the supplier industries of textile industries in Indonesia. The WIOD data also provide CO2 emissions of each sector [21]. All data is retrieved from www.rug.nl/ggdc/valuechain/wiod/. The first step is developing the environmental IO matrix (M*) by multiplying the diagonal environmental matrix with the matrix T.
$M^*=\operatorname{diag}[\mathrm{CO}_2] \times T$ (6)
The next processes following the IO-DEMATEL method displayed in section 2.1.
This research uses the world I/O table as the primary matrix M. The data released in 2016 leads to a 56×56 matrix demonstrating direct and indirect relationships between industries. Table 1 presents the names of sectors in WIOD, while Table 2 illustrates the matrix M (in millions of US$).
The normal matrix N aims to calculate the ratio of data using Eq. (1), with the value of $\delta$ (Eq. (2)) as follows:
$\delta=\left(\frac{1}{392,813}\right)=2.546 \times 10^{-6}$ (7)
The next step is calculating the total relation matrix (T) using Eq. (3) and determining the vectors R and J. The vector R is the summation of rows (Eq. (4)), while the vector J is the sum of columns (Eq. (5)). The matrix T with vectors R and J is illustrated in Table 3. Matrix T presents the degree of influence of each industry. The analysis's degree of influence shows industries' superiority in the supply chain. The superiority vector determines sectors that have a dominant influence on other industries.
Table 1. Sectors in WIOD
|
Code |
Sectors |
Code |
Sectors |
|
r1 |
Crop and animal production, hunting, and related service activities |
r29 |
Wholesale trade, except for motor vehicles and motorcycles |
|
r2 |
Forestry and logging |
r30 |
Retail trade, except for motor vehicles and motorcycles |
|
r3 |
Fishing and aquaculture |
r31 |
Land transport and transport via pipelines |
|
r4 |
Mining and quarrying |
r32 |
Water transport |
|
r5 |
Manufacture of food products, beverages, and tobacco products |
r33 |
Air transport |
|
r6 |
Manufacture of textiles, wearing apparel and leather products |
r34 |
Warehousing and support activities for transportation |
|
r7 |
Manufacture of wood and products of wood and cork, except furniture; Manufacture of articles of straw and plaiting materials |
r35 |
Postal and courier activities |
|
r8 |
Manufacture of paper and paper products |
r36 |
Accommodation and food service activities |
|
r9 |
Printing and reproduction of recorded media |
r37 |
Publishing activities |
|
r10 |
Manufacture of coke and refined petroleum products |
r38 |
Motion picture, video, and television program production, sound recording, and music publishing activities; programming and broadcasting activities |
|
r11 |
Manufacture of chemicals and chemical products |
r39 |
Telecommunications |
|
r12 |
Manufacture of basic pharmaceutical products and pharmaceutical preparations |
r40 |
Computer programming, consultancy, and related activities; information service activities |
|
r13 |
Manufacture of rubber and plastic products |
r41 |
Financial service activities, except insurance and pension funding |
|
r14 |
Manufacture of other non-metallic mineral products |
r42 |
Insurance, reinsurance, and pension funding, except compulsory social security |
|
r15 |
Manufacture of basic metals |
r43 |
Activities auxiliary to financial services and insurance activities |
|
r16 |
Manufacture of fabricated metal products, except machinery and equipment |
r44 |
Real estate activities |
|
r17 |
Manufacture of computer, electronic, and optical products |
r45 |
Legal and accounting activities; activities of head offices; management consultancy activities |
|
r18 |
Manufacture of electrical equipment |
r46 |
Architectural and engineering activities; technical testing and analysis |
|
r19 |
Manufacture of machinery and equipment n.e.c. |
r47 |
Scientific research and development |
|
r20 |
Manufacture of motor vehicles, trailers and semi-trailers |
r48 |
Advertising and market research |
|
r21 |
Manufacture of other transport equipment |
r49 |
Other professional, scientific, and technical activities; veterinary activities |
|
r22 |
Manufacture of furniture; other manufacturing |
r50 |
Administrative and support service activities |
|
r23 |
Repair and installation of machinery and equipment |
r51 |
Public administration and defense; compulsory social security |
|
r24 |
Electricity, gas, steam, and air conditioning supply |
r52 |
Education |
|
r25 |
Water collection, treatment, and supply |
r53 |
Human health and social work activities |
|
r26 |
Sewerage; waste collection, treatment, and disposal activities; materials recovery; remediation activities and other waste management services |
r54 |
Other service activities |
|
r27 |
Construction |
r55 |
Activities of households as employers; undifferentiated goods- and services-producing activities of households for own use |
|
r28 |
Wholesale and retail trade and repair of motor vehicles and motorcycles |
r56 |
Activities of extraterritorial organizations and bodies |
Table 2. Matrix M
|
|
r1 |
r2 |
… |
r6 |
r7 |
… |
r15 |
r16 |
… |
r44 |
r45 |
… |
r56 |
|
r1 |
4,529 |
61 |
… |
1,195 |
130 |
… |
12 |
5 |
… |
0 |
0 |
… |
0 |
|
r2 |
3 |
0 |
… |
53 |
2,423 |
… |
19 |
1 |
… |
0 |
0 |
… |
0 |
|
… |
… |
… |
… |
… |
… |
… |
… |
… |
… |
… |
… |
… |
… |
|
r6 |
22 |
2 |
… |
1,877 |
7 |
… |
2 |
18 |
… |
3 |
7 |
… |
0 |
|
r7 |
15 |
0 |
… |
1 |
1,328 |
… |
194 |
12 |
… |
2 |
3 |
… |
0 |
|
… |
… |
… |
… |
… |
… |
… |
… |
… |
… |
… |
… |
… |
… |
|
r15 |
0 |
0 |
… |
42 |
16 |
… |
744 |
1,300 |
… |
21 |
0 |
… |
0 |
|
r16 |
85 |
3 |
… |
49 |
59 |
… |
139 |
255 |
… |
19 |
11 |
… |
0 |
|
… |
… |
… |
… |
… |
… |
… |
… |
… |
… |
… |
… |
… |
… |
|
r44 |
0 |
0 |
… |
10 |
1 |
… |
16 |
23 |
… |
19 |
61 |
… |
0 |
|
r45 |
0 |
0 |
… |
6 |
2 |
… |
73 |
7 |
… |
145 |
252 |
… |
0 |
|
… |
… |
… |
… |
… |
… |
… |
… |
… |
… |
… |
… |
… |
… |
|
r56 |
0 |
0 |
… |
0 |
0 |
… |
0 |
0 |
… |
0 |
0 |
… |
0 |
Table 3. Total relation matrix (S)
|
|
r1 |
r2 |
… |
r6 |
r7 |
… |
r15 |
r16 |
… |
r44 |
r45 |
… |
r56 |
R |
|
r1 |
0.0130 |
0.0002 |
… |
0.0033 |
0.0004 |
… |
5.15674E-05 |
2.52407E-05 |
… |
1.12352E-05 |
1.63E-05 |
… |
0 |
0.1957 |
|
r2 |
7.31E-05 |
7.87E-06 |
… |
0.0001 |
0.0062 |
… |
5.74224E-05 |
5.34373E-06 |
… |
6.04681E-05 |
1.45E-05 |
… |
0 |
0.0181 |
|
… |
… |
… |
… |
… |
… |
… |
… |
… |
… |
… |
… |
… |
… |
… |
|
r6 |
6.12E-05 |
4.27666E-06 |
… |
0.0048 |
1.9316E-05 |
… |
6.46181E-06 |
4.67173E-05 |
… |
9.11356E-06 |
1.83E-05 |
… |
0 |
0.0063 |
|
r7 |
0.000172 |
1.61508E-05 |
… |
7.36591E-06 |
0.0034 |
… |
0.0005 |
3.64656E-05 |
… |
0.0001 |
3.51E-05 |
… |
0 |
0.0270 |
|
… |
… |
… |
… |
… |
… |
… |
… |
… |
… |
… |
… |
… |
… |
… |
|
r15 |
0.0002 |
1.91359E-05 |
… |
0.0001 |
4.27526E-05 |
… |
0.0019 |
0.0033 |
… |
0.0002 |
3.47E-05 |
… |
0 |
0.0326 |
|
r16 |
0.0005 |
3.59519E-05 |
… |
0.0001 |
0.0002 |
… |
0.0004 |
0.0007 |
… |
0.0003 |
8.18E-05 |
… |
0 |
0.0444 |
|
… |
… |
… |
… |
… |
… |
… |
… |
… |
… |
… |
… |
… |
… |
… |
|
r44 |
2.56E-05 |
2.48168E-06 |
… |
4.95796E-05 |
1.74426 E-05 |
… |
5.29667E-05 |
7.23822E-05 |
… |
5.53978E-05 |
0.000161 |
… |
0 |
0.0104 |
|
r45 |
5.41E-05 |
5.97287E-06 |
… |
2.90708E-05 |
1.24664 E-05 |
… |
0.0002 |
4.78715E-05 |
… |
0.0004 |
0.000657 |
… |
0 |
0.0205 |
|
… |
… |
… |
… |
… |
… |
… |
… |
… |
… |
… |
… |
… |
… |
… |
|
r56 |
0 |
0 |
… |
0 |
0 |
… |
0 |
0 |
… |
0 |
0 |
… |
0 |
0 |
|
J |
0.0515 |
0.0027 |
… |
0.0316 |
0.0203 |
… |
0.0304 |
0.0231 |
… |
0.0148 |
0.0121 |
… |
0 |
|
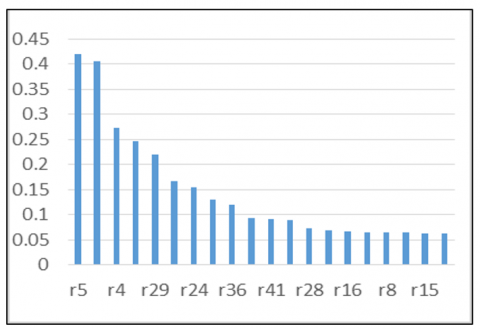
Figure 1. The superiority vector (R+J) diagram
Figure 1 illustrates the R+J diagram of the top 20 industries with the highest degree, which shows r5 and r27, namely the Manufacture of food products, beverages, and tobacco products and the construction sector. Both sectors play an important role in the relationship between industries. Figure 1 shows the industry strength of influence based on the highest to lowest according to the R+J value of the economic transactions. The highest industry is r5 (Manufacture of food products, beverages and tobacco products). This indicates that the food industry is the most significant. The second highest influence is the construction industry (r27). The five highest influences are r4, r1, r29, r10, and r24.
Meanwhile, Figure 2 illustrates the relation (R-C) diagram of 20 industries. In other literature, the relation vector is also known as the net effect. It shows that sector r1 (Crop and animal production, hunting, and related service activities) has the highest positive degree. It is followed by r4 (Mining and quarrying) in second place. This indicates they are the two industries with the most influence in Indonesia. The graph's positive side (right side) is called the causal group, which requires a large amount of input from other sectors [17]. It consists of sectors that have a significant influence on the economic relationship. The three highest sectors are r1, r4 and r29.
On the other hand, the diagrams' negative side shows that sectors with input-oriented strength are more significant than output-oriented strength. In other words, sectors with a negative R-J indicate they are network suppliers. The three main suppliers are r27 (Construction), r5 (Manufacture of food products, beverages, and tobacco products), and r36 (Accommodation and food service activities).
Figure 2. The relation vector (R-J) diagram
The MICMAC diagram (Figure 3) shows a Cartesian diagram that is divided into four quadrants, namely autonomous (I), dependent (II), linkage (III), and independent (IV).
Figure 3. MICMAC diagram
Sectors r27 and r5 are in the quadrant IV. This indicates that sectors r27 and r5 significantly influence other industries but are unaffected by them. This implies the effectiveness of sectors such as construction and food products, beverages, and tobacco in increasing the overall economic system performance [23, 24]. The MICMAC diagram also shows that none of the sectors are in quadrant I, which means none had low driving and independence power. This also implies all sectors have their roles in Indonesia's economic growth. Most sectors have weak driving power but strong dependence power, thus located in quadrant II (dependent). This indicates the dependency of sectors to each other. The growth of one sector will have a positive and/or negative impact on different sectors. Finally, three sectors (r4, r1, r29) are in quadrant III, which indicates a mutual relationship among these sectors. These three sectors are both driving and dependent and are affected by their actions, thus making them unstable and difficult to address.
There are five industrial sectors in quadrants 3 and 4, while the other sectors are spread across quadrants 1 and 2. The industrial sectors in quadrants 3 and 4 indicate that these sectors act as industries influenced by demand [8]. The five sectors are r27, r5, r4, r1, r29. Meanwhile, other sectors can be classified as those influenced by production. This also implies a supply chain strategy for the sectors. Where sectors in Quadrant 1 are suitable with a pull system strategy. Meanwhile, the push strategy suits quadrant 1 and 2 sectors more.
To develop the supply chain network, we need to determine industries in tier 2 and tier 3 of the textile supply chain. Table 2 shows the three highest industries in column c6 (Textile industries) from matrix T. The industries ranked the first three are r29, r11, and r1. Table 4 shows the industries in tier 2.
Table 4. Three main tier 2 suppliers of textile industries
|
Code |
Industry |
Value |
|
r29 |
Wholesale trade, except for motor vehicles and motorcycles |
0.004608 |
|
r11 |
Manufacture of chemicals and chemical products |
0.003389 |
|
r1 |
Crop and animal production, hunting, and related service activities |
0.003272 |
The same method was applied to determine Tier 3 industries. Figure 4 shows the economic supply chain network of Textile Industries in Indonesia. This supply chain network helps identify market segments more intuitively, which should be prioritized in resource efficiency efforts. Tier 2 and Tier 3 represent the intermediate demands and describe the resources used by other sectors to produce other products and services that are ultimately used in the textile industry.
The first objective of this research is to design the supply chain structure of textile industries and understand the criticality of resources. The result shows that chemical manufacturing, wholesale trade, and crop and animal sectors are the three main sectors in Tier 1. Moreover, the results also imply the importance of considered sectors in the second and third tiers. Interestingly, most sectors categorized as prominent or influential (based on the MICMAC diagram) are considered second and third tiers in the supply chain. This highlights the importance of considering the upstream supply chain to improve overall performance.
The next step is to design the supply chain network by considering the environmental aspects. The purpose is to examine resources with significant contributions to sustainable footprint in the textile supply chain. This paper used CO2 intensity as the indicator of impact on the environment. First, the intensity matrix of CO2 (M*) due to economic transaction using Eq. (6). The diagonal matrix of CO2 production is taken from the WIOD database. As mentioned previously, only 18 sectors would be considered in this analysis. The 18 highest sectors are selected based on the most increased economic interaction with the textile industries. Thus, M* is an 18×18 matrix.
Figure 4. Indonesia's textile industry supply chain network based on economic transactions 2014
By following the DEMATEL methods, the total relation matrix for CO2 (T*) was calculated. The T* was used to design the sustainable supply chain network for the textile industry. Table 5 shows the three industries with the highest contributions to producing CO2 in the textile sectors, based on the relative values of CO2 emission of each sector.
The electricity and gas industry is the most polluted sector in the textile supply chain. The chemical manufacturing and crop and animal production sectors follow this. This differs from the result of the most essential sectors based on economic transactions (Table 4), where wholesale trade is first—followed by chemical manufacturing and crop and animal product sectors. Interestingly, electricity and gas (r24) is in the 5th position as the sector that contributes economically to development but ranks first as a polluted sector in the textile industries. Moreover, this implies the contribution of tier 2 and tier 3 sectors toward environmental impact.
Table 5. The first three most polluting industries in Indonesia's textile supply chain in 2014
|
Code |
Industry |
Value |
|
r24 |
Electricity, gas, steam, and air conditioning supply |
5.56×10⁻⁴ |
|
r11 |
Manufacture of chemicals and chemical products |
1.98×10⁻⁴ |
|
r1 |
Crop and animal production, hunting, and related service activities |
1.27×10⁻⁴ |
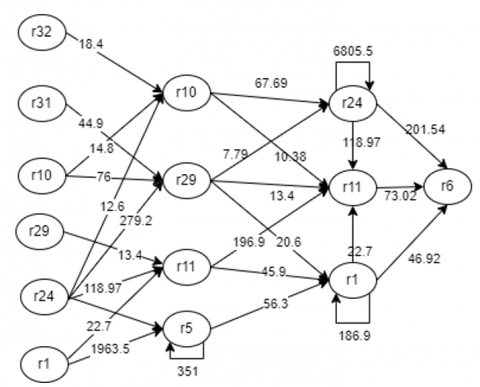
Next, the supply chain network's second tiers and the third tier sectors based on CO2 emission are found. Figure 5 presents the relative intensity of CO2 emission relation within the SC of textiles industries in Indonesia.
Figure 5. The CO2 emission interaction among sectors
Incorporating environmental consideration into the supply chain is well recognized, particularly in the sector where enterprises rely on natural resources as role material [25]. By analyzing the contribution of resources/suppliers in the supply chain, enterprises can focus on sectors that need sustainability improvement. Hence, a new sustainability supply chain for the textile industry should be developed.
The results of this research can provide supporting information for the managers to capture the overall relationship between sectors of the textile industry. In the supply chain network, the textile industry is the focal industry responsible for producing the final product. Thus, it is the supply chain leader in the network. Using IO data, relative resource inputs and CO2 emissions at each tier within the supply chain can be identified. Hence, it is used to build the supply chain network, as presented in Figure 4 and Figure 5.
In this paper, the textile industry supply chain network is presented. As such, this portrays a relationship between the textile industry and its suppliers. The textile industry has the leading role in the supply chain. As such, its policy, managerial, and operational decisions will impact overall economic and environmental performance. Figure 5 implies that it is essential to address the activities of suppliers in the upstream tiers that are identified as the most polluted resource in the supply chain. In this example, it is vital to perform intervention measures by implementing a low-carbon policy for the electricity, gas, steam, and air conditioning supply industries. This is likely to have the highest overall impact. Thus, this would bring the best economic and environmental value to the supply chain.
The sustainable supply chain network can also assist the industry in gaining further insight from benchmarking, especially against industry standards. Thus, it gains opportunities to fulfil the requirements of the government. The analysis would provide opportunities to improve environmental sustainability performance.
This paper presents the supply chain network based on economic and CO2 emission perspectives. The results of this research can provide supporting information for the managers to capture the overall relationship between sectors of the textile industry. The industry wholesale trade (r29) is the main sector that economically impacts the textile supply chain, followed by the manufacturing of chemical and crop and animal production sectors. Meanwhile, the electricity, gas, steam, and air conditioning supply (r4) is the most polluted carbon emission in the supply chain. This implies that improving the effectiveness of the electricity, gas, steam, and air conditioning sectors will increase the supply chain's environmental performance (r24). Another important result is the role of the construction (r27) and food and beverage sectors (r5) as sectors that have a high influence on the overall economic system performance.
Moreover, using the input-output analysis, the proposed methodology provides an approach to determining the expected interaction of CO2 emission within sectors. Therefore, it enables decision-makers to consider economic and environmental aspects in managing and coordinating the relations within industries in the textile supply chain in the competitive market.
For future studies, this approach can be applied not only to emissions but also to various extended IO data, such as social indicators and roles of recycling. Further points can be included for future studies, such as expanding the scope to cover multiregional analysis. In addition, managers can identify industries with the largest share of CO2 emissions among the sectors in the textile supply chain.
The methodology should be applied in various industries and countries. Considering this method is highly computing, building it into an easier execute software or application is recommended. This will help managers get the results quickly for decision-making purposes.
[1] Papong, S., Itsubo, N., Ono, Y., Malakul, P. (2016). Development of social intensity database using asian international input–output table for social life cycle assessment. Sustainability, 8(11): 1135. https://doi.org/10.3390/su8111135
[2] Zimmer, K., Fröhling, M., Breun, P., Schultmann, F. (2017). Assessing social risks of global supply chains: A quantitative analytical approach and its application to supplier selection in the German automotive industry. Journal of Cleaner Production, 149: 96-109. https://doi.org/10.1016/j.jclepro.2017.02.041
[3] Ahi, P., Searcy, C. (2013). A comparative literature analysis of definitions for green and sustainable supply chain management. Journal of Cleaner Production, 52: 329-341. https://doi.org/10.1016/j.jclepro.2013.02.018
[4] Azimifard, A., Moosavirad, S.H., Ariafar, S. (2018). Designing steel supply chain and assessing the embedded CO2 emission based on the input-output table by using DEMATEL method. Management Decision, 56(4): 757-776. https://doi.org/10.1108/MD-05-2017-0478
[5] Brandenburg, M., Rebs, T. (2015). Sustainable supply chain management: A modeling perspective. Annals of Operations Research, 229: 213-252. https://doi.org/10.1007/s10479-015-1853-1
[6] Chaabane, A., Ramudhin, A., Paquet, M. (2012). Design of sustainable supply chains under the emission trading scheme. International Journal of Production Economics, 135(1): 37-49. https://doi.org/10.1016/j.ijpe.2010.10.025
[7] You, F., Tao, L., Graziano, D.J., Snyder, S.W. (2012). Optimal design of sustainable cellulosic biofuel supply chains: multiobjective optimization coupled with life cycle assessment and input–output analysis. AIChE Journal, 58(4): 1157-1180. https://doi.org/10.1002/aic.12637
[8] Chen, Z., Andresen, S. (2014). A multiobjective optimization model of production-sourcing for sustainable supply chain with consideration of social, environmental, and economic factors. Mathematical Problems in Engineering, 2014: 616107. https://doi.org/10.1155/2014/616107
[9] Diabat, A., Al-Salem, M. (2015). An integrated supply chain problem with environmental considerations. International Journal of Production Economics, 164: 330-338. https://doi.org/10.1016/j.ijpe.2014.12.004
[10] Zhang, S., Lee, C.K.M., Wu, K., Choy, K.L. (2016). Multi-objective optimization for sustainable supply chain network design considering multiple distribution channels. Expert Systems with Applications, 65: 87-99. https://doi.org/10.1016/j.eswa.2016.08.037
[11] Yue, D., Pandya, S., You, F. (2016). Integrating hybrid life cycle assessment with multiobjective optimization: A modeling framework. Environmental Science & Technology, 50(3): 1501-1509. https://doi.org/10.1021/acs.est.5b04279
[12] Cortés-Borda, D., Ruiz-Hernández, A., Guillén-Gosálbez, G., Llop, M., Guimerà, R., Sales-Pardo, M. (2015). Identifying strategies for mitigating the global warming impact of the EU-25 economy using a multi-objective input–output approach. Energy Policy, 77: 21-30. https://doi.org/10.1016/j.enpol.2014.11.020
[13] Pascual-González, J., Guillén-Gosálbez, G., Mateo-Sanz, J.M., Jiménez-Esteller, L. (2015). Statistical analysis of global environmental impact patterns using a world multi-regional input–output database. Journal of Cleaner Production, 90: 360-369. https://doi.org/10.1016/j.jclepro.2014.11.065
[14] Shashyna, M., Lepeyko, T., Shevchuk, N., Gaidutskyi, A., Tomanek, M. (2023). Features of providing sustainable regional development in the conditions of globalization challenges. International Journal of Sustainable Development & Planning, 18(12): 3713–3723. https://doi.org/10.18280/ijsdp.181203
[15] Feng, Y., Tian, Y., Zhu, Q. (2016). A combined input–output/decision making trial and evaluation laboratory method for evaluating effect of the remanufacturing sector development. Journal of Cleaner Production, 114: 103-113. https://doi.org/10.1016/j.jclepro.2014.10.048
[16] Büyüközkan, G., Güleryüz, S. (2016). An integrated DEMATEL-ANP approach for renewable energy resources selection in Turkey. International Journal of Production Economics, 182: 435-448. https://doi.org/10.1016/j.ijpe.2016.09.015
[17] Wang, D., Yan, L., Ruan, F. (2022). A combined IO-DEMATEL analysis for evaluating sustainable effects of the sharing related industries development. Sustainability, 14(9): 5592. https://doi.org/10.3390/su14095592
[18] Kemenperin, R.I. (2024). Kemenperin: Menperin: Satu Abad Industri Tekstil Indonesia, Dari Zaman Kolonial Hingga Berjaya di Era Digital. Accessed: Apr. 10, 2024. https://kemenperin.go.id/artikel/23425/Menperin:-Satu-Abad-Industri-Tekstil-Indonesia,-Dari-Zaman-Kolonial-Hingga-Berjaya-di-Era-Digital
[19] Sharpe, S., Retamal, M., Martinez-Fernandez, M.C. (2022). Assessing the impact: Environmental impact assessment in the textile and garment sector in Bangladesh, Cambodia, Indonesia and Viet Nam. ILO Working Paper. https://doi.org/10.54394/YCEP9777
[20] Falatoonitoosi, E., Leman, Z., Sorooshian, S., Salimi, M. (2013). Decision-making trial and evaluation laboratory. Research Journal of Applied Sciences, Engineering and Technology, 5(13): 3476-3480. https://doi.org/10.19026/rjaset.5.4475
[21] Timmer, M.P., Dietzenbacher, E., Los, B., Stehrer, R., De Vries, G.J. (2015). An illustrated user guide to the world input–output database: The case of global automotive production. Review of International Economics, 23(3): 575-605. https://doi.org/10.1111/roie.12178
[22] Shakeri, H., Khalilzadeh, M. (2020). Analysis of factors affecting project communications with a hybrid DEMATEL-ISM approach (A case study in Iran). Heliyon, 6(8): e04430. https://doi.org/10.1016/j.heliyon.2020.e04430
[23] Alaloul, W.S., Musarat, M.A., Rabbani, M.B.A., Iqbal, Q., Maqsoom, A., Farooq, W. (2021). Construction sector contribution to economic stability: Malaysian GDP distribution. Sustainability, 13(9): 5012. https://doi.org/10.3390/su13095012
[24] Tampubolon, J. (2023). Food and agricultural sector in Indonesia’s economic growth during COVID-19 pandemic: An ARDL approach. Agricultural and Resource Economics: International Scientific E-Journal, 9(2): 223-244. https://doi.org/10.51599/are.2023.09.02.10
[25] Amado da Silva, M., Borchardt, M., Medeiros Pereira, G., Cardoso, J., Sperandio Milan, G., Laerton Leite, R. (2023). Developing a sustainable business model in the bioeconomy: A case study of an amazon rainforest enterprise. International Journal of Sustainable Development & Planning, 18(9): 2703–2712. https://doi.org/10.18280/ijsdp.180909