Christine Dewi![]() | Rio Arya Andika
| Rio Arya Andika![]() | Endang Haryani
| Endang Haryani![]() | Dalianus Riantama
| Dalianus Riantama![]() | Ahthasham Sajid
| Ahthasham Sajid![]() | Muhammad Mansoor Alam
| Muhammad Mansoor Alam![]() | Mazliham MohD Su'ud*
| Mazliham MohD Su'ud*![]()
© 2025 The authors. This article is published by IIETA and is licensed under the CC BY 4.0 license (http://creativecommons.org/licenses/by/4.0/).
OPEN ACCESS
The increasing availability of financial data has accelerated the use of machine learning for classification tasks in finance. However, financial datasets are often high-dimensional and noisy, which can degrade model performance and increase computational costs. Feature selection serves as a critical pre-processing step to reduce dimensionality and improve efficiency. This study compares three feature selection methods—Random Forest, Boruta, and Recursive Feature Elimination (RFE)—in the context of financial data classification. The analysis is conducted using three publicly available datasets: Adult Income, Marketing Campaign, and Taiwanese Bankruptcy. A variety of machine learning classifiers are applied to evaluate the impact of feature selection on classification accuracy. Experimental results show that Random Forest Classifier (RFC), particularly with hyperparameter tuning, consistently achieves strong performance across datasets. The combination of RFE and RFC yields the highest accuracy on the Taiwanese Bankruptcy dataset. These findings highlight the importance of selecting relevant features to optimize classification models in finance. The study offers practical insights for enhancing predictive accuracy in financial applications such as credit risk assessment, fraud detection, and customer profiling, thereby contributing to the development of more robust and interpretable machine learning models in the financial sector.
feature selection, financial data, Random Forest, Boruta, Recursive Feature Elimination, classification
Financial data classification has become a critical area of study due to the increasing demand for accurate and efficient predictive models in finance [1, 2]. Feature selection is an essential process in financial data categorization due to financial datasets' high-dimensional, noisy, and duplicated nature. Choosing the most pertinent features improves the efficacy and precision of machine learning models in financial applications. This field encompasses predicting categorical outcomes such as market movements, credit risks, or fraudulent activities based on diverse financial indicators [3-5]. These indicators may include stock prices, trading volumes, interest rates, and macroeconomic metrics, each contributing unique insights into the behavior of financial systems [3].
Some examples of applications in the financial sector that make use of feature selection are as follows: (1) It is possible to increase the accuracy of the model and limit the amount of noise caused by extraneous financial indicators by selecting crucial technical indicators, such as moving averages, relative strength index (RSI), and moving average convergence divergence (MACD). (2) Credit Risk Assessment: Selecting the most significant characteristics (such as a person's credit score, income level, and debt-to-income ratio, for example) aids in making better decisions regarding loan acceptance while simultaneously minimizing the amount of computational cost [4]. (3) Fraud Detection in Financial Transactions: The effectiveness of fraud detection can be improved by removing transaction features that are redundant while maintaining those that are highly informative (for example, transaction amount, frequency, and location) [5]. (4) Bankruptcy Prediction: The capacity of the model to classify enterprises that are at risk of filing for bankruptcy is improved by selecting appropriate financial ratios, such as return on assets and debt-to-equity ratio from the available options [6].
Machine learning algorithms have proven to be powerful tools in tackling classification problems in finance. Their ability to learn complex, non-linear patterns in large datasets makes them invaluable for deriving actionable insights and making precise predictions [7-9]. However, financial data often presents unique challenges, such as high dimensionality and noise, which can hinder the performance of machine learning models. High-dimensional datasets frequently contain irrelevant or redundant features that not only complicate the modeling process but also inflate computational costs, reducing the efficiency of the algorithms [10-12]. To address these challenges, feature selection techniques have emerged as an essential pre-processing step in financial data classification. By identifying and retaining the most relevant features, these techniques simplify the dataset, enhance model performance, and reduce computation time [13-16]. Among the popular feature selection methods, Random Forest, Boruta, and Recursive Feature Elimination (RFE) are widely recognized for their effectiveness in various domains, including finance [17-19].
While prior studies have employed these methods, many of them focus on single datasets or do not systematically compare the combined impact of multiple feature selection techniques across different financial contexts.
This study addresses this gap by conducting a comparative evaluation of Random Forest, Boruta, and RFE across three publicly available financial datasets: Adult Income, Marketing Campaign, and Taiwanese Bankruptcy. The novelty of this research lies in its multi-dataset framework, consistent evaluation metrics, and focus on how each feature selection method influences model performance when combined with hyperparameter tuning.
2.1 Random Forest
Random Forest (RF) is a machine learning method that enhances the performance of a single decision tree classifier by combining multiple decision trees through bootstrap aggregating (bagging) and introducing randomness in the selection of data nodes for partitioning during decision tree construction [20]. An RF classifier operates as an ensemble model, merging a collection of independent decision tree classifiers to produce a more robust prediction [18, 21]. A decision tree with M leaves divides the feature space into M regions, denoted as $R_m$, where $1 \leq m \leq M$. For each tree, the prediction function f(x) is defined in Eq. (1).
$f(x)=\sum_{m=1}^M c_m \Pi\left(x, R_m\right)$ (1)
$M$ denotes the total number of regions within the feature space, where $R_m$ represents the region associated with the $m$ partition, and $c_m$ is the corresponding constant for that region. Additionally, the indicator function is denoted by 1 , signifying whether a particular data point belongs to the specified region defined in Eq. (2):
$\Pi\left(x, R_m\right)= \begin{cases}1, & {if~} x \epsilon R_m \\ 0, & { otherwise }\end{cases}$ (2)
The final classification decision in RF is determined by majority voting across all decision trees in the ensemble.
2.2 Feature selection method
The Boruta algorithm is a feature selection method rooted in the Random Forest classification framework. It operates by generating shadow features—randomly permuted duplicates of the original features—and integrating them into the dataset. A Random Forest Classifier (RFC) is subsequently trained on this augmented dataset [22, 23]. Through iterative evaluation, Boruta assesses the importance of each original feature relative to its shadow counterpart. Features demonstrating statistically higher importance scores than their shadow equivalents are retained as relevant, while those with lower significance are systematically discarded. This process ensures the identification of variables that meaningfully contribute to predictive performance [17, 24]. In contrast, RFE, a wrapper-based feature selection approach, employs an iterative strategy to progressively eliminate less influential features [25]. Initially, the model is trained using the complete set of features, after which the importance of each variable is quantified. The least significant feature is removed, and the model is retrained on the reduced subset. This cycle of ranking, elimination, and retraining continues until a predefined number of features remains [26]. Performance metrics such as accuracy and precision guide the selection process in classification tasks. This approach enables the identification of critical features while maintaining model efficacy.
2.3 Experiment evaluation
The study employed standard performance metrics to evaluate the efficacy of the model on financial datasets, focusing specifically on accuracy as the primary metric. Accuracy is defined in Eq. (3):
$Accuracy~score =\frac{T P+T N}{T P+T N+F P+F N}$ (3)
Here, True Positive (TP) represents the number of reviews correctly classified into the appropriate sentiment category, True Negative (TN) refers to the number of reviews accurately identified as not belonging to a given sentiment category, False Positive (FP) denotes the reviews incorrectly assigned to a sentiment category, and False Negative (FN) refers to the reviews misclassified as not belonging to a category to which they belong [27]. The accuracy score provides a straightforward yet effective measure of the overall correctness of the model's predictions. This allows for a comprehensive assessment of the model's strengths and weaknesses, paving the way for potential improvements in classification performance [28].
3.1 Research design
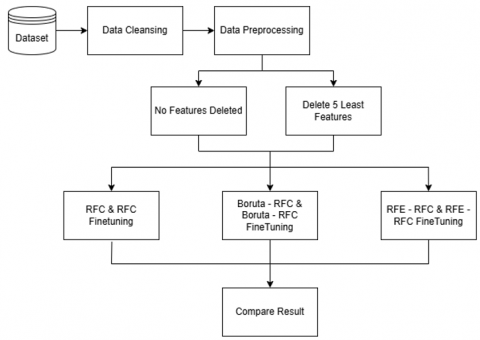
This section outlines the overall design of the research process, as depicted in Figure 1. The study leverages three distinct datasets representing different financial domains: fraud detection, stock market analysis, and credit scoring. These datasets are systematically imported and processed to ensure the generation of meaningful insights. The initial phase of the research process involves comprehensive data preprocessing, a critical step aimed at eliminating noise, managing missing values, and structuring the data appropriately for subsequent analysis. Missing data is handled using imputation techniques or by discarding incomplete entries, ensuring dataset integrity. Additionally, numerical features are standardized to maintain consistency across datasets, while categorical variables are transformed into numerical representations through methods such as one-hot encoding. The processed data is then partitioned into training and testing subsets to facilitate effective model evaluation.
Following the preprocessing phase, two feature selection strategies are employed to assess their impact on classification performance. The first strategy retains all available features, ensuring no information loss, while the second strategy involves eliminating the five least significant features to examine their influence on model accuracy. These approaches provide insights into the role of different features in predictive modelling and enable the evaluation of their contribution to classification performance.
Figure 1. The research workflow
Once feature selection is performed, various techniques are utilized for feature importance analysis and model optimization. A baseline model employing the RFC is initially trained using the full-feature dataset. The Boruta algorithm is then applied to identify the most relevant features, which are subsequently used to retrain the RFC model with additional fine-tuning. In parallel, the RFE method is implemented to iteratively remove less significant features before training the RFC model with further optimization.
The fine-tuning of the RFC model was conducted using a grid search approach with five-fold cross-validation. The optimization process explored various combinations of key hyperparameters, including the number of trees (n_estimators: 50, 100, 150, 200, 250, 500), the minimum number of samples required to split an internal node (min_samples_split: 2, 5, 10), the minimum number of samples required to be at a leaf node (min_samples_leaf: 1, 2, 4), and the bootstrap sampling strategy (bootstrap: True, False). This systematic tuning aimed to maximize model performance by selecting the most effective parameter configuration.
In terms of feature selection, the decision to eliminate only the five least important features was made to simulate a minimal yet meaningful dimensionality reduction. This approach preserves model interpretability while still allowing for an analysis of the impact of feature removal on classification performance. It also ensures consistency across datasets and facilitates a fair comparison between different feature selection methods.
The primary objective of this study is to investigate the influence of feature selection techniques on classification models. By integrating systematic data preprocessing, diverse feature selection strategies, and rigorous model evaluation, this research aspires to develop an efficient and robust framework for enhancing the performance of machine learning models in financial data analysis.
3.2 Datasets
This study utilizes three distinct datasets, each representing a unique financial domain, to evaluate the performance of feature selection techniques: Adult Income, Marketing Campaign, and Taiwanese Bankruptcy Prediction datasets. These datasets are obtained from the UCI Machine Learning Repository (https://archive.ics.uci.edu/dataset/2/adult, https://archive.ics.uci.edu/dataset/222/bank+marketing, and https://archive.ics.uci.edu/dataset/572/taiwanese+bankruptcy+prediction) and provide rich information relevant to various classification problems in finance. The datasets are selected due to their diversity in structure, size, and classification objectives, enabling a comprehensive analysis of feature selection techniques.
The Adult Income dataset is designed to predict whether an individual's income exceeds $\$ 50,000$ annually based on census data. This dataset contains 48,842 entries with 14 attributes, including demographic and employment-related variables such as age, education, marital status, occupation, and work hours per week. The classification target is binary, indicating whether income is greater or less than $\$ 50,000$. The dataset contains both continuous and categorical features, presenting challenges such as class imbalance and missing data. By applying feature selection techniques, the study aims to identify the most influential attributes contributing to income prediction. Insights derived from this analysis can help policymakers and social workers allocate resources more effectively to address income inequality and socioeconomic disparities [29].
The Marketing Campaign dataset is sourced from a Portuguese banking institution and is aimed at predicting the success of direct marketing campaigns. It contains 45,211 records with 17 attributes, including features like age, job, education, balance, and contact information, as well as campaign-specific details such as the number of contacts performed and the outcome of previous campaigns. The target variable is binary, representing whether a customer subscribed to a term deposit. The dataset poses challenges such as high dimensionality, class imbalance, and a mix of categorical and numerical features. Feature selection in this context seeks to identify the most critical attributes influencing customer decisions, helping businesses optimize their marketing strategies and maximize return on investment. By focusing on the most relevant features, companies can streamline their marketing efforts and design more targeted campaigns, potentially saving costs and improving customer engagement [30].
The Taiwanese Bankruptcy Prediction dataset is aimed at predicting the bankruptcy of companies based on financial indicators. It consists of 6,835 records with 96 features, primarily representing financial ratios, such as profitability, liquidity, and leverage. The binary target variable indicates whether a company is bankrupt or not. This dataset is particularly challenging due to its high dimensionality and potential multicollinearity among financial indicators. Feature selection plays a crucial role in identifying the most significant predictors of bankruptcy, reducing the complexity of the model, and improving interpretability. Insights gained from this analysis can aid financial institutions in assessing credit risk more accurately, enabling better-informed lending decisions and effective risk management strategies [31].
Each dataset requires preprocessing steps to ensure data quality and consistency. Missing values are handled using imputation techniques, and categorical variables are encoded into numerical formats using methods such as one-hot encoding or label encoding. Additionally, numerical features are scaled to standardize their ranges, facilitating model training. The application of feature selection techniques, such as Random Forest, Boruta, and Recursive Feature Elimination, aims to reduce the dimensionality of these datasets while preserving the most informative features. This not only improves model performance but also reduces computational complexity, making the models more efficient and interpretable.
4.1 Feature selection result
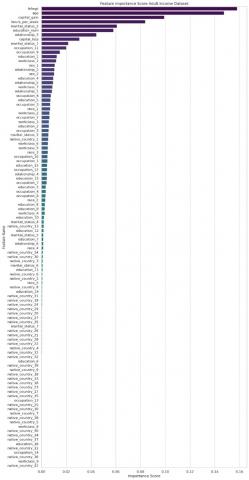
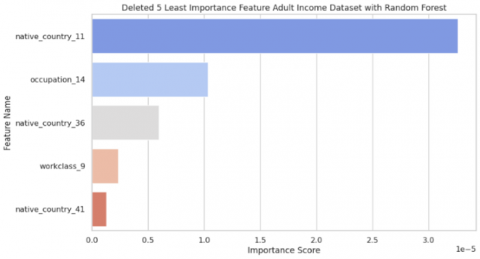
In the feature selection process for the Adult Income dataset, we utilized the Random Forest algorithm to determine the most influential features in predicting income levels. Before feature selection, the dataset underwent several preprocessing steps. First, duplicate records were removed to eliminate redundant data, ensuring that the model was trained on unique observations. Missing values in the occupation and native_country columns, initially marked as '?', were imputed using the most frequent value from the training set. Categorical variables, including workclass, education, marital_status, occupation, relationship, race, sex, and native country, were then transformed using one-hot encoding to convert categorical values into numerical representations. To further enhance model performance, MinMax scaling was applied to normalize all feature values within the range of 0 to 1. Following the preprocessing steps, feature importance analysis was conducted using a RFC, identifying key predictors of income. As illustrated in Figure 2, the most influential features included fnlwgt, which corresponds to an estimate of the number of individuals in the population with the same demographics as this individual, age, capital gain, hours per week, and marital status 2, which significantly contributed to income classification. Conversely, some features exhibited minimal impact on the model’s performance. As shown in Figure 3, variables such as native country 11, occupation 14, native country 36, workclass 9, and native country 41 categories were found to have the lowest importance scores. Based on these findings, less significant features were removed to optimize the model, reducing dimensionality and computational cost while preserving predictive accuracy. This feature selection approach ensures that the model is both efficient and interpretable, focusing on attributes that genuinely influence income classification.
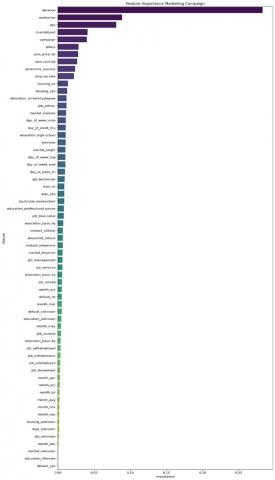
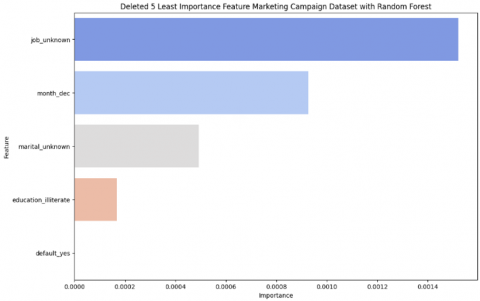
Moving to the next dataset, we still employed the Random Forest algorithm to identify the most influential features in predicting income levels. Before feature selection, several pre-processing steps were applied to the dataset. Initially, duplicate records were removed to eliminate redundancy, ensuring that the model was trained on unique observations. Following pre-processing, feature importance analysis was conducted using a RFC to determine the key predictors of income. As illustrated in Figure 4, the 5 most influential features included duration, Euribor 3 Month rate. Age, nr.employed, and campaign, which played a crucial role in income classification. Conversely, some features contributed minimally to the model’s performance. As shown in Figure 5, features such as unknown job, month-dec, marital-unknown, education-illiterate, and default yes were found to have the lowest importance scores.
Figure 2. Ranked importance feature adult income dataset
Figure 3. Deleted five least importance feature adult income dataset with Random Forest
Figure 4. Ranked importance feature marketing campaign dataset
Figure 5. Deleted five least importance feature marketing campaign dataset with Random Forest
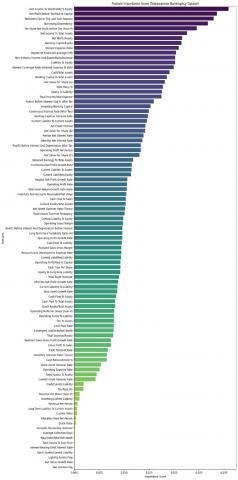
Based on these insights, less significant features were removed to optimize the model, reducing dimensionality and computational cost while preserving predictive accuracy. This feature selection approach ensures that the model remains both efficient and interpretable, focusing on attributes that genuinely impact income classification. Moving to the Taiwanese bankruptcy prediction dataset, contained a variety of numerical and categorical features. After conducting a correlation analysis, the features were ranked based on their relationship with the target variable, "Bankrupt?". This step helped to identify the most important features, which were visualized through bar plots in Figure 6 to show their importance scores.
Figure 6. Ranked importance feature Taiwanese bankruptcy dataset
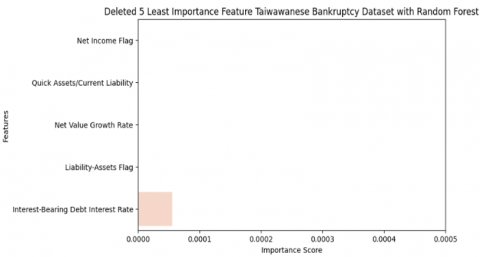
The initial step in feature selection was calculating the correlation between the features and the target variable. This allowed for identifying both positive and negative correlations. Positive correlations indicated features that were strongly associated with bankruptcy, while negative correlations highlighted features that were inversely related. Following this analysis features with weak correlations were flagged for removal. Specifically, five features with the lowest importance scores were identified in Figure 7 and removed from the dataset. These removed features were: Net income flag, Quick Assets, Net Values Growth Rate, Liability-Assets Flag, and Interest-Bearing Debt interest rate.
Figure 7. Deleted Five least importance feature adult income dataset with Random Forest Taiwanese bankruptcy dataset
After eliminating the least important features, the dataset’s dimensionality was reduced, and the remaining features were used for model training. The five most important features retained were: Net Income to Stockholders’ Equity, Net Profit Before Tax/Paid-in Capital, Persistent Eps in the last Four Quarters, Borrowing Dependency, and PerShare Net Profit Before Tax. This selection process played a crucial role in improving the model's performance by removing irrelevant features, thereby reducing noise and focusing on the most predictive attributes. Visualizations of feature importance before and after the selection process were used to clearly demonstrate the impact of feature removal on model accuracy.
4.2 Experiment result
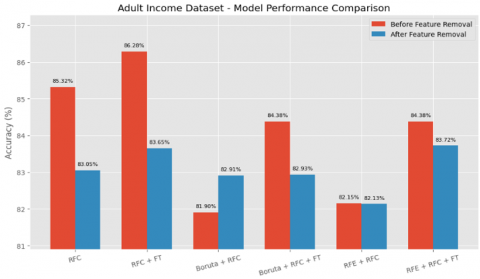
The results of the performance analysis of the adult income dataset classification before the deletion of the five least important features are presented in Table 1. In the first phase, which utilizes all features, the baseline RFC achieved an accuracy of 85.32% ± 0.66. Upon applying hyperparameter tuning using grid search, the performance improved to 86.28% ± 0.77, indicating the effectiveness of fine-tuning in enhancing model performance. The Boruta method, when used prior to training the RFC, yielded an accuracy of 81.90% ± 0.40%, which improved to 84.38% ± 0.34% after fine-tuning. Likewise, the RFE + RFC combination reached 82.15% ± 0.35%, and improved to 84.39% ± 0.39% with fine-tuning. These results demonstrate that although feature selection initially reduces model performance due to dimensionality reduction, fine-tuning can effectively recover and in some cases surpass the original performance.
In the second phase, after eliminating the five least important features, the baseline RFC accuracy dropped slightly to 83.05% ± 0.35%, and even with fine-tuning, it only reached 83.65% ± 0.41%, which is lower than in the original setting, as shown in Table 2. The Boruta method exhibited a similar trend, with post-removal accuracy decreasing to 82.91% ± 0.41% and 82.93% ± 0.40% after fine-tuning. This suggests that Boruta-selected features may overlap with the removed ones, reducing its effectiveness. Conversely, RFE displayed more resilience, maintaining a comparable accuracy of 82.13% ± 0.43%, and improving to 83.72% ± 0.40% after fine-tuning—outperforming Boruta-based methods in this setting.
The visual comparison in Figure 8 highlights these trends clearly. RFC with fine-tuning consistently produced the highest accuracy in both phases. Boruta-based methods showed sensitivity to feature removal, while RFE-based methods exhibited more stable and robust behaviour. These findings suggest that although fine-tuning plays a crucial role in improving classification performance across all approaches, RFE is more robust in scenarios involving feature elimination, making it a suitable choice for real-world applications where feature reduction is desired or required.
Table 1. Performance result of adult income dataset classification with all features
|
Method |
Acc |
|
Random Forest Classifiers (RFC) |
85.32% ± 0.66% |
|
RFC + Fine Tuning |
86.28% ± 0.77% |
|
Boruta + RFC |
81.90% ± 0.40% |
|
Boruta + RFC + Fine Tuning |
84.38% ± 0.34% |
|
RFE + RFC |
82.15% ± 0.35% |
|
RFE + RFC + Fine Tuning |
84.38% ± 0.39% |
Table 2. Performance result of adult income dataset classification with all features
|
Method |
Acc |
|
Random Forest Classifiers (RFC) |
83.05% ± 0.35% |
|
RFC + Fine Tuning |
83.65% ± 0.41% |
|
Boruta + RFC |
82.91% ± 0.41% |
|
Boruta + RFC + Fine Tuning |
82.93% ± 0.40% |
|
RFE + RFC |
82.13% ± 0.43% |
|
RFE + RFC + Fine Tuning |
83.72% ± 0.40% |
Figure 8. Adult income dataset comprehensive comparison
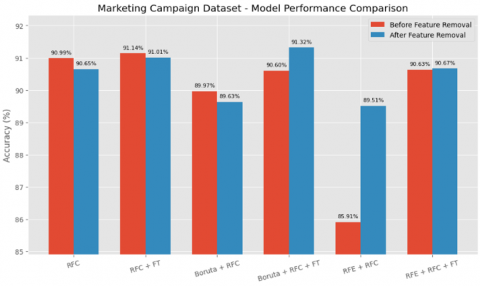
The classification performance of the Marketing Campaign dataset was performed using a 5-fold cross-validation strategy, and the detailed performance results are summarized in Table 3 (before deletion) and Table 4 (after deletion). An overall comparison is visually represented in Figure 9.
Table 3. Performance result of marketing campaign dataset classification with all features
|
Method |
Acc |
|
Random Forest Classifiers (RFC) |
90.99% ± 0.48% |
|
RFC + Fine Tuning |
91.14% ± 0.32% |
|
Boruta + RFC |
89.97% ± 0.22% |
|
Boruta + RFC + Fine Tuning |
90.60% ± 0.33% |
|
RFE + RFC |
85.91% ± 0.25% |
|
RFE + RFC + Fine Tuning |
90.63% ± 0.33% |
Table 4. Performance result of marketing campaign dataset after delete 5 least important features
|
Method |
Acc |
|
Random Forest Classifiers (RFC) |
90.65% ± 0.32% |
|
RFC + Fine Tuning |
91.01% ± 0.33% |
|
Boruta + RFC |
89.63% ± 0.33% |
|
Boruta + RFC + Fine Tuning |
91.32% ± 0.40% |
|
RFE + RFC |
89.51% ± 0.25% |
|
RFE + RFC + Fine Tuning |
90.67% ± 0.30% |
Figure 9. Marketing Campaign Dataset Comprehensive Comparison
Before feature elimination, the baseline RFC achieved a high accuracy of 90.99% ± 0.48, which was slightly improved to 91.14% ± 0.32 after hyperparameter fine-tuning. The Boruta + RFC configuration achieved 89.97% ± 0.22, and further improved to 90.60% ± 0.33 with fine-tuning, suggesting that the model can still benefit from optimization even after feature selection. Interestingly, the RFE + RFC approach produced a notably lower baseline accuracy of 85.91% ± 0.25, but fine-tuning the model significantly enhanced performance to 90.63% ± 0.33, closing the gap with other methods. These results emphasize the role of fine-tuning in boosting model accuracy, particularly when initial performance is suboptimal.
After eliminating the five least important features, the RFC maintained competitive performance with an accuracy of 90.65% ± 0.32, while fine-tuning increased this slightly to 91.01% ± 0.33. Notably, the Boruta + RFC method saw a slight drop to 89.63% ± 0.33, yet fine-tuning produced a substantial gain, pushing the accuracy to 91.32% ± 0.40—surpassing even the tuned RFC model. Meanwhile, RFE + RFC achieved 89.51% ± 0.25, and reached 90.67% ± 0.30 after fine-tuning. These results indicate that Boruta's performance is highly dependent on fine-tuning and may benefit the most when optimized post-feature reduction, whereas RFE demonstrates more consistent performance before and after deletion, albeit starting from a lower baseline.
Overall, the elimination of the five least important features did not significantly harm model performance across the board. In fact, in several configurations—especially those involving fine-tuning—performance either remained stable or improved. Among all methods, the RFC with fine-tuning remained the most robust and reliable, while Boruta + RFC with fine-tuning emerged as a top performer after feature pruning. These findings reinforce the value of model optimization and the potential of hybrid feature selection techniques, particularly when accompanied by hyperparameter tuning.
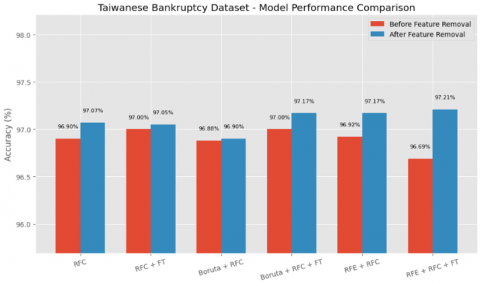
The performance evaluation for the Taiwanese Bankruptcy Prediction dataset was conducted using several configurations of the RFC, both before and after the removal of the five least important features. The results are summarized in Table 5 (before deletion) and Table 6 (after deletion), with a visual comparison provided in Figure 10.
Table 5. Performance result of Taiwanese bankruptcy
|
Method |
Acc |
|
Random Forest Classifiers (RFC) |
96.90% ± 0.43% |
|
RFC + Fine Tuning |
97% ± 0.33% |
|
Boruta + RFC |
96.88% ± 0.42% |
|
Boruta + RFC + Fine Tuning |
97% ± 0.27% |
|
RFE + RFC |
96.92% ± 0.37% |
|
RFE + RFC + Fine Tuning |
96.69% ± 0.45% |
Table 6. Performance result of Taiwanese bankruptcy prediction dataset after delete 5 least important features
|
Method |
Acc |
|
Random Forest Classifiers (RFC) |
97.07% ± 0.44% |
|
RFC + Fine Tuning |
97.05% ± 0.41% |
|
Boruta + RFC |
96.9% ± 0.44% |
|
Boruta + RFC + Fine Tuning |
97.17% ± 0.31% |
|
RFE + RFC |
97.17% ± 0.41% |
|
RFE + RFC + Fine Tuning |
97.21% ± 0.32% |
Figure 10. Taiwanese bankruptcy dataset comprehensive comparison
Before feature elimination, the baseline RFC achieved an accuracy of 96.90% ± 0.43, which improved slightly to 97.00% ± 0.33 after fine-tuning. The Boruta + RFC approach yielded 96.88% ± 0.42, and fine-tuning marginally increased it to 97.00% ± 0.27. The RFE + RFC configuration performed slightly better with 96.92% ± 0.37, although fine-tuning unexpectedly led to a small drop in performance to 96.69% ± 0.45, possibly due to overfitting or loss of useful features in the pruning process.
Following the removal of the five least important features, RFC retained its strong performance, achieving 97.07% ± 0.44, and slightly decreasing to 97.05% ± 0.41 with fine-tuning. Interestingly, the Boruta + RFC model also maintained robustness with 96.90% ± 0.44, and after fine-tuning, surpassed its previous result to reach 97.17% ± 0.31, the highest score achieved across all methods. The RFE + RFC method also benefited from feature pruning, improving to 97.17% ± 0.41, and further increasing to 97.21% ± 0.32 after fine-tuning.
These results confirm that eliminating the least important features does not degrade model performance on the Taiwanese Bankruptcy dataset. In fact, most configurations either maintained or slightly improved their predictive accuracy. Fine-tuning consistently enhanced results across all methods. Notably, both RFE + RFC and Boruta + RFC, when fine-tuned, produced the highest accuracies after feature elimination. This suggests that RFE and Boruta are not only effective at selecting meaningful features but also robust when combined with model optimization.
Overall, the RFC proved to be a highly reliable baseline model, while hybrid approaches with feature selection and fine-tuning offered marginal yet meaningful performance gains. These findings underscore the importance of combining feature selection with hyperparameter tuning to achieve optimal predictive performance, especially for high-stakes datasets like bankruptcy prediction, where small accuracy differences can be significant in real-world applications.
The comparative analysis of feature selection methods across the three datasets reveals noteworthy differences between Boruta and RFE, particularly in scenarios involving feature removal. Although Boruta is a robust, all-relevant feature selection algorithm that relies on Random Forest importance scores and shadow features, it tended to underperform compared to RFE in multiple instances—especially in the Adult Income dataset after the five least important features were eliminated.
One potential explanation lies in Boruta's reliance on randomness and redundancy sensitivity. Since Boruta selects features based on whether their importance scores are consistently higher than those of permuted shadow features, it may inadvertently retain redundant or correlated variables. When those redundant features overlap with the five eliminated ones, Boruta loses predictive value, leading to reduced performance. In contrast, RFE systematically ranks features by recursively removing the least important ones and re-evaluating model performance, which tends to produce a more compact and discriminative subset, especially after aggressive feature pruning.
Furthermore, Boruta’s strategy often retains a larger number of features compared to RFE. While this can be advantageous in exploratory analyses where preserving potentially relevant variables is desirable, it may introduce challenges in applications where model simplicity and computational efficiency are critical—such as in financial domains. Retaining excess features can increase the risk of noise, overfitting, and diminishing marginal returns. In contrast, RFE enforces stricter feature elimination, which can lead to a more favorable bias–variance trade-off under such conditions.
From a financial perspective, the implications are significant. In applications such as credit risk assessment, bankruptcy prediction, or fraud detection, model interpretability, robustness, and efficiency are paramount. Redundant or noisy features can obscure the relationship between input variables and outcomes, reducing stakeholder trust and increasing regulatory scrutiny. The results of this study suggest that RFE may be better suited for high-stakes financial scenarios, particularly when dimensionality reduction is necessary or when resources are constrained.
Moreover, the consistent performance gains observed through hyperparameter tuning across all methods underscore the critical role of model optimization in practical applications. Even in cases where feature selection may be suboptimal, fine-tuning can compensate for reduced accuracy, reinforcing its importance as an integral component of any machine learning pipeline, particularly in financial contexts. The ability to achieve reliable performance from compact feature sets is especially valuable in environments where explainability, regulatory compliance, and computational efficiency are essential.
In summary, while both Boruta and RFE offer distinct strengths, RFE’s adaptability to feature elimination and its stable performance make it a more reliable choice in financial machine learning tasks. Future work should explore hybrid feature selection approaches that combine the global relevance perspective of Boruta with the iterative refinement of RFE, potentially improving robustness and interpretability in dynamic financial domains.
Christine Dewi: Investigation, Data curation, Writing – review & editing, Validation, Writing – original draft, Formal analysis, Conceptualization. Rio Arya Andika: Methodology, Data curation, Writing – original draft, Writing – review & editing, Conceptualization. Endang Haryani: Writing – original draft, Methodology, Data curation, Resources, Software, Investigation. Ahthasham Sajid: Software, Visualization, Methodology, Formal analysis, Writing – original draft, Investigation. Dalianus Riantama: Visualization, Data curation, Writing – review & editing, Software, Writing – original draft, Investigation, Methodology. Muhammad Mansoor Alam: Visualization, Data curation, Writing – review & editing, Software, Writing – original draft, Investigation, Methodology. Mazliham MohD Su’ud: Visualization, Data curation, Writing – review & editing, Software, Writing – original draft, Investigation, Methodology.
This work is supported by the Faculty of Computing and Informatics, Multimedia University, Cyberjaya, Malaysia.
[1] Alaka, H., Oyedele, L., Owolabi, H., Akinade, O., Bilal, M., Ajayi, S. (2018). A big data analytics approach for construction firms failure prediction models. IEEE Transactions on Engineering Management, 66(4): 689-698. https://doi.org/10.1109/TEM.2018.2856376
[2] Chen, T., Guestrin, C. (2016). Xgboost: A scalable tree boosting system. In KDD '16: The 22nd ACM SIGKDD International Conference on Knowledge Discovery and Data Mining, San Francisco California, USA, pp. 785-794. https://doi.org/10.1145/2939672.2939785
[3] Bao, W., Yue, J, Rao, Y.L. (2017) A deep learning framework for financial time series using stacked autoencoders and long-short term memory. PLOS One, 12(7): e0180944. https://doi.org/10.1371/journal.pone.0180944
[4] Yufenyuy, S.S., Adeniji, S., Elom, E., Kizor-Akaraiwe, S., Bello, A.W., Kanu, E., Ogunleye, O., Ogutu, J., Obunadike, C., Onih, V., Obunadike, C. (2024). Machine learning for credit risk analysis across the United States. World Journal of Advanced Research and Reviews, 22(2): 942-955. https://doi.org/10.30574/wjarr.2024.22.2.1455
[5] Dal Pozzolo, A., Boracchi, G., Caelen, O., Alippi, C., Bontempi, G. (2017). Credit card fraud detection: A realistic modeling and a novel learning strategy. IEEE Transactions on Neural Networks and Learning Systems, 29(8): 3784-3797. https://doi.org/10.1109/TNNLS.2017.2736643
[6] Kim, H., Cho, H., Ryu, D. (2022). Corporate bankruptcy prediction using machine learning methodologies with a focus on sequential data. Computational Economics, 59(3): 1231-1249. https://doi.org/10.1007/s10614-021-10126-5
[7] Nazareth, N., Reddy, Y.V.R. (2023). Financial applications of machine learning: A literature review. Expert Systems with Applications, 219: 119640. https://doi.org/10.1016/j.eswa.2023.119640
[8] Sahu, S.K., Mokhade, A., Bokde, N.D. (2023). An overview of machine learning, deep learning, and reinforcement learning-based techniques in quantitative finance: Recent progress and challenges. Applied Sciences, 13(3): 1956. https://doi.org/10.3390/app13031956
[9] Dewi, C., Chen, R.C. (2019). Human activity recognition based on evolution of features selection and random forest. In 2019 IEEE International Conference on Systems, Man and Cybernetics (SMC), Bari, Italy, pp. 2496-2501. https://doi.org/10.1109/SMC.2019.8913868
[10] Singh, V., Chen, S.S., Singhania, M., Nanavati, B., Gupta, A. (2022). How are reinforcement learning and deep learning algorithms used for big data based decision making in financial industries–A review and research agenda. International Journal of Information Management Data Insights, 2(2): 100094. https://doi.org/10.1016/j.jjimei.2022.100094
[11] Rudin, C., Chen, C.F., Chen, Z., Huang, H.Y., Semenova, L., Zhong, C.D. (2021). Interpretable machine learning: Fundamental principles and 10 grand challenges. arXiv preprint, arXiv:2103.11251. https://arxiv.org/abs/2103.11251.
[12] Thakkar, A., Chaudhari, K. (2021). A comprehensive survey on deep neural networks for stock market: The need, challenges, and future directions. Expert Systems with Applications, 177: 114800. https://doi.org/10.1016/j.eswa.2021.114800
[13] Liang, D.R., Tsai, C.F., Wu, H.T. (2015). The effect of feature selection on financial distress prediction. Knowledge-Based Systems, 73: 289-297. https://doi.org/10.1016/j.knosys.2014.10.010
[14] Li, J.D., Cheng, K.W., Wang, S.H., Morstatter, F., Trevino, R.P., Tang, J.L., Liu, H. (2017). Feature selection: A data perspective. ACM Computing Surveys (CSUR), 50(6): 94. https://doi.org/10.1145/3136625
[15] Qian, W.B., Huang, J.T., Xu, F.K., Shu, W.H., Ding, W.P. (2023). A survey on multi-label feature selection from perspectives of label fusion. Information Fusion, 100: 101948. https://doi.org/10.1016/j.inffus.2023.101948
[16] Dewi, C., Chen, R.C. (2019). Random forest and support vector machine on features selection for regression analysis. International Journal of Innovative Computing, Information and Control, 15(6): 2027-2037. https://doi.org/10.24507/ijicic.15.06.2027
[17] Kursa, M.B., Rudnicki, W.R. (2010). Feature selection with the Boruta package. Journal of Statistical Software, 36(11): 1-13. https://doi.org/10.18637/jss.v036.i11
[18] Genuer, R., Poggi, J.M., Tuleau-Malot, C. (2010). Variable selection using random forests. Pattern Recognition Letters, 31(14): 2225-2236. https://doi.org/10.1016/j.patrec.2010.03.014
[19] Granitto, P.M., Furlanello, C., Biasioli, F., Gasperi, F. (2006). Recursive feature elimination with random forest for PTR-MS analysis of agroindustrial products. Chemometrics and Intelligent Laboratory Systems, 83(2): 83-90. https://doi.org/10.1016/j.chemolab.2006.01.007
[20] Louppe, G. (2014). Understanding random forests: From theory to practice. PhD thesis, University of Liège. arXiv preprint arXiv:1407.7502. https://arxiv.org/abs/1407.7502.
[21] Breiman, L. (2001). Random forests. Machine Learning, 45: 5-32. https://doi.org/10.1023/A:1010933404324
[22] Kursa, M.B., Jankowski, A., Rudnicki, W.R. (2010). Boruta – A system for feature selection. Fundamenta Informaticae, 101(4): 271-285. https://doi.org/10.3233/FI-2010-288
[23] Chen, R.C., Dewi, C., Huang, S.W., Caraka, R.E. (2020). Selecting critical features for data classification based on machine learning methods. Journal of Big Data, 7(1): 52. https://doi.org/10.1186/s40537-020-00327-4
[24] Anand, N., Sehgal, R., Anand, S., Kaushik, A. (2021). Feature selection on educational data using Boruta algorithm. International Journal of Computational Intelligence Studies, 10(1): 27-35. https://doi.org/10.1504/IJCISTUDIES.2021.113826
[25] Darst, B.F., Malecki, K.C., Engelman, C.D. (2018). Using recursive feature elimination in random forest to account for correlated variables in high dimensional data. BMC Genetics, 19(Suppl 1): 65. https://doi.org/10.1186/s12863-018-0633-8
[26] Michaud, E.J., Liu, Z.M., Tegmark, M. (2023). Precision machine learning. Entropy, 25(1): 175. https://doi.org/10.3390/e25010175
[27] Osisanwo, F.Y., Akinsola, J.E., Awodele, O., Hinmikaiye, J.O., Olakanmi, O., Akinjobi, J. (2017). Supervised machine learning algorithms: Classification and comparison. International Journal of Computer Trends and Technology (IJCTT), 48(3): 128-138. https://doi.org/10.14445/22312803/IJCTT-V48P126
[28] Tharwat, A. (2021). Classification assessment methods. Applied Computing and Informatics, 17(1): 168-192. https://doi.org/10.1016/j.aci.2018.08.003
[29] Becker, B., Kohavi, R. (1996). Adult [Dataset]. UCI Machine Learning Repository. https://doi.org/10.24432/C5XW20
[30] Moro, S., Rita, P., Cortez, P. (2014). Bank marketing [Dataset]. UCI Machine Learning Repository. https://doi.org/10.24432/C5K306
[31] Taiwanese Bankruptcy Prediction [Dataset]. (2020). UCI Machine Learning Repository. https://doi.org/10.24432/C5004D