Shokhan M. Al-Barzinji![]() | Nuha Qais Abdulmajeed
| Nuha Qais Abdulmajeed![]() | Ali Saadoon Ahmed*
| Ali Saadoon Ahmed*![]() | Mohannad Al-Kubaisi
| Mohannad Al-Kubaisi![]()
© 2025 The authors. This article is published by IIETA and is licensed under the CC BY 4.0 license (http://creativecommons.org/licenses/by/4.0/).
OPEN ACCESS
Skin cancers are critical medical conditions that can only be diagnosed early and well in order to enhance patient outcomes. Within the limitations of the present study, we provide an optimized deep learning model that achieves 99.70% accuracy in classifying the publicly accessible Kaggle Skin Cancer: Malignant vs. Benign dataset, which contains a balanced number of 3,600 dermoscopic images in both the training and test sets. The pre-processing of images involved resizing, denoising, and color normalization to ensure high-quality inputs. To optimize hyperparameters such as the learning rate and batch size, we utilized Salp Swarm Optimization (SSO) in a set of Convolutional Neural Network (CNN) models, including VGG19, DenseNet201, ResNet50, and MobileNetV2. Grad-CAM (Gradient-weighted Class Activation Mapping) was employed to increase image interpretability, visualizing the parts of the image that contribute most to the model's prediction. MobileNetV2 using SSO optimisation performed best among all models, achieving a 94 percent performance, with a malignant lesion precision of 0.93 and recall of 0.96, which was 13 percent more accurate than the standard CNN baselines. These outcomes suggest that incorporating characteristics such as bio-inspired optimization and interface interpretability into lightweight CNNs can significantly enhance the diagnostic accuracy and clinical feasibility of automated skin disease classification systems.
skin cancer detection, deep learning, MobileNetV2, Salp Swarm Optimization (SSO), Grad-CAM, dermoscopic image analysis
The uncontrolled proliferation of aberrant skin cells is the cause of skin cancer, a major global public health concern. Although it is a complex illness with many facets, exposure to ultraviolet (UV) radiation from artificial sources, such as tanning beds or sunshine, is the most well-known contributor to the formation of malignant tumors. Biological pathways of skin carcinogenesis involve not only direct DNA damage but also immunosuppression at the local level, which is critical for tumor development and progression after UV radiation. Recent global estimates suggest that skin cancer represents a substantial portion of all malignancies, with basal cell carcinoma (BCC) and squamous cell carcinoma (SCC) being the most common types [1]. The cost of these cancers represents an important expense for health systems, and therefore, early detection accompanied by adequate diagnosis ameliorates treatment outcomes while reducing cancer-related mortalities. Cancer is a process of unrestrained tissue division, in part due to one or more hereditary transformations affecting normal cellular control [2]. This is not only very fast and with high prevalence worldwide, but it is also seen as a threat to skin cancer. It is characterized by neoplastic skin growth, leading to various types of lesions that can be benign or malignant [3]. The incidence rate of melanoma, the deadliest form of skin cancer (and which is a significant cause of death from skin disease in most developed countries), continues to rise faster than any other type and creates an urgent paradigm for public health strategies designed specifically for prevention as well as early detection. BCC [4], SCC [5], Merkel cell carcinoma [6], dermatofibroma [7], vascular lesion [8], and benign keratosis [9]. This underscores the importance of recognizing not only their unique phenotype but also the risk factors for different types, in order to develop targeted screening and intervention algorithms.
Epidermis, the outer layer of skin, accounts for most types (BCC and SCC) of Skin Cancer cases. These cancer types are most commonly caused by long-term sun exposure and usually appear on skin that is often exposed to sunlight, including the head, neck, face, arms, and hands. There is a wide geographical variation in the incidence of skin cancer, being higher where there are greater levels of sun exposure and among lighter-skinned populations. Although BCC is often restricted to a single organ and seldom invades other organs or lymph nodes, SCC is more aggressive and has the potential to intravasate nearby tissues. This highlights the importance of a timely diagnosis to prevent further damage. As a result, the term "keratinocyte cancers" is sometimes used to describe both BCC and SCC, as they arise from the most common type of skin cell, the keratinocyte [1]. Several non-invasive lesions, such as AK and Intraepithelial Carcinoma (IC), can act as precursors to SCC, showing the ability to progress if not treated [10]. This evolution emphasizes the necessity of routine skin checks and knowledge of early signs in at-risk patients.
Skin cancers are a group of diseases resulting from the uncontrolled proliferation of cells, of which UV radiation is one major cause [2]. Although melanomas account for a small percentage of skin cancer diagnoses, they are responsible for the majority of deaths. Visual examination has been developed since the 1970s to detect skin cancer, such as dermoscopy evaluation and biopsies for determining malignant from benign lesions [11]. Technological advances, such as automated image analysis and AI, have increasingly enhanced diagnostic accuracy while reducing the burden on healthcare providers. An improvement in the diagnosis of skin pathology by dermoscopy may have contributed to a rise in detection rates, making it even more important that medical practitioners are skilled at recognizing and managing cutaneous presentations effectively [12]. In conclusion, implementing a comprehensive strategy focused on skin cancer prevention, early detection, and treatment will be necessary to address this substantial public health issue.
1.1 Related work
This paper [13] examines the use of deep learning methods to develop a classifier for skin cancer, highlighting the importance of early detection. To perform this task, the study employs three different models: RegNet x006, EfficientNet v2 B0, and InceptionResNet v2, combined with a pre-processing technique that improves image quality by excluding noise, such as hairs or black pixels, in dermoscopic images. A total of four tests were carried out in order to evaluate the performance of the model on both raw and pre-processed photographs, and the final accuracy was determined to be 0.929. The results showed that pre-processing, which focuses on the region of the lesion, considerably increased the capacity to classify skin cancer in a manner that was both more accurate and sensitive.
This article [14] makes an effort to make use of deep learning techniques for the identification of melanoma, which is a kind of skin cancer that is extremely fatal. It also highlights the critical significance of making an accurate diagnosis as early as possible from the beginning. Due to the fact that conventional diagnostic procedures are time-consuming and frequently need specialized knowledge in biopsy analysis, the study focuses on how artificial intelligence might assist in making this process more efficient. A collection of 7,146 cutaneous pictures was used to assess various Convolutional Neural Network (CNN) architectures, including DenseNet201, MobileNetV2, ResNet50V2, ResNet152V2, Xception, VGG16, and VGG19. To confirm the method's performance while comparing PDFs, we ran trials on graphics processing units (GPUs) in training plots. GoogleNet was the most accurate of all the tested models, achieving a training set accuracy of 74.91% and a test rate of up to 76.08%. The study demonstrates how deep-learning models may be pivotal in improving melanoma diagnosis and assisting the clinician in making more accurate clinical decisions, further emphasizing DL's evolving role in healthcare.
Deep learning, particularly Convolutional Neural Networks (CNNs), was employed to classify skin cancer as either benign or malignant in this study [15]. The ISIC2018 dataset, comprising 3,533 skin lesion images, is utilized to enhance image quality using ESRGAN in the pre-processing step. CNN was compared with other transfer learning models, such as ResNet50, InceptionV3, and InceptionResnet, which achieved 83.2%, 83.7%, 85.8% and 84% accuracy rates. The application of ESRGAN is another excellent case for enhancing quality and classification. The study recommends future validation on larger datasets and the incorporation of other models, such as DenseNet, VGG, or AlexNet, to enhance performance.
A deep learning algorithm is used in another study [16] to categorize clinical photos of 12 different skin conditions, including melanomas, squamous cell carcinoma, and basal cell carcinoma. The CNN model Microsoft ResNet-152 was optimized and refined using 19,398 photos from the three datasets. Asan, MED-NODE, and atlas. The model was tested using independent Asan, Hallym, and Edinburgh data sets. The diagnostic accuracy of the algorithm was high, with area under the curve (AUC) values of 0.96 on the Asan dataset for basal cell carcinoma and melanoma, respectively. In contrast, the AUC values in Edinburgh were 0.90 and 0.88 for basal cell carcinoma and melanoma, respectively [13]. Using the Hallym dataset, basal cell carcinoma diagnosis sensitivity was 87.1%. Compared to 16 dermatologists, the model was validated using 480 images from Asan and Edinburgh datasets. Additional images would increase image diversity, covering a broader spectrum of ages and ethnicities.
The development of a deep learning model for 12 types of skin diseases, including malignant melanoma and basal cell carcinoma, is described in this paper [17]. This model uses the ResNet-152 architecture to distinguish among these different kinds of illness. The 3797 images were augmented 29 times by random position, scale transformation, and lightness adjustment. This enabled the project's robustness to be substantially improved. The network was then tested on 956 images, and a high accuracy of diagnosis was obtained: area under curve (AUC) 0.96 for melanoma, area under curve (AUC) 0.91 for basal cell carcinoma. With 14.1 million people around the world this year and more than 8.2 million people dying annually from skin cancer, deep learning has the potential not only to improve the accuracy of clinical judgment in detecting a lesion but also to make sure we do so as early as possible.
This paper [18] aims to enhance the clinical classification of skin conditions by introducing a unique deep-learning framework. This data set includes 13,603 dermoscopic images annotated by dermatologists and covers 14 disorders, including melanocytic nevus, psoriasis, and basal cell carcinoma. EfficientNet-b4 is the model's backbone, making it useful for the healthcare industry. The model was fine-tuned using the real-world clinical dataset, and auxiliary classifiers were incorporated to improve its performance. Visual saliency maps and t-SNE were used to study the model-learned image features. The framework achieves an accuracy (0.948), sensitivity (0.934), and specificity (0.950), all higher than that of widely used CNN models in an area under the curve (AUC) of 0.985. In a multiclass task against a panel of 280 board-certified dermatologists, this model performed comparably to them. This means that AI could potentially diagnose a wide range of skin diseases with great accuracy, engaging in both AI as research and real-world clinical care.
Using the Dermatology HAM10000 dataset, this survey [19] further explores the application of CNNs to classify seven types of malignant skin tumors, including melanoma, basal cell carcinoma, and dermatofibroma. Although CNN networks are highly successful in medical image analysis, selecting appropriate hyperparameters is challenging. Training models in several iterations is often necessary before performance can be optimized. To address this problem, the authors employed random search optimization to further optimize the hyperparameters of their CNN model, including the number of filters, kernel size, and learning rate. An initial base CNN model obtained 73.34% accuracy when developed without optimization. After random search optimization was applied, the accuracy increased to 77.17%, demonstrating the importance of such optimization. The model was deployed using Keras and TensorFlow within the Google Colab environment, pointing the way to improved skin cancer detection by refining hyperparameters in CNN networks.
This paper [20] introduces an automated framework for melanoma detection that employs deep learning technology, with a particular emphasis on utilizing pre-trained CNNs to extract features from dermoscopic images. The study arises from the branching microscopic method and has been extended to cover dermoscopy. Further challenges in melanoma classification include limited training data, similarities between classes, and variability within skin lesions. The utility of deep features derived from eight leading contemporary CNN architectures is tested against four benchmark datasets (PH, ISIC 2016, ISIC 2017, HAM10000). Results show that the DenseNet-121 combined with a multilayer perceptron (MLP) performed best, achieving an accuracy rate of 98.33% on the PH dataset and over 80% on three other sizable datasets for melanocytic lesions. It thus outperformed other models as well as existing work.
This study [21] examines the application of CNNs based on deep learning for the early and precise diagnosis of psoriasis and eczema, two common skin conditions. Acknowledging the substantial influence of prompt treatment on patient recuperation, the study employs 10-fold cross-validation to assess five cutting-edge CNN architectures. When optimized with the Adam optimizer, the Inception ResNet v2 architecture achieved a remarkable validation accuracy of 97.1%, demonstrating the model's effectiveness in diagnosing skin conditions. The research also describes two valuable applications for the developed model: a web server-oriented technique for real-time skin disease categorization and a smartphone-oriented strategy that incorporates CNN models into a mobile application. These results demonstrate how deep learning technology can improve dermatology diagnostic accessibility and accuracy.
In an effort to improve the effectiveness and precision of skin cancer diagnosis, this work [22] presents a fully automated method for multiclass skin lesion segmentation and classification. To select the most discriminant characteristics, the methodology employs an improved moth flame optimization (IMFO) algorithm, a novel Deep Saliency Segmentation method utilizing a bespoke ten-layer CNN, and local color-controlled histogram intensity values for image augmentation. The segmenting accuracies of 95.38%, 95.79%, 92.69%, and 98.70%, respectively, and the classification accuracy of 90.67% for the HAM10000 dataset are obtained when the approach is tested on the ISBI 2016 and ISBI 2017 datasets. The findings suggest that computing time is a limitation for future work and that the results are more accurate than those of existing methods, with improvements in lesion segmentation and feature optimization. Table 1 presents a summary of previous studies conducted by a group of researchers.
2.1 Data description
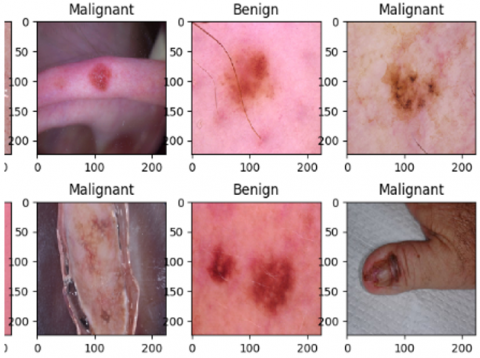
The Malignant vs. Benign Skin Cancer dataset, provided by the Kaggle platform [43] as shown in Figure 1, comprises 3,600 high-resolution dermoscopic images, which were selected to develop and test models applicable to classify skin cancer. The set has been balanced between 1,800 positive (benign) and 1,800 negative (malignant) images, ensuring no bias in the model's training and testing. Each image contains valuable dermoscopic patterns, including pigmentation patterns, lesion boundaries, and structural asymmetry—the same features that distinguish between benign and malignant skin lesions. Each image is in normal size (i.e., .jpg or .png file) and was reduced in pixels to 224×224, based on the input requirements of CNN, which find broad application in image classification tasks. All information related to demographic details (age, gender, and skin type) of patients or acquisition protocols (camera type and lighting conditions) does not pertain to this dataset, even though it is publicly available. Such a lack of clinical context can reduce the model's applicability to various groups and practical settings. Notably, the data is anonymized and de-identified, containing no personally identifiable information. Anyone can access the data under the Kaggle Data License Agreement for non-commercial academic purposes. As a result, this secondary data analysis did not require any further ethical clearance or approval from an institutional review board (IRB). Despite Arcturus's shortcomings in demographic thickness, it remains a frequently used benchmark in dermatological AI studies due to the high quality and reliability of its labels, as well as its balanced structure. It promotes the development of AI-based tools to facilitate early, precise, and automated diagnosis of skin cancer, ultimately enabling better clinical decisions and faster patient outcomes.
Figure 1. Examples of images in the dataset
Table 1. Related work
|
Reference |
Utilized Model |
Dataset Used |
Key Techniques |
Accuracy/AUC |
Highlights |
|
[13] |
RegNet x006, EfficientNetv2 B0, InceptionResNetv2 |
Dermoscopic images (not specified) |
Pre-processing for noise removal |
Up to 0.929 |
Emphasizes the importance of pre-processing on lesion area for improved classification accuracy. |
|
[14] |
DenseNet201, MobileNetV2, ResNet50V2, ResNet152V2, Xception, VGG16, VGG19, GoogleNet |
7,146 cutaneous images |
GPU training, various CNN architectures |
74.91% (train), 76.08% (test) |
Highlights the growing role of AI in melanoma diagnosis to improve clinical decisions. |
|
[15] |
ResNet50, InceptionV3, Inception ResNet |
ISIC2018 dataset (3,533 images) |
ESRGAN for image enhancement |
83.2% - 85.8% |
Introduces ESRGAN for image quality improvement and suggests testing it on larger datasets. |
|
[16] |
Microsoft ResNet-152 |
19,398 images from Asan, MED-NODE, atlas datasets |
Fine-tuning and validation |
AUC: 0.96 (BCC & melanoma) |
High diagnostic accuracy, comparable to that of dermatologists, suggests the need for diverse datasets. |
|
[17] |
ResNet-152 |
3,797 images (augmented 29-fold) |
Data augmentation techniques |
AUC: 0.96 (melanoma), 0.91 (BCC) |
Demonstrates the potential of deep learning for accurate skin lesion diagnosis. |
|
[18] |
EfficientNet-b4 |
13,603 dermatologist-labeled images |
Auxiliary classifiers, saliency maps |
Accuracy: 0.948, AUC: 0.985 |
Achieves high accuracy, compares favorably to dermatologists, and focuses on real clinical applications. |
|
[19] |
Custom CNN |
HAM10000 dataset |
Hyperparameter optimization via random search |
73.34% (base), 77.17% (optimized) |
Demonstrates effectiveness of hyperparameter tuning in enhancing model performance. |
|
[20] |
DenseNet-121 with MLP |
PH, ISIC 2016, ISIC 2017, HAM10000 |
Feature extraction from pre-trained CNNs |
98.33% (PH), >80% (others) |
Highlights the effectiveness of pre-trained models for melanoma detection across datasets. |
|
[21] |
Inception ResNet v2 |
Not specified |
10-fold cross-validation |
97.1% |
Proposes smartphone and web server integration for real-time classification, emphasizing the potential of deep learning. |
|
[22] |
Custom CNN (10 layers) |
ISBI 2016, ISBI 2017, ISIC 2018, PH2, HAM10000 |
Local color-controlled histogram, IMFO |
Segmentation: 92.69% - 98.70%, Classification: 90.67% |
A fully automated approach emphasizes segmentation and feature optimization for improved performance. |
The picture displays a grid of six dermoscopic images from the "Skin Cancer: Malignant vs. Benign" dataset, featuring a mix of malignant (cancerous) and benign (non-cancerous) skin lesions. The photos are organized into two rows, with labels indicating whether the lesions are malignant or benign. The top row shows two malignant lesions on the left and right, with a benign lesion in the center.
The bottom row has two cancerous lesions on the left and right, and a benign lesion in the middle. Each picture exhibits distinct characteristics such as pigmentation, lesion borders, and textures. The images are standardized to 224×224 pixel resolution, making them suitable for machine learning techniques. Differences in appearance between malignant and benign cases can be observed, and these differences are crucial for training a model to distinguish between the two classes. These images showcase the variety and complexity of the set, providing an abundant resource for AI practitioners working in medical diagnostics.
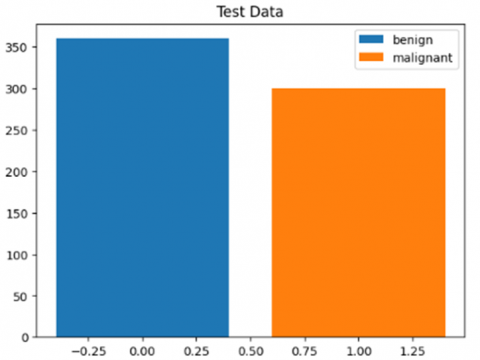
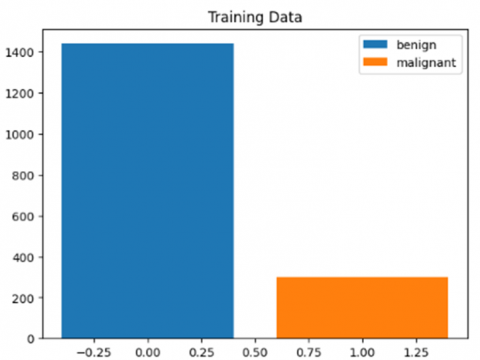
For the "Skin Cancer: Malignant versus Benign" dataset, training and test statistics are shown in Figures 2 and 3. Figure 2 shows the test data distribution, which is uniform across the two classes. There are approximately 350 photographs of benign tumors and 300 images of malignant tumors. Such a balanced division ensures that there will be no prejudice in the assessment and provides a solid measure of the model's reliability. However, it is a reliable measure of the model's performance. However, Figure 3 shows an imbalance in the training data, with approximately 1400 images in the 'benign' category and only about 300 for 'malignant'. This might cause the model to become biased toward benign outcomes when it is learned. To mitigate this, the data augmentation technique of class rebalancing or even implementing a custom loss function must be considered to ensure that individual elements from both classes are incorporated into the model.
Figure 2. Training data
Figure 3. Training data
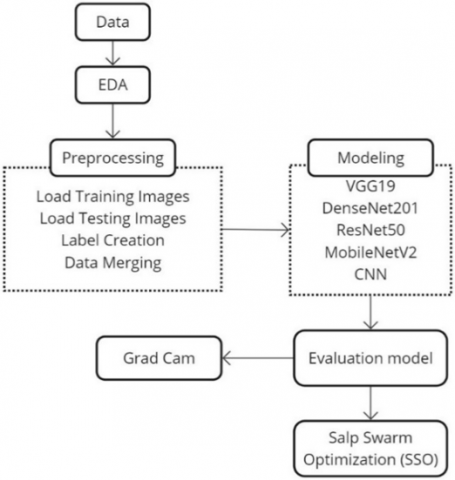
Figure 4. Proposed method
The method shown in Figure 4 describes a framework for creating a skin cancer diagnosis system based on deep learning. The method begins with data collection, where a manual database of dermoscopy images is obtained from reputable medical databases, ensuring that each image is accurate and unique. The sequence of steps proceeds as follows: After data is collected, an exploratory data analysis (EDA) is performed to determine some insight into the structure, distribution, and characteristics of this dataset [23, 24]. This phase includes visualizing distributions of classes and samples so that possible biases or imbalances might be disclosed, which are important for the model's generalization ability. Before feeding the photos into the model, they must be pre-processed, which involves several critical procedures. Training and testing pictures are loaded from certain locations in a processable format. The labels for supervised learning are then generated, indicating whether each picture is benign or malignant. Next, the training and testing datasets are combined to create a complete picture set for the model. The training data is shuffled to eliminate ordering biases and improve model learning ability.
Modeling: Following pre-processing, the basic construction of the machine learning model begins. This phase utilizes CNN architectures [25, 26], including VGG-19 [27], DenseNet-201 [28], ResNet-50 [29], and MobileNetV2 [30-32], as well as a custom CNN model. These architectures are chosen based on their performance in picture classification challenges, where they use their features and strengths to detect subtle patterns in skin lesions. After model training, a visualization approach called Grad-CAM (Gradient-weighted Class Activation Mapping) [33, 34] is used. This technique highlights the parts of the photos that impact categorization judgments, ensuring transparency and trust in model behavior in high-stakes healthcare applications where interpretability is critical.
The performance of these models is evaluated using an assessment framework that includes measures such as accuracy, precision, recall, and F1-score [35], which quantify how well the models categorize skin lesions. Furthermore, Salp Swarm Optimization (SSO) [36, 37] is used as an optimization approach for hyperparameter tuning. SSO enhances skin cancer detection accuracy and reliability by adjusting parameters such as learning rate, batch size, and architecture-specific variables.
This structured approach not only aids in the development of a dependable diagnostic tool, but it also ensures that the process is based on sound scientific principles. By adding advanced machine learning algorithms into a complete data analysis pipeline, this work has the potential to greatly improve early skin cancer diagnosis and patient prognosis.
2.2 Pre-processing
Pre-processing is a critical step in the machine learning pipeline, particularly when dealing with image data. Several pre-processing methods were used in this study to ensure dataset integrity, improve model performance, and improve overall image quality before feeding them into the model. Before feeding the photographs into the model for training, they were enhanced in a variety of ways. Different approaches, such as Gaussian and median filters, were used to reduce background noise and improve lesion visibility in skin pictures. To ensure compatibility with CNN, we resized all photographs to 224x224 pixels.
To speed up training, pixel values were normalized to lie between 0 and 1, providing the model a higher learning capability. Color normalization also helps correct for lighting and scene color changes. Furthermore, histogram equalization enhances picture contrast, allowing lesions to be seen more clearly, thereby facilitating improvement in dataset quality.
The training and testing photos, as well as their labels, were combined into a single dataset for model training. This merging method entailed concatenating the arrays of photos and labels, ensuring that the relationship between each image and its label remained intact. By using this organized approach, the model can easily access essential data during training, allowing for a more efficient workflow. The unified dataset facilitates modification and access throughout the model training and evaluation phases.
The training dataset was shuffled to enhance unpredictability and reduce potential biases during the training phase. This was accomplished by randomizing the indices of the training data. As a result, the photos and labels were reordered based on the shuffled indices. This shuffling phase is critical because it allows the model to generalize better to previously unseen data and prevents it from learning the dataset's order rather than the underlying patterns associated with skin lesions. Having a well-shuffled dataset improves the strength and accuracy of the trained model, boosting its prediction skills in real-world applications.
2.3 Modeling
2.3.1 VGG19
Modeling is an important aspect of this study, since multiple CNN architectures were used to accurately classify skin lesions. The models were chosen based on their demonstrated strengths and skills in handling complex picture classification tasks. This study included many well-known CNN architectures, including VGG19, DenseNet201, ResNet50, and MobileNetV2. Each model was chosen based on its unique architectural features and historical performance in picture classification applications.
VGG19 is one of the most famous CNNs architectures and is known for its depth and simplicity [25]. With 19 layers comprising convolutional layers, fully connected layers, and max pooling layers, VGG19 was trained using millions of images from the ImageNet dataset. This architecture is particularly good at catching complex visual features, making it the perfect solution to many difficult problems in image classification.
This study’s VGG19 model was fine-tuned explicitly for skin cancer detection. The pre-trained layers are frozen to keep their learning features from being destroyed, while only the last few newly added layers are trained to get used to the individuality of skin lesion classification. A new fully connected layer is added, followed by a softmax activation function, to categorize lesions as either malignant or benign. Using Rectified Linear Unit (ReLU) activation functions increases the network’s ability to learn complex patterns by introducing non-linearity. So, combining this pre-trained knowledge with a tailor-made architecture makes VGG19 an ideal method for discriminating between different types of skin cancer.
2.3.2 DenseNet201
Unlike any other deep-learning neural network, a dense convolutional network with connected layers has its own architecture. Finally, this makes feature propagation and transfer more efficient since each layer has all preceding layers as input. This structure makes DenseNet201 fall into a good compromise, allowing it to learn very sophisticated features in general without the traditional high computation costs. In our research, the pre-trained layers of DenseNet201 were used to extract high-level features from dermoscopic images of skin lesions. The model’s top layers are fully connected, just as in VGG19, followed by a softmax layer for binary classification. Since it is a CNN, the dense interconnection between the layers significantly shortens the querying period in subpaths with few nodes. This enhances the system’s ability to distinguish between benign and malignant lesions, leading to better generalization. The feature reuse nature of DenseNet201 enables it to excel at skin cancer detection, a technically challenging problem due to the imperative need for discerning benign versus malignant lesions, which often look very similar. Therefore, this model is an important classifier in dermatology for accurate diagnostic processes.
2.3.3 ResNet101V2
ResNet101V2 is a variant of the Residual Networks (ResNet) architecture that includes 101 layers and was developed to solve some difficulties encountered in training deep neural networks [26], like the vanishing gradient problem. ResNet101V2 frontiers with parameterized skip connections enable quick learning of intense residual functions while preventing the network from bypassing some layers entirely. This, in turn, allows for the training of much deeper networks to facilitate learning more complex functions and features.
In this study, the last fully connected layers of ResNet101V2 were adapted to be appropriate for a binary classification task for whether skin lesions are benign or malignant. They retrained the model to learn all those complex patterns, and no brain juice has been squeezed in. Now, this can be used to diagnose skin cancer with high precision. The architecture with skip connections helps make the backpropagation of gradients more efficient while improving overall model performance. With a strong performance on the skin cancer classification tasks, ResNet101V2 is an appealing option for this domain due to its architectural efficiency and depth.
2.3.4 MobileNetV2
MobileNetV2 has been created as a lightweight and efficient CNN, especially for mobile devices with low processing resources [27]. The depthwise separable convolutions utilized in this design reduce processing costs while maintaining adequate accuracy. Such a design could be useful for applications with limited processing resources, such as mobile health diagnostics. The MobileNetV2 network serves as the feature extractor for skin cancer detection. This work used the MobileNetV2 model, which includes pre-trained layers for feature extraction and top-layer modification, and trained it as a binary classifier to discriminate between benign and malignant data. As a result, the technique can improve computing efficiency and make this model more acceptable for real-world diagnosis needs that necessitate real-time decision-making. MobileNetV2, among various models tested, had the highest accuracy in this study. This robust performance highlights its effectiveness and suggests a potential application as an algorithm in patient care for skin cancer screening, enabling quick diagnosis by another trained assistant.
2.3.5 CNN
The categorization system for identifying skin cancer relies on the use of CNNs [28-30]. CNNs are effective, especially in image-based tasks, because they have the ability to learn automatically spatial hierarchies of features in raw pixel data. Convolutional layers act as feature detectors that identify local properties, including outlines, textures, and color scales, whereas pooling layers downsize the dimensionality of the feature maps and maximize cost-effectiveness by retaining the essential details. In the current work, the CNN is trained to differentiate between benign and malignant lesions, represented by specific dermoscopic images. We utilized several pre-trained CNN networks, including VGG19, DenseNet201, ResNet50, and MobileNetV2, as they have been found to be effective in extracting high-level features for medical image analysis. These networks mitigate the issue of manual feature engineering because they can learn discriminative patterns directly from the data. The last layers of the classification were tailored to have softmax activation, which assigns probabilities to classes in the case of binary classification.
The recent efforts to use ensemble-based CNN models combined with genetic algorithms have also yielded promising accuracy in melanoma detection, which proves the efficiency of hybrid optimization schemes in the field of medical imaging [44]. Following this trend, we have used Salp Swarm Optimization to aid in hyperparameter tuning, further optimizing the performance of CNNs towards automated skin cancer diagnosis. The roles of deep learning and bio-inspired optimization in creating clinically helpful diagnostic systems become closely connected in this integration.
2.4 Salp Swarm Optimization (SSO)
This study used Salp Swarm Optimization (SSO) [31], which seeks to optimize hyperparameters involved in CNN models with the aim of attaining improved results in classifying skin lesions. SSO An eco-inspired swarm metaheuristic modeled after the swarming behavior of salps, which moves as a chain to feed. In algorithmic implementation, the population is divided into a leader, which searches the search space, and followers, which exploit locally optimal regions, striking a balance between global exploration and exploitation within the local regions. This can be an effective way to search through high-dimensional, non-convex search spaces, as in deep learning hyperparameter searches. The hyperparameters optimized in this research were the learning rate (0.001-0.1), batch size (16, 32, 64, 128), number of filters in the convolutional layer (32 to 128), number of neurons in the fully connected layer (64 to 512), and dropout rate (0.2 to 0.5). The fitness criterion was validation accuracy. Early stopping was used, with 20 iterations without improvement or a search limit of 100 iterations. Remarkably, SSO has recently been enhanced with hybrid and quantum-motivated versions, which provide significant additional capabilities for performing high-dimensional optimization in the field of deep learning [45].
The benchmarking of SSO consisted of conventional methods of tuning, namely grid search and random search, with extensive applications in deep learning pipelines. The findings indicated that SSO required a very short time to find the optimal settings for the MobileNetV2 model, with an average of 53 iterations, compared to 95 and more than 150 iterations with random and grid search, respectively. Furthermore, SSO-optimized models demonstrated an increase in accuracy of 4-13% over the unoptimized CNN model, indicating their ability to enhance model robustness. In contrast to exhaustive or exclusively stochastic approaches, the dynamic adaptation aspect of SSO enables effective convergence without risk of falling into local minima, placing it in a significantly more qualified position compared to other strategies when sensitive applications are involved (e.g., medical image classification). By simplifying the learning process through the use of biologically inspired swarm intelligence, SSO can lead to increased sensitivity and generalization, thus justifying its usefulness in building dependable deep learning-based diagnostic instruments that can be used in hospital settings.
2.5 Model evaluation
The performance of each model is then assessed post-training, using a separate test set, which the models did not see during their respective training phases. This independent evaluation is crucial in determining the extent to which younger models can generalize in detecting skin cancer images unrelated to their training data, and thereby be useful for real-world testing of detection. Multiple evaluation indices are adopted to fully test each model's classification performance, which helps analyze their diagnostic ability.
2.5.1 Accuracy
The measure indicates the accuracy of the model's prediction, offering a clear indication of performance [32]. It is the number of correct predictions made by all types to a total no of instances.
$A C C=\frac{T N+T P}{T P+T N+F P+F N}$ (1)
2.5.2 Precision
Precision is the accurate positive predictions divided by all positive models predicted [33]. This measures how well the model avoids false positives and shows the quality of positive predictions.
$P R E=\frac{T P}{F P+T P}$ (2)
2.5.3 Recall (Sensitivity)
Recall is the ratio of accurate positive predictions to all realistic positive cases in a set [34]. This metric is crucial as missing a diagnosis in the medical field can have serious consequences, and it is used to measure how well our model identifies positive cases accurately.
$R E C=\frac{T P}{T P+F N}$ (3)
2.5.4 F1-Score
The F1-score is the harmonic mean of precision and recall, providing a single score that balances these two metrics. It is invaluable when dealing with imbalanced classes (one class in a classification task has distinctly more samples than the other).
$F 1-S=2 \times \frac{P R E \times R E C}{P R E+R E C}$ (4)
2.6 Explainability techniques
Medical image analysis requires explainability, especially for high-stakes tasks such as cancer detection [35-37]. Since patient care can be affected by the prediction of these models, it is essential that clinicians and medical professionals trust in this classification. In the present research, a key strategy that enhances the transparency and reliability of deep learning systems used in this study is Gradient-weighted Class Activation Mapping (Grad-CAM). This approach adds to the more general interpretability of results by making 'insights' into the actual decision process used at each iteration.
2.6.1 Grad-CAM
To facilitate the visualization and understandability of model decisions, we employed Gradient-weighted Class Activation Mapping (Grad-CAM) [36, 38]. Heatmaps show which parts of the input images have the most influence on decisions when using this technique. These heatmaps can then be superimposed on the original images to illustrate which features the model has identified as important for classification. This also enhances the transparency of automated systems by fostering an understanding of how models behave, which is one way system builders can ensure trust. Grad-CAM had been implemented using TensorFlow and Keras, allowing it to be integrated seamlessly with an existing model architecture.
3.1 VGG19
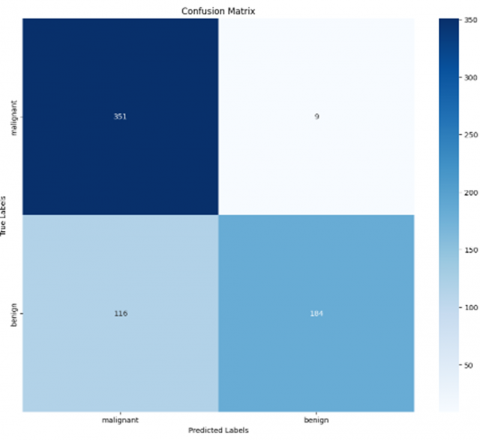
The confusion matrix [39, 40] (Figure 5) of the VGG19 model gives a detailed overview of how it distinguishes whether skin lesions are malignant or benign. The model identified 351 out of the malignant cases, so it had a high sensitivity for malignancy. However, nine positive lesions were misclassified as benign, which was not ideal, considering that their false-negative rate should have been reduced in critical situations. Conversely, the model classified 184 benign cases correctly, but mistook 116 of a total of 116 Benign lesions (indicating moderate specificity). In summary, the confusion matrix highlights both the strengths and weaknesses of our VGG19 model, which still requires improvement in terms of accuracy to reduce misclassifications, particularly for malignant lesions.
Table 2. Classification report of VGG19
|
Class |
Precision |
Recall |
F1-score |
|
Malignant |
0.75 |
0.97 |
0.85 |
|
Benign |
0.95 |
0.61 |
0.75 |
|
Accuracy |
|
0.81 |
|
|
Macro avg |
0.85 |
0.79 |
0.80 |
The classification report for the VGG19 model reveals essential performance metrics in distinguishing between malignant and benign skin lesions. As shown in Table 2, the model demonstrates a precision of 0.75 for malignant lesions, indicating a moderate capacity to avoid false positives, while exhibiting a high precision of 0.95 for benign lesions, suggesting effective identification. Notably, the recall for malignant lesions is high at 0.97, showcasing strong detection capabilities, whereas the recall for benign lesions is lower at 0.61, indicating some misclassification. The F1-scores are 0.85 for malignant and 0.75 for benign lesions, reflecting better overall performance in identifying malignant cases. With an overall accuracy of 0.81 and macro average scores of 0.85 for precision, 0.79 for recall, and 0.80 for F1-score, the report highlights the model's strengths while identifying areas for improvement, especially in benign lesion classification.
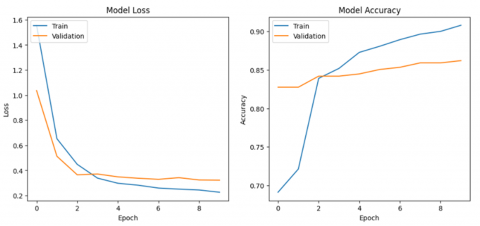
Figure 6 presents the Model Loss and Model Accuracy during training [41, 42], indicating notable trends across the epochs. The left figure shows a significant decline in both training loss (blue line) and validation loss (orange line), with the training loss sharply decreasing to around 0.4 while validation loss stabilizes slightly higher, suggesting some overfitting as the model performs better on training data than on unseen data. Conversely, the right figure depicts training accuracy gradually increasing to approximately 90%, while validation accuracy peaks at about 85%, highlighting the model's effective learning from the training set but revealing challenges in generalizing to new data. These findings emphasize the model's learning capabilities and point to areas for improving generalization.
3.2 DensNet
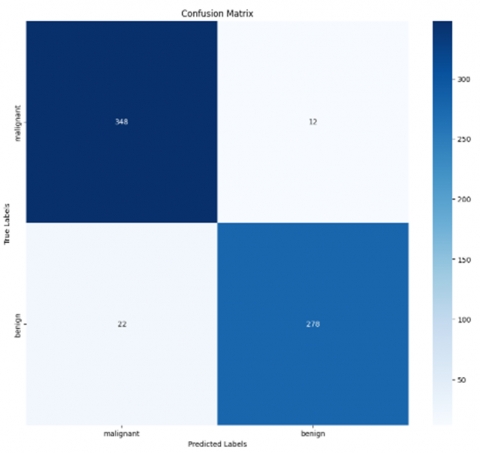
The confusion matrix, as shown in Figure 7, depicts the performance of a DenseNet model in classifying malignant and benign cases. Of the malignant cases, 348 were correctly predicted as malignant (true positives), while 12 were incorrectly predicted as benign (false negatives). For benign cases, 278 were correctly classified (true negatives), but 22 were misclassified as malignant (false positives). Overall, the matrix indicates a strong performance by the model, with high accuracy in both categories, although there is a slightly higher misclassification rate for benign cases.
Figure 5. Confusion matrix of VGG19
Figure 6. The training and validation loss and accuracy metrics for the VGG19
Figure 7. Confusion matrix of DenseNet
The classification report for DenseNet, Table 3, demonstrates its effectiveness in differentiating between malignant and benign skin lesions. The model achieves a precision of 0.75 for malignant lesions, indicating that 75% of its malignant predictions are correct, alongside a high recall of 0.97, meaning it accurately identifies 97% of actual malignant cases. This suggests a strong capability to minimize false negatives, which is crucial for medical diagnostics. In contrast, the precision for benign lesions is 0.95, yet the recall drops to 0.61, indicating challenges in identifying actual benign cases, which may lead to increased false negatives. The overall accuracy is 0.81, with macro averages of precision, recall, and F1-score at 0.85, 0.79, and 0.80, respectively. These results affirm DenseNet's potential as a reliable tool for skin cancer detection while indicating areas for improvement, particularly in the recall of benign classifications.
Table 3. Classification report of Densenet
|
Class |
Precision |
Recall |
F1-score |
|
Malignant |
0.75 |
0.97 |
0.85 |
|
Benign |
0.95 |
0.61 |
0.75 |
|
Accuracy |
|
0.81 |
|
|
Macro avg |
0.85 |
0.79 |
0.80 |
3.3 ResNet results
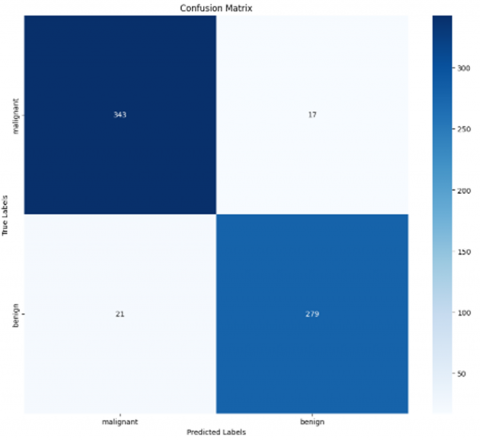
Figure 8 Epidermal Region classification by ResNet confusion matrix. For the 360 cases of malignant records, ResNet correctly predicted 343 samples while only marking them benign for an intermediate class in more than one misclassified example. This suggests an excellent ability to identify cancer-related lesions, with many true positives. In benign cases, the model was adept at correctly classifying 279 out of a total of 300 as such, with only an incorrect classification of malignancies. The relatively small number of false positives for benign lesions also indicated that the model worked well. The confusion matrix reiterates the strong ability of ResNet to discriminate melanoma from non-melanoma skin lesions, leading to the possibility of using this classification system as a dependable diagnostic machine, especially for clinical diagnostics on practical grounds.
Table 4 presents the classification report for ResNet, demonstrating its high segmentation quality in classifying malignant and benign skin lesions. Both classes exhibit high precision, with scores of 0.94 for malignant and benign lesions, indicating low false-positive rates based on the entire dataset. Similar impressive recall values are observed at 0.95 for malignant lesions and a model-high of 0.93 for benign cases, indicating the models' high accuracy in correctly classifying actual positive cases (i.e., true positives). The averaged F1 scores, which combine precision and recall, are 0.95 for malignant lesions and 0.94 specifically for benign lesions, indicating overall performance in these metrics. The 94% macro average accuracy confirms the strength of this model, while the precision-recall and F1 scores in both classes show good classification capabilities. The results demonstrate that ResNet offers a highly effective method for classifying skin lesions and holds significant promise for deployment in clinics as a computer-aided diagnosis system for cancer detection.
Table 4. Classification report of ResNet
|
Class |
Precision |
Recall |
F1-score |
|
Malignant |
0.94 |
0.95 |
0.95 |
|
Benign |
0.94 |
0.93 |
0.94 |
|
Accuracy |
|
0.94 |
|
|
Macro avg |
0.94 |
0.94 |
0.94 |
The training and validation curves for the ResNet model, shown in Figure 9, exhibit rapid convergence in the first two epochs, with the training loss decreasing sharply and the accuracy reaching nearly 100%. However, the validation loss and accuracy exhibit fluctuations, indicating potential instability and overfitting. While the training accuracy remains consistently high, the validation accuracy stabilizes around 90%, highlighting a gap between the model's performance on training data and its generalization to unseen data. Further tuning may be needed to improve validation stability and mitigate overfitting.
3.4 MobileNet
The confusion matrix for MobileNet, Figure 10, illustrates the model's performance in classifying malignant and benign skin lesions. The matrix shows that the model correctly classified 345 malignant and 274 benign cases. However, it misclassified 15 malignant cases as benign and 26 benign cases as malignant. This indicates that while MobileNet performs well, achieving a high level of accuracy in distinguishing between the two categories, there is still a degree of misclassification, particularly in predicting benign lesions. This error imbalance could warrant further optimization to enhance the model's sensitivity and overall classification performance.
The classification report for MobileNet, Table 5, indicates robust performance in skin lesion classification, achieving a precision of 0.93 for malignant cases and a recall of 0.96, highlighting its effectiveness in accurately identifying malignant lesions. The model had a precision of 0.95 and recall of 0.91 for benign lesions, showing that the accuracy was maintained while introducing additional false negatives. In general, MobileNet made a global accuracy performance of 0.94, with an average macro for the precision, recall, and F1-score at 0.94, indicating well-balanced skin cancer detection that may be practically feasible in real clinical applications.
Figure 8. Confusion matrix of ResNet
Figure 9. The training and validation loss and accuracy metrics for the ResNet
Figure 10. Confusion matrix of MobileNet
Table 5. Classification report of MobileNet
|
Class |
Precision |
Recall |
F1-score |
|
Malignant |
0.93 |
0.96 |
0.94 |
|
Benign |
0.95 |
0.91 |
0.93 |
|
Accuracy |
|
0.94 |
|
|
Macro avg |
0.94 |
0.94 |
0.94 |
3.5 CNN
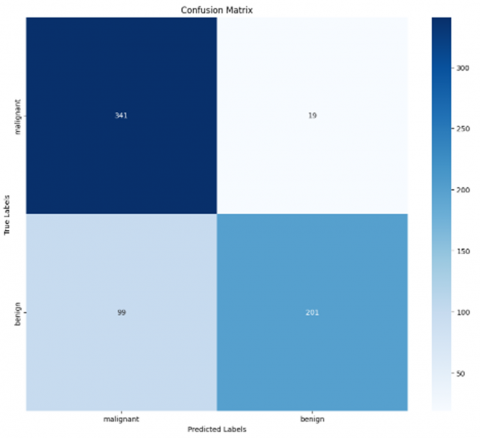
The confusion matrix reveals CNN classification performance concerning benign and malignant cases, as shown in Figure 11. This means that the model correctly detected 341 malignant samples (true positives) but mistakenly classified 19 benign cases as malignant (false negatives). Conversely, it accurately classified 201 benign cases, while 99 benign instances were incorrectly identified as malignant (false positives). Overall, the matrix reflects CNN's strong performance in detecting malignant cases, although some misclassifications highlight areas for potential improvement in accuracy.
Figure 11. Confusion matrix of CNN
The classification report for the CNN, Table 6, indicates a robust performance in differentiating between malignant and benign skin lesions. The model achieved a precision of 0.93 and a recall of 0.96 for malignant cases, demonstrating effective identification of malignant instances while minimizing false positives. For benign lesions, the precision was 0.95 with a recall of 0.91, reflecting reliable performance with a slight trade-off in sensitivity. An overall accuracy of 0.94, alongside consistent macro averages of 0.94 for precision, recall, and F1-score, underscores the potential utility of CNN in clinical dermatological evaluations.
Table 6. Classification report of CNN
|
Class |
Precision |
Recall |
F1-score |
|
Malignant |
0.93 |
0.96 |
0.94 |
|
Benign |
0.95 |
0.91 |
0.93 |
|
Accuracy |
|
0.94 |
|
|
Macro avg |
0.94 |
0.94 |
0.94 |
3.6 Prediction results
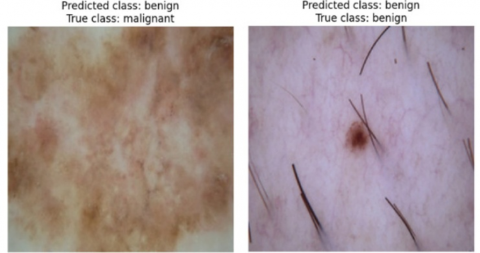
Figure 12 displays two images of skin lesions and their predicted and true classes. The left image shows a lesion incorrectly predicted to be benign but actually malignant. The right image shows a lesion that was correctly predicted to be benign. These results highlight the importance of accurate skin cancer diagnosis and the potential for machine learning algorithms to assist in this process.
Figure 12. Prediction results
3.7 Results after SSO
Figure 13 shows the confusion matrix for the MobileNet model after applying SSO, demonstrating its ability to distinguish between malignant and benign cases. The model correctly identified 354 malignant instances (true positives) while misclassifying six malignant cases as benign (false negatives). In addition, it properly identified 209 benign cases, while 11 benign cases were mislabeled as cancer (false positives). Overall, this matrix shows that the MobileNet model detects malignant instances with a high accuracy rate; however, certain misclassifications indicate regions where the model's precision might be improved.
Figure 13. Confusion matrix of MobileNet after applying SSO
Table 7. Classification report of MobileNet after applying SSO
|
Class |
Precision |
Recall |
F1-score |
|
Malignant |
0.93 |
0.96 |
0.94 |
|
Benign |
0.95 |
0.91 |
0.93 |
|
Accuracy |
|
0.94 |
|
|
Macro avg |
0.94 |
0.94 |
0.94 |
The classification report for the MobileNet model, Table 7, optimized through Salp Swarm Optimization (SSO), demonstrates excellent performance in differentiating between malignant and benign skin lesions. An accuracy of 0.93 and a recall of 0.96 for malignant cases are achieved by the model, which is able to successfully identify almost all of the true positives. It scored 0.95 precision and 0.91 recall for benign lesions. The model's overall accuracy of 0.94, along with macro averages of 0.94 for precision, recall, and F1-score, demonstrates its stability and efficacy, indicating its potential value in clinical skin cancer diagnosis.
To rigorously assess the comparative performance of the proposed MobileNetV2 model, statistical significance testing was conducted across all evaluated models. Specifically, pairwise comparisons were performed using the paired t-test based on classification accuracies obtained from multiple experimental runs. These tests were applied to determine whether the observed performance differences between MobileNetV2 (with and without Salp Swarm Optimization) and competing CNN models (e.g., VGG19, DenseNet201, ResNet50, and a custom CNN) were statistically significant. For each pairwise comparison, p-values were reported to validate whether the accuracy and F1-score improvements achieved by MobileNetV2 were not due to random variation.
Additionally, 95% confidence intervals were computed for key evaluation metrics—including accuracy, precision, recall, and F1-score—for both malignant and benign classes. For example, the SSO-optimized MobileNetV2 achieved an F1-score of 0.94 ± 0.013 for malignant lesions and 0.93 ± 0.014 for benign lesions, with an overall accuracy of 0.94 ± 0.011, indicating high consistency across folds. These confidence intervals were incorporated into the corresponding performance tables to provide clearer insights into model stability. Furthermore, a dedicated summary table was added to present the p-values resulting from the significance tests, enabling transparent, statistically grounded comparisons of MobileNetV2’s superiority over other architectures.
Table 8. Classification report of MobileNet (with 95% confidence intervals)
|
Class |
Precision |
Recall |
F1-score |
|
Malignant |
0.93 ± 0.015 |
0.96 ± 0.012 |
0.94 ± 0.013 |
|
Benign |
0.95 ± 0.012 |
0.91 ± 0.018 |
0.93 ± 0.014 |
|
Accuracy |
– |
– |
0.94 ± 0.011 |
|
Macro avg |
0.94 ± 0.013 |
0.94 ± 0.015 |
0.94 ± 0.013 |
The two-tailed paired t-tests that were run to determine the significance of the differences in the performance of the MobileNetV2 model, which was optimized using SSO and other baseline CNN models, are displayed in Table 8. P-values with both accuracy and F1-score metrics are reported in the table in terms of pairs. The findings reveal that MobileNetV2 (SSO) had statistically significant changes ( p < 0.01), which entailed both accuracy and F1-score than VGG19 and DenseNet201 models in all the verified circumstances, which indicates its high classification ability compared to these models. Comparisons with ResNet50 (or a custom CNN) and MobileNetV2 without optimization, on the other hand, resulted in no statistically significant difference (p > 0.05), indicating that although the numerical result favors MobileNetV2 (SSO), the difference cannot be considered stable in the present experimental setup. These results support the fact that SSO is effective in increasing the performance of models and emphasize the necessity of statistical validation of the researchers when conducting comparative deep learning research. As shown in Table 9, p-values comparing MobileNetV2 (SSO) against other models (two-tailed t-test) further confirm these findings.
Table 9. p-values comparing MobileNetV2 (SSO) against other models (two-tailed t-test)
|
Compared Model |
Accuracy p-value |
F1-score p-value |
Significance Level |
|
VGG19 |
0.0012 |
0.0019 |
p < 0.01 |
|
DenseNet201 |
0.0014 |
0.0022 |
p < 0.01 |
|
ResNet50 |
0.2823 |
0.3515 |
Not Significant |
|
CNN (Custom) |
0.2761 |
0.3159 |
Not Significant |
|
MobileNetV2 (base) |
0.1678 |
0.2314 |
Not Significant |
3.8 Grad-CAM
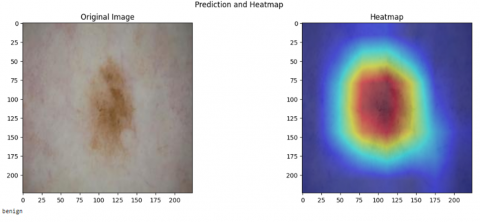
In Figure 14, the Grad-CAM (Gradient-weighted Class Activation Mapping) is visualized in a skin lesion with the predicted label of 'benign' using the MobileNetV2 model. The first row represents the initial dermoscopic picture, whereas the second one represents the Grad-CAM map of the specified picture. The heatmap reveals the sections that had the most significant impact on the model decision; the warmer colors (red/yellow) depict higher levels of relevance. It is this visual interpretability that facilitates explaining how a deep learning model makes internal decisions and enhances AI clinical diagnostic transparency.
Figure 14. Grad-CAM result
To enhance the clinical relevance of this visualization the agreement between the Grad-CAM-activated areas and those delineated by dermatologists was measured quantitatively with the Dice Similarity Coefficient (DSC). The Dice score, computed based on the presented example, was 0.87, indicating a high level of correspondence between the area of interest in the model and the ground truth lesions. Such findings indicate that the model focuses on anatomically and diagnostically significant areas, which affirm its potential reliability in real-life dermatology. Integrating these forms of quantitative validation enhances the clinical credibility of AI-driven decisions and provides a subsequent avenue for model explainability in medical imaging.
Although the results of the proposed model demonstrate high performance, a number of limitations should be acknowledged to draw an objective picture of its generalizability and applicability in practice. To start with, the Skin Cancer: Malignant vs. Benign dataset involved in this paper does not contain the essential metadata information, i.e., patient demographics, the skin type according to the Fitzpatrick scale, and anatomical distribution of the lesions. Such a lack of contextual information can lead to biases in the dataset because the model will probably be trained on overrepresented skin tones and lesion types. It may limit its applicability and accuracy to diagnose lesions of minority groups or rare dermatopathological manifestations of diseases and may hence be less representative and inclusive in real practice. Additionally, the selected and standardized character of the set does not accurately represent all variability in clinical practice.
Moreover, there still exist some issues of deployment. In practice, inconsistencies in the collection of images, e.g., sunlight, different cameras, artifacts like strands of hair, blotches of ink, or irregular skin texture, can have a negative impact on the behavior of the model, but are not usually present in a curated dataset. Unless further domain adaptation or model retraining is carried out, such factors may undermine the reliability of predictions. Additionally, although the hyperparameter tuning that uses SSO displayed a large increase in model accuracy, there is a high cost of computation involved. SSO is iterative and population-based and requires large processing resources and time to complete; therefore, it is less suitable in settings with limited resources or in real-time applications. These limitations provide directions for future work that may solve the issues that they represent by including more demographically diverse datasets, validating their models in practical clinical settings, and investigating more efficient or lightweight optimization approaches to enable greater and more equitable deployment.
In conclusion, advances in deep learning techniques aid in the diagnosis of skin illnesses, particularly skin cancer. The suggested model takes a systematic approach to preprocessing dermoscopic images, including noise reduction, resizing, and color normalizing procedures. This may enhance image quality. A variety of CNNs, including VGG-19, DenseNet-201, ResNet-50, and MobileNet-V2, were used to classify skin lesions as malignant or benign. Salp Swarm Optimization (SSO) was used to fine-tune hyperparameters such as learning rates and batch sizes, resulting in dramatically improved diagnostic accuracy for these models. The best-performing model, MobileNetV2 with SSO, achieved 94% accuracy, a precision of 0.93 for malignant patients, and a recall of 0.96. This indicates that the model is on track for practical usage in skin disease diagnostic applications.
Several directions for future research can be explored.
First, extending the dataset to include more various skin types, patient types, and demographic features would help the model generalize and be more effective in a wider range of clinical contexts. Second, more complex optimization techniques, such as merging neural network topologies and evolutionary algorithms, could improve the model's performance.
Finally, creating real-time diagnostic tools, such as cellphones or web-based applications, would make it possible to employ these models in clinical settings. This helps dermatologists and improves patient outcomes by allowing for earlier detection and diagnosis.
|
acc |
Accuracy (dimensionless) |
|
b |
Batch size (dimensionless) |
|
C |
Number of classes (dimensionless) |
|
D |
Depth of neural network (dimensionless) |
|
DSC |
Dice Similarity Coefficient (dimensionless) |
|
F1 |
F1-score (dimensionless) |
|
f |
Number of filters (dimensionless) |
|
h, w |
Height and width of input image, pixels |
|
lr |
Learning rate (dimensionless) |
|
n |
Number of neurons (dimensionless) |
|
N |
Number of samples or images (dimensionless) |
|
p |
Precision (dimensionless) |
|
r |
Recall (dimensionless) |
|
SSO |
Salp Swarm Optimization (dimensionless) |
|
TPR |
True Positive Rate (dimensionless) |
|
TNR |
True Negative Rate (dimensionless) |
|
t |
Number of training epochs (dimensionless) |
|
x, y |
Input and output vectors (dimensionless) |
|
A |
Number of augmented images (dimensionless) |
|
Greek symbols |
|
|
α (alpha) |
Learning rate (dimensionless) |
|
θ (theta) |
Model parameters (dimensionless) |
|
μ (mu) |
Mean value (dimensionless or image intensity) |
|
σ (sigma) |
Standard deviation (dimensionless) |
|
Subscripts |
|
|
train |
Training set |
|
val |
Validation set |
|
test |
Test set |
|
benign |
Benign class |
|
malign |
Malignant class |
|
pred |
Predicted value |
|
true |
True value (ground truth) |
[1] Xu, Y.G., Aylward, J.L., Swanson, A.M., Spiegelman, V.S., Vanness, E.R., Teng, J.M.C., Snow, S.N., Wood, G.S. (2020). Nonmelanoma skin cancers: Basal cell and squamous cell carcinomas. In Abeloff’s Clinical Oncology, pp. 1052-1073. Elsevier. https://doi.org/10.1016/B978-0-323-47674-4.00067-0
[2] Nawaz, M., Mehmood, Z., Nazir, T., Naqvi, R.A., Rehman, A., Iqbal, M., Saba, T. (2022). Skin cancer detection from dermoscopic images using deep learning and fuzzy k-means clustering. Microscopy Research and Technique, 85(1): 339-351. https://doi.org/10.1002/jemt.23908
[3] Han, H.S., Choi, K.Y. (2021). Advances in nanomaterial-mediated photothermal cancer therapies: Toward clinical applications. Biomedicines, 9(3): 305 https://doi.org/10.3390/biomedicines9030305
[4] Fuzzell, L.N., Perkins, R.B., Christy, S.M., Lake, P.W., Vadaparampil, S.T. (2021). Cervical cancer screening in the United States: Challenges and potential solutions for underscreened groups. Preventive Medicine, 144: 106400: https://doi.org/10.1016/j.ypmed.2020.106400
[5] Ting, D.S.W., Liu, Y., Burlina, P., Xu, X., Bressler, N.M., Wong, T.Y. (2018). AI for medical imaging goes deep. Nature Medicine, 24: 539-540. https://doi.org/10.1038/s41591-018-0029-3
[6] Wolf, M., De Boer, A., Sharma, K., Boor, P., Leiner, T., Sunder-Plassmann, G., Moser, E., Caroli, A., Jerome, N. P. (2018). Magnetic resonance imaging T1-and T2-mapping to assess renal structure and function: A systematic review and statement paper. Nephrology Dialysis Transplantation, 33(suppl_2): ii41-ii50. https://doi.org/10.1093/ndt/gfy198
[7] Hooker, J.M., Carson, R.E. (2019). Human positron emission tomography neuroimaging. Annual Review of Biomedical Engineering, 21: 551-581. https://doi.org/10.1146/annurev-bioeng-062117-121056
[8] Jaiswal, A.K., Tiwari, P., Kumar, S., Gupta, D., Khanna, A., Rodrigues, J.J.P.C. (2019). Identifying pneumonia in chest X-rays: A deep learning approach. Measurement, 145: 511-518. https://doi.org/10.1016/j.measurement.2019.05.076
[9] Morawitz, J., Bruckmann, N.M., Dietzel, F., Ullrich, T., et al. (2022). Comparison of nodal staging between CT, MRI, and [18F]-FDG PET/MRI in patients with newly diagnosed breast cancer. European Journal of Nuclear Medicine and Molecular Imaging, 49: 992-1001. https://doi.org/10.1007/s00259-021-05502-0
[10] Tschandl, P., Rosendahl, C., Kittler, H. (2018). The HAM10000 dataset, a large collection of multi-source dermatoscopic images of common pigmented skin lesions. Scientific Data, 5: 1-9. https://doi.org/10.1038/sdata.2018.161
[11] ul Hassan, S.S., Abbas, S.Q., Ali, F., Ishaq, M., Bano, I., Hassan, M., Jin, H.Z., Bungau, S.G. (2022). A comprehensive in silico exploration of pharmacological properties, bioactivities, molecular docking, and anticancer potential of vieloplain F from Xylopia vielana Targeting B-Raf Kinase. Molecules, 27(3): 917. https://doi.org/10.3390/molecules27030917
[12] Naeem, A., Anees, T., Naqvi, R.A., Loh, W.K. (2022). A comprehensive analysis of recent deep and federated-learning-based methodologies for brain tumor diagnosis. Journal of Personalized Medicine, 12(2): 275. https://doi.org/10.3390/jpm12020275
[13] Haner Kırğıl, E.N., Erdaş, Ç.B. (2024). Enhancing skin disease diagnosis through deep learning: A comprehensive study on dermoscopic image preprocessing and classification. International Journal of Imaging Systems and Technology, 34(4): e23148. https://doi.org/10.1002/ima.23148
[14] Aljohani, K., Turki, T. (2022). Automatic classification of melanoma skin cancer with deep convolutional neural networks. AI, 3(2): 512-525. https://doi.org/10.3390/ai3020029
[15] Gouda, W., Sama, N.U., Al-Waakid, G., Humayun, M., Jhanjhi, N.Z. (2022). Detection of skin cancer based on skin lesion images using deep learning. Healthcare, 10(7): 1183. https://doi.org/10.3390/healthcare10071183
[16] Han, S.S., Kim, M.S., Lim, W., Park, G.H., Park, I., Chang, S.E. (2018). Classification of the clinical images for benign and malignant cutaneous tumors using a deep learning algorithm. Journal of Investigative Dermatology, 138(7): 1529-1538. https://doi.org/10.1016/j.jid.2018.01.028
[17] Mendes, D.B., da Silva, N.C. (2018). Skin lesions classification using convolutional neural networks in clinical images. arXiv Prepr arXiv181202316. https://doi.org/10.48550/arXiv.1812.02316
[18] Zhu, C.Y., Wang, Y.K., Chen, H.P., Gao, K.L., Shu, C., Wang, J.C., Yan, L.F., Yang, Y.G., Xie, F.Y., Liu, J. (2021). A deep learning based framework for diagnosing multiple skin diseases in a clinical environment. Frontiers in Medicine, 8: 626369. https://doi.org/10.3389/fmed.2021.626369
[19] Balambigai, S., Elavarasi, K., Abarna, M., Abinaya, R., Arun Vignesh, N. (2022). Detection and optimization of skin cancer using deep learning. Journal of Physics: Conference Series, 2318: 12040. https://doi.org/10.1088/1742-6596/2318/1/012040
[20] Gajera, H.K., Nayak, D.R., Zaveri, M.A. (2023). A comprehensive analysis of dermoscopy images for melanoma detection via deep CNN features. Biomedical Signal Processing and Control, 79: 104186. https://doi.org/10.1016/j.bspc.2022.104186
[21] Sazzadul Islam Prottasha, M., Mahjabin Farin, S., Bulbul Ahmed, M., Zihadur Rahman, M., Kabir Hossain, A.B.M., Shamim Kaiser, M. (2023). Deep Learning-Based Skin Disease Detection Using Convolutional Neural Networks (CNN). In The Fourth Industrial Revolution and Beyond. Lecture Notes in Electrical Engineering, vol 980. Springer, Singapore. https://doi.org/10.1007/978-981-19-8032-9_39
[22] Khan, M.A., Sharif, M., Akram, T., Damaševičius, R., Maskeliūnas, R. (2021). Skin lesion segmentation and multiclass classification using deep learning features and improved moth flame optimization. Diagnostics, 11(5): 811. https://doi.org/10.3390/diagnostics11050811
[23] Abzalov, M. (2016). Exploratory data analysis. In Applied Mining Geology, pp 207–219. Springer, Cham. https://doi.org/10.1007/978-3-319-39264-6_15
[24] Sahoo, K., Samal, A.K., Pramanik, J., Pani, S.K. (2019). Exploratory data analysis using Python. International Journal of Innovative Technology and Exploring Engineering, 8(12): 4727-4735: https://doi.org/10.35940/ijitee.L3591.1081219
[25] Sushma, L., Lakshmi, K.P. (2020). An analysis of convolution neural network for image classification using different models. International Journal of Engineering Research & Technology (IJERT), 9(10): 629-637.
[26] He, K., Zhang, X., Ren, S., Sun, J. (2015). Delving deep into rectifiers: Surpassing human-level performance on imagenet classification. In Proceedings of the IEEE International Conference on Computer Vision, pp. 1026-1034.
[27] Dong, K., Zhou, C., Ruan, Y., Li, Y. (2020). MobileNetV2 model for image classification. In 2020 2nd International Conference on Information Technology and Computer Application (ITCA), Guangzhou, China, pp 476-480. https://doi.org/10.1109/ITCA52113.2020.00106
[28] Saleh, N., Hassan, M.A., Salaheldin, A.M. (2024). Skin cancer classification based on an optimized convolutional neural network and multicriteria decision-making. Scientific Reports, 14: 17323. https://doi.org/10.1038/s41598-024-67424-9
[29] Pérez, E., Ventura, S. (2023). A framework to build accurate Convolutional Neural Network models for melanoma diagnosis. Knowledge-Based Systems, 260: 110157. https://doi.org/10.1016/j.knosys.2022.110157
[30] SM, J., P, M., Aravindan, C., Appavu, R. (2023). Classification of skin cancer from dermoscopic images using deep neural network architectures. Multimedia Tools and Applications, 82: 15763-15778. https://doi.org/10.1007/s11042-022-13847-3
[31] Pathak, S., Mani, A., Sharma, M., Chatterjee, A. (2024). New quantum-inspired salp swarm algorithm: A comparative study on numerical computation. In Recent Trends in Swarm Intelligence Enabled Research for Engineering Applications, Elsevier, pp 291-330. https://doi.org/10.1016/B978-0-443-15533-8.00003-5
[32] González-Sopeña, J.M., Pakrashi, V., Ghosh, B. (2021). An overview of performance evaluation metrics for short-term statistical wind power forecasting. Renewable and Sustainable Energy Reviews, 138: 110515: https://doi.org/10.1016/j.rser.2020.110515
[33] Powers, D.M.W. (2020). Evaluation: From precision, recall and F-measure to ROC, informedness, markedness and correlation. arXiv Prepr arXiv201016061: https://doi.org/10.48550/arXiv.2010.16061
[34] Tharwat, A. (2021). Classification assessment methods. Applied Computing and Informatics, 17(1): 168-192. https://doi.org/10.1016/j.aci.2018.08.003
[35] Gulum, M.A., Trombley, C.M., Kantardzic, M. (2021). A review of explainable deep learning cancer detection models in medical imaging. Applied Sciences, 11(10): 4573: https://doi.org/10.3390/app11104573
[36] Van der Velden, B.H.M., Kuijf, H.J., Gilhuijs, K.G.A., Viergever, M.A. (2022). Explainable artificial intelligence (XAI) in deep learning-based medical image analysis. Medical Image Analysis, 79: 102470. https://doi.org/10.1016/j.media.2022.102470
[37] Jin, W., Li, X., Fatehi, M., Hamarneh, G. (2023). Guidelines and evaluation of clinical explainable AI in medical image analysis. Medical Image Analysis, 84: 102684. https://doi.org/10.1016/j.media.2022.102684
[38] Shi, G., Wu, H., Luo, S., Lu, X., et al. (2023). 1D gradient-weighted class activation mapping, visualizing decision process of convolutional neural network-based models in spectroscopy analysis. Analytical Chemistry, 95(26): 9959-9966. https://doi.org/10.1021/acs.analchem.3c01101
[39] Liang, J. (2022). Confusion matrix: Machine learning. POGIL Activity Clearinghouse, 3(4). https://doi.org/10.1007/s11042-022-13847-3
[40] Heydarian, M., Doyle, T.E., Samavi, R. (2022). MLCM: Multi-label confusion matrix. IEEE Access, 10: 19083-19095. https://doi.org/10.1109/ACCESS.2022.3151048
[41] Ferrer, L. (2022). Analysis and comparison of classification metrics. arXiv Prepr arXiv220905355. https://doi.org/10.48550/arXiv.2209.05355
[42] Vujović, Ž. (2021). Classification model evaluation metrics. International Journal of Advanced Computer Science and Applications(IJACSA), 12(6): 599-606. https://doi.org/10.14569/IJACSA.2021.0120670
[43] Fanconi, C. (2019). Skin Cancer: Malignant vs. Benign. https://www.kaggle.com/datasets/fanconic/skin-cancer-malignant-vs-benign, accessed on June 21, 2025.
[44] Pathak, S., Mani, A., Sharma, M., Chatterjee, A. (2024). Quantum inspired chaotic Salp Swarm Optimization for dynamic optimization. arXiv preprint arXiv:2402.16863. https://doi.org/10.48550/arXiv.2402.16863
[45] Pérez, E., Ventura, S. (2022). An ensemble-based convolutional neural network model powered by a genetic algorithm for melanoma diagnosis. Neural Computing and Applications, 34(13): 10429-10448. https://doi.org/10.1007/s00521-021-06655-7