Mustapha Ezzini*![]() | Raja Mouachi
| Raja Mouachi![]() | Abdelali El Gourari
| Abdelali El Gourari![]() | Mohemmed Boukendil
| Mohemmed Boukendil![]() | Mustapha Raoufi
| Mustapha Raoufi![]()
© 2025 The authors. This article is published by IIETA and is licensed under the CC BY 4.0 license (http://creativecommons.org/licenses/by/4.0/).
OPEN ACCESS
The temperature forecast of photovoltaic (PV) panels plays a major role in optimizing their performance and efficiency, particularly in hot regions like Marrakech, where accurate predictions can enhance energy production management and reduce kWh costs. This study evaluates the reliability of artificial neural networks (ANN) and long short-term memory networks (LSTM) for modeling PV panel temperature profiles, providing critical insights before system installation. Using root mean square error (RMSE) and coefficient of determination (R²) as key metrics, we compare the predictive performance of both models. The ANN model demonstrates marginally better accuracy in temperature prediction, with a training RMSE of 1.7231℃ (R² = 0.974) and a test RMSE of 1.952℃ (R² = 0.970). In contrast, the LSTM model shows slightly higher training and test RMSE values (1.8908℃ and 1.959℃, respectively) but maintains competitive R² scores (0.970 and 0.969). While ANN exhibits a slight edge in RMSE, LSTM demonstrates greater stability in test loss over time, suggesting that its performance may be more robust in certain operational contexts. The minimal difference in R² values (0.970 vs. 0.969) further indicates near-identical predictive capability between the two models. The choice of RMSE over mean absolute error (MAE) is justified by its sensitivity to larger deviations, which is critical for identifying extreme temperature fluctuations that could impact PV efficiency. Overall, both models generalize effectively, with ANN providing marginally better precision in our case study, while LSTM offers potential advantages in long-term stability. These findings highlight the importance of model selection based on specific operational requirements, whether prioritizing immediate prediction accuracy or long-term consistency in PV temperature forecasting.
photovoltaic, temperature prediction, artificial neural networks (ANN), long short-term memory (LSTM), energy performance, PV system efficiency
The photovoltaic (PV) performance modules is one of the most used solutions in solar systems that have high potential, but this technology is strongly affected by the increase in temperature. The very high temperature of the photovoltaic panel can make an important reduction which can be up to 7% of its maximum electricity production [1]. This loss of energy, known as the temperature coefficient which is always negative for the power and voltage of photovoltaic panels depending on the type of technology [2]. Especially in warm and sunny regions such as Morocco on the whole South and South-East Marrakech as a case study, knowing the temperature of PV modules becomes the most important element to obtain maximum performance. the chilling of photovoltaic technologies poses several problems on internal components of panels and is a major defect for PV installations in hot climates thus reducing their service life [3]. It is therefore very important to accurately predict the temperature of photovoltaic modules in order to improve their energy production and increase their service life. Renewable energy, particularly solar photovoltaic energy, plays a key role in reducing greenhouse gas emissions, the main cause of climate change to achieve the objective of reducing the earth’s temperature [4].
The temperature forecast of photovoltaic modules is necessary to improve their energy efficiency and ensure stable production [5]. By using advanced artificial intelligence modules, we will be able to develop more efficient and effective methods for temperature prediction in photovoltaic systems, improving their performance and making the conditions very comfortable to achieve maximum yield and maximize their service life. This work focuses on the introduction of artificial intelligence to predict the temperature of polycrystalline photovoltaic modules in Marrakech, a technology that produces more than other technologies in this climate, with the aim of limiting PV overheating, Improve the efficiency and production of photovoltaic solar energy. Classical physical models are very important for determining and optimizing the temperatures of solar panels, which is fundamental to maximizing efficiency and maintaining the right temperature for photovoltaic panels.
The models use equations based on heat transfer principles and photovoltaic module datasheet characteristics. They take into consideration variables such as solar irradiation, ambient temperature, wind speed and module-specific parameters such as STC efficiency and maximum power temperature factors. These modeling tools help engineers and researchers to properly design cooling system [6].
Table 1 shows the physical methods.
Table 1. Correlation for predict temperature of PV modelsW
|
Ref. |
Correlation |
|
[7] |
Tpv=Ta+0.031G |
|
[8] |
Tpv=Ta+ $\frac{G}{800}$ (TNOCT-20) |
|
[9] |
Tpv=Tref+0.0126(G-200)+1.03(Ta-Ta, NOCT) |
|
[10] |
Tpv=0.937Ta+0.0195G-1.528Ws+0.3529 |
|
[11] |
TPV=0.968Ta+0.02G-1.007 |
where,
Physical methods used to predict the temperature of photovoltaic modules often do not provide accurate results due to their dependence on simplified assumptions and limited consideration of complex environmental interactions [12]. These precautionary principles are based on fixed coefficients, variations in weather conditions and linear relationships with these parameters that do not give a clear picture of the complex, non-linear nature of temperature variations in photovoltaic panels, particularly in hot and variable climates [2, 7]. Advanced techniques, on the other hand, can analyze large amounts of data to identify more complex patterns and relationships, resulting in more accurate and reliable temperature forecasts. Applying these advanced techniques to predict the temperature of photovoltaic systems increases accuracy, reduces the risk of overheating and improves the efficiency and durability of photovoltaic systems. Physical models, although fundamental to determine the temperature of photovoltaic modules have important limitations. They are based on fixed coefficients and linear relations, which do not take into account the non-linear nature of temperature variations [13]. This limits their validity, especially in difficult environments such as Marrakesh, where climatic conditions change rapidly. Artificial intelligence-based models, such as ANN and LSTM, allow for more detailed analysis and greater accuracy through their ability to process large amounts of data and model complex relationships. This study focuses on the application of machine learning models, in particular ANN and LSTM, to predict the temperature of photovoltaic modules. The model demonstrated robust performance, reinforced by evaluation metrics such as RMSE and R².
As part of a “propre.ma” [8] project to study the performance of three photovoltaic technologies—Monocrystalline, Polycrystalline and Amorphous—in different climatic regions of Morocco, we are focusing in particular on the city of Marrakech. For each technology, a 2-kWp installation has been set up to provide accurate and reliable comparative data.
Photovoltaic panel performs in the specific climatic conditions of Marrakech, known for its intense sunshine and temperature variations. Local weather data, together with temperature measurements of polycrystalline panels, will be used to assess the energy performance and efficiency of these technologies. Specifically, our work aims to predict the temperature of polycrystalline panels as a function of weather conditions. Table 2 represents the datasheet of polycrystalline panels [9].
Table 2. Module specifications for p:Si (P)
|
Modules |
p:Si (P) |
|
Module nominal power (W) |
255 |
|
Module nominal open circuit voltage (V) |
38.0 |
|
Module nominal short circuit current (A) |
8.88 |
|
Temperature coefficient short circuit current (%per K) |
0.051 |
|
Temperature coefficient of power (%per K) |
-0.410 |
|
Temperature coefficient open circuit voltage (%per K) |
-0.310 |
|
Normal operating cell temperature (℃) |
46 |
|
Number of cells |
60 |
2.1 Visualization of meteorological parameters and panel temperature
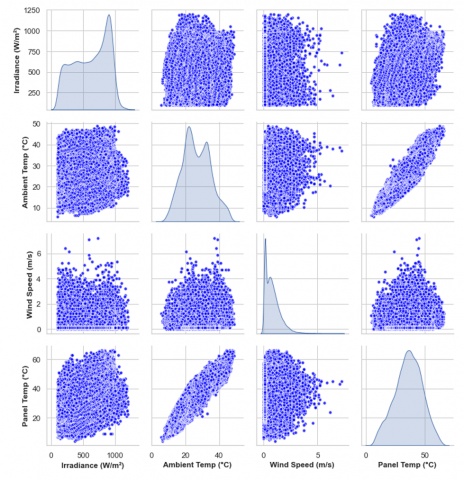
Figure 1 visualization provides an in-depth understanding of the complex interactions between solar irradiation, wind speed, ambient temperature and photovoltaic panel temperature. Dispersion diagrams and histograms clearly show that irradiation has a significant positive correlation with the panel temperature, highlighting the direct impact of solar energy on the panel heating. In addition, the marked linear relationship between room temperature and panel temperature suggests that variations in room temperature directly influence the panel temperature. This means that there is a very strong relationship between irradiation and panel temperature, as illustrated by the correlations in Table 1 [14].
Figure 1. Visualization of meteorological parameters and panel temperature
Figure 2. Temperature of photovoltaic (PV) panels
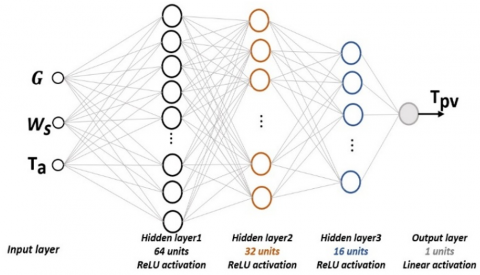
Figure 3. ANN architecture
Figure 4. LSTM architecture
The target variable represented in Figure 2 the temperature of photovoltaic (PV) panels, measured in degrees Celsius (℃). It is derived from time-series data spanning multiple days, with timestamps at regular intervals five minute. The values exhibit diurnal and seasonal fluctuations, influenced by solar irradiance, ambient temperature, and panel material properties [15].
The artificial neural network (ANN) is a basic type of machine learning model designed to process data by passing it through several layers of neurons. In the ANN model illustrated in Figure 3, data passes through an input layer, followed by two hidden layers of 64, 32 and 16 neurons. The ANN model excels at capturing direct relationships between features, making it a good choice for static data prediction tasks, such as temperature prediction in photovoltaic systems. In contrast, the LSTM (Long Short-Term Memory) network is specifically designed to process sequential type data, making it perfectly suited for time series forecasting. In the LSTM model, the structure is made up of memory cells, which include doors - inlets, forgets and exits - that regulate the flow of information. The LSTM model (Figure 4) illustrates data processing from multiple time steps, where each LSTM unit processes sequential inputs, making it very effective for capturing models over time, as the temperature variations in photovoltaic panels [16].
2.2 Evaluation metrics
To evaluate the performance of a prediction model, several criteria are used, including the coefficient of determination (R2), the mean quadratic error (MSE) (Eq. (1)) and the mean absolute error (MAE) (Eq. (2)). The determination coefficient (R2) (Eq. (3)) measures the variability of the model-explained dependent variable compared to the variability of the independent variables [17]. The RMSE quantifies the dispersion of predictions around actual temperature values of PV. The MAE indicates the moderate error between temperature that predict and test data of our models, which gives a local indication for each model prediction [18].
$R M S E=\sqrt{\frac{1}{n} \sum_{k=1}^n(T p-T m)^2}$ (1)
$M A E=\frac{1}{n} \sum_{k=1}^n|T p-T m|$ (2)
$R^2=1-\frac{\sum_{k=1}^n(T p-T m)^2}{\sum_{k=1}^n(T p-T a v)^2}$ (3)
where,
It is necessary to predict the temperature of photovoltaic (PV) panels in order to optimize their performance and efficiency. Accurate temperature forecasts allow for appropriate management of energy production, which has an impact on overall energy efficiency and the overall KWh costs of energy. This study evaluates the effect of different learning models in Marrakesh for polycrystalline technology and predict temperature variations, assess their impact and discuss their potential implications for improving the performance of photovoltaic panels [19].
3.1 Metrics of model evaluation in test and training
ANN and LSTM, for temperature prediction. For the ANN, the performance indicators are an RMSE of 1.7231, a MAE of 1.31 and an R2 of 0.974, which are acceptable and noted values, although temperature varies greatly every 5 min. In addition, the LSTM shows slightly higher values, with an RMSE of 1.8908, a MAE of 1.47 and an R2 of 0.970 less pronounced than ANN. These figures show that ANN tends to predict PV temperature better than LSTM in this case of marrekesh. Therefore, the convergence between training and test set results indicates that the models are well trained in Table 3 and can generalize effectively, providing accurate and reliable predictions for the new value. Comparison obtained in Figure 5 shows the differences between the performance of ANN and LSTM (“This work”) models and that of Decision Trees, Random Forest and Gradient Boost (“Published work”) [1] based on three parameters: R2, RMSE and MAE. While Gradient Boost has the highest R2 (0.982) and the lowest RMSE (1.925) and MAE (1.340), indicating better predictive accuracy, its slight advantage in terms of R2 can however come at the expense of over-adjustment. ANN (R2: 0.970, RMSE: 1.952, MAE: 1.46) and LSTM (R 2: 0.969, RMSE: 1.959, MAE: 1.48) of “This work” have comparable performances, in particular in terms of RMSE and MAE, Significantly surpassing the decision trees and the Random Forest that follows them very closely.
Table 2. Performance metrics for ANN and LSTM models
|
model |
Training |
Test |
||||
|
RMSE |
MAE |
R² |
RMSE |
MAE |
R² |
|
|
ANN |
1.7231 |
1.31 |
0.974 |
1.952 |
1.46 |
0.970 |
|
LSTM |
1.8908 |
1.47 |
0.97 |
1.959 |
1.48 |
0.969 |
Figure 5. Comparison of machine learning models for PV panel temperature prediction: current work and published
This indicates that while the tree-based models excel somewhat in explaining variance, the ANN and LSTM show stable results for all metrics, demonstrating their ability to perform predictive tasks with potential benefits in the manipulation of complex relationships between different data. The results of this study have important practical implications for photovoltaic (PV) systems in real situations. The integration of prediction models such as ANN and LSTM in the management of photovoltaic systems can improve operational efficiency by better anticipating temperature changes [20].
3.2 Loss function
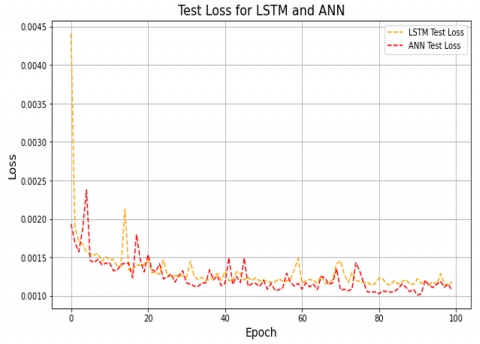
Figures 6 and 7 show a comparative analysis of the learning loss of long-short-term memory (LSTM) and artificial neural networks (ANN). Both models show a rapid decrease in initial learning loss, indicating rapid learning, with the LSTM model showing a steeper decrease at the beginning of the period during which learning takes place. As learning progresses, both models see their learning loss curves flatten out, suggesting that MSE is minimal. At the end of the 100-epoch training period, both models experience a minimal drop in learning, but the ANN model grows faster and achieves a slightly lower final loss. This indicates that while both models do learn from training data, the ANN model demonstrates slightly slightly higher performance in minimizing training errors for this specific task. The test loss curves for the LSTM and ANN models are over 100 test periods. The dashed curves represent the test loss for each model, with the yellow curve for the LSTM and the red curve for the ANN. The visualization shows that the test loss for the ANN is generally greater than that of the LSTM. In addition, the loss of LSTM varies little and stabilizes in a very low loss range, indicating better performance and greater stability of the LSTM model compared to the ANN.
Figure 6. The evolution of training loss function for LSTM and ANN models
Figure 7. The evolution of testing loss function for LSTM and ANN models
3.3 Comparison between observed and predicted values
Figures 8 and 9 display a point cloud for both the ANN and LSTM models, comparing measured values to predicted values. The ANN model demonstrates a very high precision in representing the temperature of photovoltaic panels. However, some points deviate from the perfect prediction line, corresponding to peaks in the loss function. Similarly, the LSTM model is represented by orange dots, each indicating a pair of measured and predicted values. The dashed black line represents the ideal scenario where measured and predicted values are identical, and ANN models signifying perfect prediction. The proximity of most points to this line indicates strong model performance and high precision, which aligns with the high coefficient of determination (R²) for both models.
Figure 8. Scatter plot of the measured and predicted PV temperature for ANN models
Figure 9. Scatter plot of the measured and predicted PV temperature for LSTM models
Figure 10. Representation of 200 samples of predicted and measured temperature
Figure 10 compares measured temperature values with the predictions of the LSTM and ANN models. Both models show good overall accuracy, following the trends of the measured values with a few visible deviations. The predictions of both models are often close to the actual values, although errors persist. In comparison, the LSTM and ANN models perform similarly, but it can happen that one is more accurate than the other. Improvements can be made to reduce deviations and increase prediction accuracy. But from a general point of view, ANN is a more accurate module with a large deference and an LSTM face.
Based on the training and test results of the ANN and LSTM models for predicting the temperature of photovoltaic panels, both models demonstrate strong predictive capabilities, with the ANN achieving an RMSE of 1.952, an MAE of 1.46, and an R² of 0.970, and the LSTM achieving an RMSE of 1.959, an MAE of 1.48, and an R² of 0.969. These results highlight the possibility for models to determine temperature variations and manage temporal differences between PV panel temperature data. Although the LSTM model displays slightly higher error measures than the ANN, both models produce reliable forecasts, providing flexibility of application based on operating conditions and data characteristics. Continuous optimization and refinement of model parameters and data preprocessing techniques can further improve predictive accuracy and applicability in real-world PV management scenarios. These results highlight the potential role of machine learning models in transforming the PV industry by enabling predictive maintenance, optimizing system performance and improving energy performance. Good temperature modelling can mitigate efficiency losses, contribute to the design of efficient air conditioning systems and promote the integration of photovoltaic technologies in different climates, Promoting both operational efficiency and the global trend towards renewable energy.
[1] Abdelhak, K., Razika, I., Ali, B., Abdelmalek, A.F., Müslüm, A., Lebbihiat, N., Nabila, I. (2024). Photovoltaic module temperature prediction using various machine learning algorithms: Performance evaluation. Applied Energy, 363: 123064. https://doi.org/10.1016/j.apenergy.2024.123064
[2] Tercha, W., Zahraoui, Y., Mekhilef, S., Korõtko, T., Rosin, A. (2025). A hybrid model ANN-LSTM architecture for PV power forecasting: A review and implementation. In Technological and Innovative Progress in Renewable Energy Systems, Springer, Cham, pp. 43-47. https://doi.org/10.1007/978-3-031-71926-4_7
[3] Bouakkaz, A., Lahsasna, A., Mena, A.J.G., Haddad, S., Ferrari, M.L., Jiménez-Castaneda, R. (2025). Evaluating and analyzing the performance of PV power output forecasting using different models of machine-learning techniques considering prediction accuracy. International Journal of Renewable Energy Development, 14(1): 158-167. https://doi.org/10.61435/IJRED.2025.60547
[4] Faiman, D. (2008). Assessing the outdoor operating temperature of photovoltaic modules. Progress in Photovoltaics: Research and Applications, 16(4): 307-315. https://doi.org/10.1002/pip.813
[5] Aly, S.P., Ahzi, S., Barth, N., Abdallah, A. (2018). Using energy balance method to study the thermal behavior of PV panels under time-varying field conditions. Energy Conversion and Management, 175: 246-262. https://doi.org/10.1016/j.enconman.2018.09.007
[6] Dolara, A., Leva, S. (2015). Comparison of different physical models for PV power output prediction. Solar Energy, 119: 83-99. https://doi.org/10.1016/j.solener.2015.06.017
[7] Ross, R.G.J. (1976). Interface design considerations for terrestrial solar cell modules. In Photovoltaic Specialists Conference, 12th, Baton Rouge, New York, pp. 801-806.
[8] National Renewable Energy Laboratory (NREL). (2024). https://www.nrel.gov/.
[9] Akhsassi, M., Fath, A.E., Erraissi, N., Aarich, N., Bennouna, A., Raoufi, M., Outzourhit, A. (2018). Experimental investigation and modeling of the thermal behavior of a solar PV module. Solar Energy Materials and Solar Cells, 180: 271-279. https://doi.org/10.1016/j.solmat.2017.06.052
[10] Muzathik, A.M. (2014). Photovoltaic Modules Operating Temperature. International Journal of Energy Engineering, 4(4): 151-158.
[11] Bailek, N., Bouchouicha, K., Hassan, M.A., Slimani, A., Jamil, B. (2020). Implicit regression-based correlations to predict the back temperature of PV modules in the arid region of south Algeria. Renewable Energy, 156: 57-67.
[12] Aarich, N., Raoufi, M., Bennouna, A., Erraissi, N. (2018). Outdoor comparison of rooftop grid-connected photovoltaic technologies in Marrakech (Morocco). Energy and Buildings, 173: 138-149. https://doi.org/10.1016/j.renene.2020.04.073
[13] Kaplanis, S., Kaplani, E., Kaldellis, J. K. (2023). PV temperature prediction incorporating the effect of humidity and cooling due to seawater flow and evaporation on modules simulating floating PV conditions. Energies, 16(12): 4756. https://doi.org/10.3390/en16124756
[14] Khala, M., El Yanboiy, N., Elabbassi, I., Eloutassi, O., Halimi, M., El Hassouani, Y., Messaoudi, C. (2025). Enhancing machine learning model for early warning in PV plants: Air temperature prediction informed by power temperature coefficient. The Journal of Supercomputing, 81(2): 394. https://doi.org/10.1007/s11227-024-06909-w
[15] Mouachi, R., Jallal, M.A., Gharnati, F., Raoufi, M. (2020). Multiobjective sizing of an autonomous hybrid microgrid using a multimodal delayed PSO algorithm: A case study of a fishing village. Computational Intelligence and Neuroscience, 2020(1): 8894094. https://doi.org/10.1155/2020/8894094
[16] El Gourari, A., Raoufi, M., Skouri, M., Braim, A.A.B., Ezzini, M., Ait Lahcen, Y., Achki, S. (2024). The Positive Impact of Artificial Intelligence on Education. In 2024 International Conference on Global Aeronautical Engineering and Satellite Technology (GAST), Marrakesh, Morocco, pp. 1-6. https://doi.org/10.1109/GAST60528.2024.10520786
[17] Ennejjar, M., Ezzini, M., Chabaa, S., Zeroual, A. (2024). Multi-seasonal modeling of energy consumption in a building: Integration of sub-models with switching. In 2024 International Conference on Decision Aid Sciences and Applications (DASA), Manama, Bahrain, pp. 1-5. https://doi.org/10.1109/DASA63652.2024.10836509
[18] Ezzini, M., Mouachi, R., Ennejjar, M., El Gourari, A., Boukendil, M., Raoufi, M. (2024). Comparative analysis of monocrystalline and polycrystalline photovoltaic performance in arid climates using random forest for missing data completion. In 2024 International Conference on Decision Aid Sciences and Applications (DASA), Manama, Bahrain, pp. 1-5. https://doi.org/10.1109/DASA63652.2024.10836307
[19] Razika, I., Mohamed, E.h.J., Nabila, I., Amaury, D.S. (2022). Analytical assessment of Ain Skhouna PV plant performance connected to the grid under a semi-arid climate in Algeria. Solar Energy, 363: 52-62. https://doi.org/10.1016/j.solener.2021.12.055
[20] Ennejjar, M., Ezzini, M., Jallal, M. A., Chabaa, S., Zeroual, A. (2025). A hybrid PCA-LSTM predictive approach for enhancing multi-step indoor temperature prediction towards energy-efficient HVAC control. Physica Scripta, 100(5): 055227. https://doi.org/10.1088/1402-4896/adcc67