Muhammad Ahlan![]() | Sigit Priyanto*
| Sigit Priyanto*![]() | Suryo Hapsoro Tri Utomo
| Suryo Hapsoro Tri Utomo
© 2024 The authors. This article is published by IIETA and is licensed under the CC BY 4.0 license (http://creativecommons.org/licenses/by/4.0/).
OPEN ACCESS
The cost of maritime intermodal freight transport is competitive against that of road transport on long corridors. The length of the major corridor in Java Island is medium. The land distance of the transport corridor in the island is relatively equal to the maritime distance. The objective of this research is to compare the cost of freight transport using maritime intermodal transport with the one using road transport in Java Island. The commodities, origin, destination, and potential freight flow are decided based on the secondary data analysis and the field surveys. The transport costs are estimated using secondary and survey data. The maritime intermodal transport is competitive on the time and distance related costs, while the road mode transport is competitive on the node charges and the first and last mile costs. There is a relatively close cost difference between the maritime intermodal transport and the road transport on the corridor of which the origin is close to the port. Hence, maritime intermodal transport may compete with road transport in the medium long corridor provided that the land and the maritime distances are relatively equal and the origin and the destination are close to ports.
freight, intermodal, maritime, road, sea, transport
Road mode dominance in freight transport causes environmental, safety, and economic problems; therefore, multimodal freight transport is being encouraged [1, 2]. The cost of transporting freight using multimodal transport should be lower than the cost of road mode freight transport so that businesses want to carry freight via multimodal transport [3]. The cost analysis of freight transport using multimodal transport, such as maritime intermodal transport, needs to be conducted to determine the potential and weaknesses of the maritime intermodal freight transport to compete with the road transport.
Several studies have been conducted to compare the cost of freight transport using maritime multimodal or intermodal transport with that using road transport. Most of these studies discovered that the ability of maritime multimodal or intermodal transport to compete with road transport is partly determined by geography such as close distance to the coast and population density.
Ng [4] compared the freight transport cost of the maritime multimodal transport to the road haulage in northern Europe. The cost consists of monetary and time components. There were differences of 3.5% to 31.3% to be made by using the maritime multimodal transport for the service areas having close distance to the coast and access to multimodal transport networks. The study also discovered that the potential of the ports to execute maritime multimodal freight transport is partly decided by geography.
The study discovered that ports need to have several characteristics to be able to compete with the road mode in transporting freight via maritime multimodal transport. First, the port should lie in an area with a large population. Second, the port should have no strong adjacent port rivals. Third, the port should have commodities with high value in the surrounding areas. Fourth, the port should have high access to the multimodal transport routes [4].
The study also discovered that the ability of ports to compete with road mode in transporting freight is also influenced by the effectiveness of the cargo-handling process at the port. The effectiveness of the cargo-handling process can be increased through developing port infrastructure and facilities. The study also suggested that the development be applied only to areas that are competitive in running freight transport through the maritime multimodal transport, rather than developing the entire continent in addressing the road mode dominance in freight transport [4].
Morales-Fusco et al. [5] compared the freight transport costs of the maritime multimodal transport to the road haulage in the Spain-Italy corridor. The calculated cost was the monetary cost. The origin and destination points in this corridor could be reached in 450 miles by the maritime multimodal transport or 792 miles by the road transport. There were differences of around 46% to 57% to be made by using the maritime multimodal transport. The geographical advantages make the freight transport cost by maritime multimodal transport lower than by road mode [5].
Galati et al. [6] compared the maritime multimodal freight transport cost to the road haulage in the Spain-Italy corridor. They calculated the monetary cost. The maritime distance between the origin and destination was shorter than that of the land distance. There were differences of at least 30% to be made by using maritime multimodal transport. The study calculated the cost on the basis that the different modes of transport were fully integrated, flexible, and reliable [6].
Several researchers included external cost factors in transport costs. They compared the monetary and external costs of the maritime multimodal freight transport with those of the road mode in the Mediterranean territory [7-9]. Other studies also conducted monetary and external cost analyses of the maritime multimodal and the road mode freight transport in Europe and South Korea. They noted that the maritime multimodal freight transport cost is more competitive than the road haulage [10, 11].
The cost of freight transport using maritime transport could be reduced by making a more effective supply chain. The procurement of warehouses can make the transport of goods from land to sea modes more efficient [12].
Regarding the freight transport process, the maritime intermodal transport connects other modes, such as the road mode to the sea mode. The more integrated the maritime intermodal transport, the more efficient the transport cost [1, 13-15]. The broad network of maritime intermodal transport also could increase the freight volume [16, 17].
Regarding the commodities suitability, the maritime intermodal transport usually transports almost all types of commodities, such as oil, crude palm oil, agriculture products, and building materials [18-21]. Maritime intermodal transport can haul the vegetables as well by using a certain procedure [21].
Concerning the maritime mode fleets, there are at least two types of maritime fleets that are commonly used in freight transport: lift-on-lift-off (LoLo) ships and roll-on-roll-off (RoRo) ships. The LoLo ships only load containers without the tractors, whereas the RoRo ships can load both the tractors/ trucks and their trailer/ semitrailer/ cargo or the trailer/ semitrailer only [12, 22, 23].
Java Island, located in Indonesia, is the 13th largest island in the world. This island has long coastlines [24]. The island of Java has the highest population density among the 13 largest islands in the world [25, 26]. As a result, the island of Java has geographical characteristics that could support maritime transport.
The island of Java is the source of agricultural products such as rice and vegetables, building materials, and other type of products [27-32]. This island is also one of the largest markets in Southeast Asia [33]. As a result, the island of Java has economic advantages that could support maritime transport. Studying intermodal freight transport in Java Island is particularly important to enhance the green logistics practices serving the 151.6 million population on this island. In addition, studying maritime intermodal freight transport in Java Island is interesting because of the unique geographical features of the island.
Besides the previously mentioned advantages of the island of Java, the island also has an extensive intermodal transport network. The island of Java has several main freight ports and extensive road toll networks, all of which could support maritime intermodal transport on this island [34, 35].
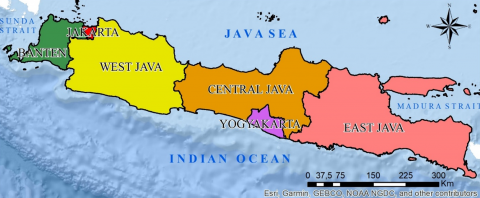
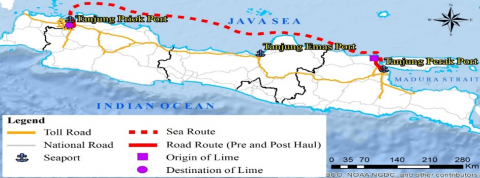
Despite the aforementioned potential advantages of Java Island that could support maritime intermodal transport, the portion of freight transport by sea mode is only 0.2% [36]. This phenomenon may be because most of the road mode users in the main corridor of Java Island believe that road mode is the cheapest alternative for freight transport [37]. The map of Java Island is shown in Figure 1.
Malisan et al. [38] analyzed the potential of Java Island to transport freight via maritime intermodal transport. The research used province-level freight transport data, showing aggregate freight flow between provinces, to calculate transport costs. Based on the research, the cost of freight transport by the maritime intermodal transport in the island of Java is lower than the one by the road transport [38].
The ability of the maritime intermodal freight transport in Java Island to compete with the road transport needs to be researched further in more detail. Research on this topic is very limited. This article uniquely compares the cost of freight transport using the maritime intermodal transport with the one using the road mode between specific points of origin and destination in the island of Java.
Figure 1. Map of provinces in Java Island
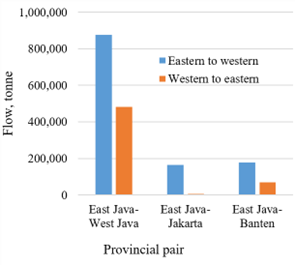
This paper researched the transport of rice, as the largest volume of freight transported from the eastern part to the western part of Java Island, and lime. Figure 2 shows the flow of rice between strategic and long corridors in the island of Java in 2016 [39]. Based on Figure 2, the rice flows were as follows: 875,940 tonnes from East Java to West Java; 481,582 tonnes from West Java to East Java; 178,519 tonnes from East Java to Banten; 164,914 tonnes from East Java to Jakarta, 68,248 tonnes from Banten to East Java, and 135 tonnes from Jakarta to East Java. In general, there were 1,219,373 tonnes of rice sent from eastern Java to western Java and 549,965 tonnes of rice sent from the opposite direction annually.
Figure 2. Flow of rice commodities in the long-distance corridors in Java Island, 2016
Several studies have compared the freight transport costs of the maritime mode with those of the road mode. The summaries of the previous studies are shown in Table 1. Based on the study, the comparison between maritime distance and land distance, the distance between the destination and the port, and the cost difference between road and maritime mode are added.
Galati et al. [6] analyzed maritime intermodal transport cost competitiveness against road mode transport cost in several corridors in Europe. For most corridors, the maritime distances were relatively equal to the land distances. The corridor had a maritime distance that was longer than the land distance. The land distances of the corridors ranged from 1,647 to 2,344 km. Three corridors had destinations that were close to the ports, while the destinations of the others were far from the ports. All origins of the corridors were far from the ports. The transport cost differences between road mode and maritime mode ranged from 12.3% to 32.8%, which means that the road mode costs were higher than the maritime mode costs.
Lee et al. [40] analyzed the maritime intermodal competitiveness in a corridor in Taiwan. The maritime distance was relatively equal to the land distance. The land distance was 372.8 km. The origin and destination of the corridor were close to the ports. The difference between the road mode transport cost and that of the maritime mode was -19.2%, which means that the road mode cost was lower than the maritime mode cost.
The study found that the differences between road mode costs and maritime mode costs become higher with the distance between origin and destination. This means that the maritime mode became more competitive when it served the long corridor. According to the researcher, the infrastructures and facilities of the ports should be upgraded to reach the optimal maritime mode performance [6].
Table 1. Summaries of the previous studies
|
Corridor |
Geographical Characteristics |
Difference Between Road and Maritime Mode* |
Reference |
|
Jaén-Rome |
MD ≈ LD LD = 2,152 km Destination close to the port |
24% |
[6] |
|
Jaén-Milan |
MD ≈ LD LD = 1,769 km Destination far from the port |
19.4% |
[6] |
|
Jaén-Naples |
MD > LD LD = 2,344 km Destination close to the port |
32.8% |
[6] |
|
Jaén-Turin |
MD ≈ LD LD = 1,656 km Destination far from the port |
12.3% |
[6] |
|
Jaén-Genoa |
MD ≈ LD LD = 1,647 km Destination close to the port |
23.5% |
[6] |
|
Keelung-Kaohsiung |
MD ≈ LD LD = 372.8 km Destination close to the port |
-19.2% |
[40] |
Notes: 1. *Difference was calculated using Eq. (4); 2. MD = maritime distance, LD = land distance.
There were several steps to estimate the freight transport costs in the island of Java. First, the road routes and the ports in the island of Java were identified. Second, the freight origin, freight destination, and potential flow were identified through secondary data analysis and field survey. Third, the transport costs were estimated using secondary data, field survey data, and previous study data.
Firstly, the data on the road routes and the ports in the island of Java was obtained from government sources [41-43]. Secondly, freight origin, freight destination, and potential freight flow were identified through secondary data analysis and field survey. In this research, the direction of transport flow is focused on the flow from eastern Java to western Java.
The commodity types studied in this research were selected based on the Ministry of Transport’s survey data [39] and field survey. Rice and lime were selected as the commodities studied in this research because these commodities are transported over long distances and in relatively large quantities in Java Island.
The origin and destination locations were discovered through secondary data analysis [44] and field surveys. The secondary data analysis provided the possibilities of the freight origins and destinations. The field survey confirmed the detailed freight origins and destinations.
The potential flow of the commodities was discovered through secondary data analysis [44] and field survey. The secondary data showed the rice production capacity of the regencies and the factories. On the other hand, the lime flow was obtained directly from a field survey.
Third, the transport costs were estimated. The road-mode cost formula was modified from the previous study [45]. The sea-mode cost was estimated based on the government regulation [46].
3.1 Cost analysis
3.1.1 Framework for cost analysis
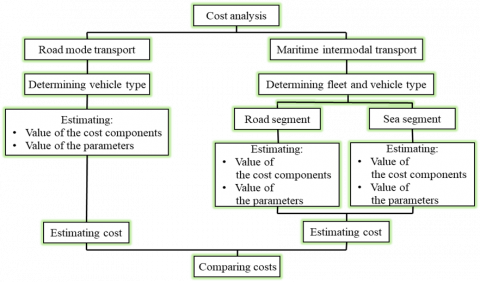
The framework for cost analysis is shown in Figure 3. First, the vehicle types for road and the maritime intermodal transport are selected, respectively. Second, the values of the cost components are estimated. Third, the values of the parameters are estimated. Fourth, the transport costs of both road mode and maritime intermodal transport are estimated. Fifth, the road mode transport cost is compared with the maritime intermodal transport cost.
Figure 3. Framework for cost analysis
3.1.2 Equation to estimate the transport cost
The road mode transport cost was calculated using the following Eq. (1):
$C_r=T C_r \times T_r+D C_r \times D_r+F C_r$ (1)
where,
Cr = transport cost of road mode (IDR)
TCr = time-related unit cost of road mode (IDR/hour)
Tr = transport time of road mode (hour)
DCr = distance-related unit cost of road mode (IDR/km)
Dr = transport distance of road mode (km)
FCr = fixed cost of road mode (IDR)
Time-related costs consist of driver employment cost, vehicle depreciation, licenses, vehicle insurance, and ownership of a trailer or an extra trailer. Distance-related costs consist of fuel and vehicle maintenance. Fixed cost consists of toll road cost.
The maritime intermodal transport consists of road and sea segments. The maritime intermodal transport cost was estimated using the following Eq. (2):
$C_i=C_{r s}+C_{s s}$ (2)
where,
Ci = transport cost of maritime intermodal transport (IDR)
Crs = transport cost of road segment of maritime intermodal (IDR)
Css = transport cost of sea segment of maritime intermodal (IDR)
The transport cost of the road segment was calculated using Eq. (1). The sea segment transport cost was calculated using the following Eq. (3):
$\begin{gathered}C_{s s}=T T C_{s s} \times T T_{s s}+T D T C_{s s} \times T D T_{s s}+C O(C T L \left.+T D T_{s s}\right)+O C_{s s}+F C_{s s}\end{gathered}$ (3)
where,
Css = transport cost of sea mode (IDR)
TTCss = unit cost of trip time of sea mode (IDR/hour)
TTss = trip time of sea mode (hour)
TDTCss = unit cost of trip and docking time of sea mode (IDR/hour)
TDTss = trip and docking time of sea mode (hour)
CO = container ownership unit cost (IDR/hour)
CTL = container usage time in land (hour)
OCss = overhead cost of sea mode (IDR)
FCss = fixed cost of sea mode (IDR)
The unit cost of docking and trip time consists of expenses for the ship captain and crew, ship maintenance, ship insurance, cost of fumigation, ship depreciation, fuel and lubricant costs of the auxiliary machine. The unit cost of trip time consists of fuel and lubricant costs of the main machine. Fixed costs consist of port charges, marketing costs, and premium costs for the captain and crew.
3.1.3 Data sources
Regarding the road mode, the data on vehicle capital and maintenance costs was obtained from the vehicle dealer. The data on staff-related costs, trip length, trip duration, and the consumed fuel was obtained from the drivers. The data on overall transport costs were obtained from the transport service staff. Assumptions were made for a small portion of the calculation.
Regarding the maritime intermodal transport costs, the data on ship capital cost, trip length, and consumed fuel was obtained from the previous study [47, 48]. The data on ship maintenance and staff-related costs was obtained from government regulations [46]. Assumptions were made for a small portion of the calculations.
3.1.4 Analytical technique for estimating the costs
Concerning the vehicles utilized in road mode, the rice commodity was hauled by 4-axle double-trailer trucks. The lime commodity was hauled by 2-axle trucks. These types of trucks were selected based on the reality on the ground.
As for maritime intermodal transport, the container barge with a capacity of 500 FEU (forty-foot equivalent unit) was used for the sea mode. The container barge was selected based on previous studies [2, 38, 47]. The barge has a main engine capacity of 7,278 HP. As for the road segment, both rice and lime were transported by tractor-trailers hauling a 40 ft container. The vehicle was chosen because it fits the barge container.
3.2 Cost comparison methodology
3.2.1 Equation for cost comparison
The cost comparison was expressed in the form of the difference. The cost comparison method was adopted from [49]. The difference was calculated using the following Eq. (4):
$Difference (\%)=\frac{C_r-C_i}{C_r}$ (4)
where,
Cr = transport cost of road mode transport (IDR)
Ci = transport cost of intermodal transport (IDR)
3.2.2 Assumption of cost comparison
The price of the ship used in the study is based on the 2019’s price. The assumption is that the price of the ship would not change drastically in 2024.
The vehicle is assumed to be used optimally for 307 days a year and the ship to be used optimally for 344 days a year. Both the vehicle and the ship carry the optimal volume of freight on the return trip.
3.2.3 Analytical technique for comparing the costs
The total costs of transport using road mode transport are compared with the total cost of transport using maritime intermodal transport. Both costs are in IDR units.
Both transports originate from the same point and go to the same destination point. Both transports carry the same commodity.
4.1 Road and maritime infrastructure in Java Island
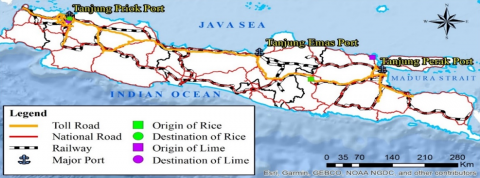
There are two main routes connecting eastern and western Java. The routes are the north coast route and the south coast route. The north coast route is the predominant route for freight transport in Java Island. The transport network in Java Island is shown in Figure 4.
4.2 Freight origin and destination
For the maritime intermodal route, initially, rice is hauled via truck from the origin to Tanjung Emas Port, then the rice is hauled via ship to Tanjung Priok Port, and finally, the rice is hauled via truck to the destination. This transport passes through toll roads as well.
The lime origin is in Gresik Regency, East Java and the lime destination is in the administrative city of Central Jakarta. For the road mode, lime is transported via the northern route of the island of Java. This transport does not pass through toll roads. This is because the 2-axle truck can maneuver nimbly on non-toll roads that do not require toll fees.
The condition of intermodal infrastructures, such as the capacity of the roads connecting the origins and the ports, influences the type of vehicles used to haul the freight. The previous study suggests the intermodal infrastructures linking the freight origins and the ports for the competitiveness of the ports [14, 15].
Regarding the potential rice flow, 121,000 tonnes of rice per year can potentially be sent from the origin to the destination. For lime flow, around 6,570 tonnes of lime are hauled from the origin to the destination annually. Figure 5 shows the maritime intermodal route for lime commodity in Java Island.
Figure 4. The origin and destination of the commodities
Figure 5. Maritime intermodal route for lime commodity
4.3 Transport costs
The cost of rice transport using road mode from Ngawi to East Jakarta is 5,404,578 IDR. The costs consist of fuel, vehicle maintenance, driver employment, vehicle depreciation, vehicle tax and insurance, and toll. The fuel cost is 2,433,429 IDR. The vehicle maintenance cost is 729,089 IDR. The driver employment cost is 363,669 IDR. The vehicle depreciation cost is 571,173 IDR. The vehicle tax and insurance are 180,219 IDR. The toll fee is 1,127,000 IDR.
The cost of lime transport using road mode from Gresik to Central Jakarta is 2,324,033 IDR. The fuel cost is 1,152,909 IDR. The vehicle maintenance cost is 140,151 IDR. The driver employment cost is 832,318 IDR. The vehicle depreciation cost is 137,898 IDR. The vehicle tax and insurance are 60,756 IDR.
The breakdown of road mode transport costs is shown in Table 2. The breakdown of maritime intermodal transport costs is shown in Tables 3 and 4.
Table 2. Breakdown of road mode transport costs
|
Commodity |
Element |
Cost (IDR) |
Total (IDR) |
|
Rice (Ngawi-East Jakarta, 501 km) |
Fuel |
2,433,429 |
5,404,578 |
|
Vehicle maintenance |
729,089 |
|
|
|
Driver employment |
363,669 |
|
|
|
Vehicle depreciation |
571,173 |
|
|
|
Vehicle tax and insurance |
180,219 |
|
|
|
Toll fee |
1,127,000 |
|
|
|
Lime (Gresik-Central Jakarta, 746 km) |
Fuel |
1,152,909 |
2,324,033 |
|
Vehicle maintenance |
140,151 |
|
|
|
Drivers employment |
832,318 |
|
|
|
Depreciation |
137,898 |
|
|
|
Vehicle tax and insurance |
60,756 |
|
|
|
Toll fee |
- |
|
The cost of rice transport from Ngawi to East Jakarta via maritime intermodal transport is as follows: 105,900,863 IDR for captain and crew expenses including premium cost, 109,097,475 IDR for ship maintenance, 39,846,975 IDR for ship insurance, 199,234,873 IDR for ship depreciation, 19,957,038 IDR for overhead, 76,018,060 IDR for container ownership, 825,192,489 for fuel and oil, 1,332,250,000 IDR for port charges, and 5,525,284 IDR for marketing cost. The costs are for 500 FEU per trip.
The road leg cost from origin to port is 2,233,612 per trip per 1 FEU. The road leg cost from port to destination is 310,696 per trip per 1 FEU.
The cost of lime transport from Gresik to Central Jakarta via maritime intermodal transport is as follows: 144,770,811 IDR for captain and crew expenses including premium cost, 164,120,549 IDR for ship maintenance, 59,943,710 IDR for ship insurance, 299,718,548 IDR for ship depreciation, 30,022,326 IDR for overhead, 107,183,568 IDR for container ownership, 1,241,376,527 for fuel and oil, 1,347,390,000 IDR for port charges, and 6,857,856 IDR for marketing cost. The costs are for 500 FEU per trip.
Table 3. Breakdown of maritime intermodal transport costs of rice commodity
|
Element |
Cost (IDR) |
Description |
|
Expenses for captain and crew, including premium cost |
105,900,863 |
500 FEU |
|
Fumigation cost |
313,408 |
500 FEU |
|
Ship maintenance |
109,097,475 |
500 FEU |
|
Ship insurance |
39,846,975 |
500 FEU |
|
Ship depreciation |
199,234,873 |
500 FEU |
|
Overhead |
19,957,038 |
500 FEU |
|
Container ownership |
76,018,060 |
500 FEU |
|
Fuel and oil |
825,192,489 |
500 FEU |
|
Port charges |
1,332,250,000 |
500 FEU |
|
Marketing cost |
5,525,284 |
500 FEU |
|
Origin to port (road leg) |
2,233,612 |
1 FEU |
|
Port to destination (road leg) |
310,696 |
1 FEU |
Table 4. Breakdown of maritime intermodal transport costs of lime commodity
|
Element |
Cost (IDR) |
Description |
|
Expenses for captain and crew, including premium cost |
144,770,811 |
500 FEU |
|
Fumigation cost |
471,475 |
500 FEU |
|
Ship maintenance |
164,120,549 |
500 FEU |
|
Ship insurance |
59,943,710 |
500 FEU |
|
Ship depreciation |
299,718,548 |
500 FEU |
|
Overhead |
30,022,326 |
500 FEU |
|
Container ownership |
107,183,568 |
500 FEU |
|
Fuel and oil |
1,241,376,527 |
500 FEU |
|
Port charges |
1,347,390,000 |
500 FEU |
|
Marketing cost |
6,857,856 |
500 FEU |
|
Origin to port (road leg) |
740,057 |
1 FEU |
|
Port to destination (road leg) |
398,666 |
1 FEU |
The road leg cost from origin to port is 740,057 per trip per 1 FEU. The road leg cost from port to destination is 398,666 per trip per 1 FEU.
The cost of rice transport using road mode from Ngawi to East Jakarta is 135,114 IDR per tonne, while the cost of that which uses maritime intermodal transport is 306,576 IDR per tonne. The road mode freight transport cost is lower by about 126.9 percent than the maritime intermodal transport for the Ngawi-East Jakarta corridor. The comparison between the road transport and the maritime intermodal transport is shown in Table 5.
In addition, the cost of lime transport using road mode from Gresik to Central Jakarta is 290,504 IDR per tonne, while the cost of that which uses maritime multimodal transport is 305,478 IDR per tonne. The road mode freight transport cost is lower by about 5.1 percent than the maritime intermodal transport for the Gresik-Central Jakarta corridor.
Transport distances by the maritime intermodal transport are not shorter than by road transport. This shows that the road transport is superior for the distance that is generally equal to or shorter than that of maritime intermodal transport.
Table 5. Transport cost comparison of different mode
|
Commodity |
Mode |
Transport Cost (IDR per tonne) |
Difference (%) |
|
Rice |
Road |
135,114 |
-126.9 |
|
|
Maritime intermodal |
306,576 |
|
|
Lime |
Road |
290,504 |
-5.1 |
|
|
Maritime intermodal |
305,478 |
|
4.4 The comparison between the corridors
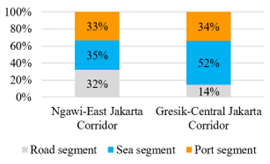
The breakdown of maritime intermodal transport cost by the corridor is shown in Figure 6. The transport cost of the Ngawi-East Jakarta corridor consists of 32% of the road mode segment, 35% of the sea mode segment, and 33% of the port segment. In addition, the transport cost of the Gresik-Central Jakarta corridor consists of 14% of the road mode segment, 52% of the sea mode segment, and 34% of the port segment.
Figure 6. Breakdown of maritime intermodal transport cost (IDR/tonne)
The percentage of road segment cost of the Ngawi-East Jakarta corridor is higher than that of the Gresik-Central Jakarta corridor. The Gresik-Central Jakarta corridor has a short distance of 52 km between the origin location and the port, while the Ngawi-East Jakarta corridor has a long distance of 189 km between the origin location and the port. Both corridors have a short distance of 20 km and 14 km between the destination and the port, respectively for the Gresik-Central Jakarta corridor and the Ngawi-East Jakarta corridor. This fact shows that the distance between the production or attraction location and the port influences the maritime intermodal cost. This finding is in line with the previous study [4-6].
The maritime intermodal transport cost in the corridor of which the origin or destination is close to the port is 5.1% more expensive than road haulage. The cost difference is relatively low. As a result, the maritime intermodal transport serving commodities of which the origin or destination is close to ports could compete with the road transport, on condition that the land distance is shorter than or equal to the maritime distance. This is in line with the previous study [6].
A previous study discovered that the maritime mode became more competitive when it served the areas that were close to the port. The corridors, of which the destinations were close to the port, had a difference between road mode and maritime mode cost of around 24%. On the contrary, the corridors, of which the destinations were far from the port, had the difference between road mode and maritime mode cost of 12.3 and 19.4% [6].
4.5 The comparison between the modes
The breakdown of the transport cost of lime commodity by the mode is shown in Table 6. Based on Table 6, both the road mode transport and the maritime intermodal transport have relatively similar costs to the fleet cost component. The components that have a small difference between the modes are overhead, marketing, and container ownership costs. The components that have a large difference between the modes are node charges, human resources, fuel and oil, and first and last mile costs.
The cost differences between the two modes are correlated with node charges, human resources costs, fuel and oil costs, and first and last mile costs. The maritime intermodal transport is competitive on human resources costs and fuel and oil costs. Conversely, the road mode transport is competitive on the node charges and first mile and last mile costs. In other words, the maritime intermodal transport has low time-related costs, while the road mode transport has low fixed costs and first and last mile costs.
Table 6. Breakdown of lime transport cost by mode
|
Cost Component |
Cost (IDR/tonne/trip) |
|
|
Road Mode |
Maritime Intermodal |
|
|
Human resource |
104,040 |
11,136 |
|
Fleet depreciation, maintenance, insurance, and tax |
42,351 |
40,327 |
|
Fuel and oil |
144,114 |
95,491 |
|
Overhead and marketing cost |
- |
2,837 |
|
Port charges |
- |
103,645 |
|
Toll fee |
- |
- |
|
Container ownership |
- |
8,245 |
|
First mile and last mile costs |
- |
43,797 |
|
Total |
290,504 |
305,478 |
4.6 Sensitivity analysis
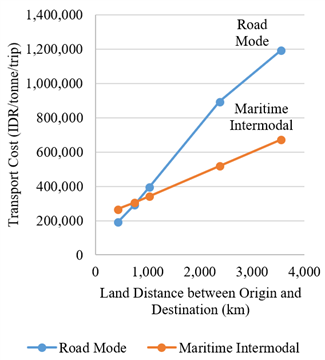
A sensitivity analysis was conducted to discover the impact of the mode type on the transport cost with respect to the transport distance. The sensitivity analysis is shown in Figure 7. For the short transport distance, the costs of the maritime intermodal transport are higher than the costs of the road mode transport. However, for the long transport distance, the costs of the maritime intermodal transport are lower than the costs of the road mode transport. After the transport distance of around 1,000 km, the transport cost gap between the modes increases with transport distance.
In this sensitivity analysis, the distance was estimated from the distance between several cities in Java Island and the distances between a city in Java Island and another city in the adjacent island that is Sumatra Island. It was assumed the cost of inter-island crossings between Java and Sumatra was free and the origin and destination were close to the port. The origin and destination ports can serve container barges at the same cost as the Tanjung Perak and Tanjung Priok ports. The truck was assumed to move through a non-tolled road.
The sensitivity analysis discovers that maritime intermodal transport is competitive against road mode transport on the long-distance corridor, of which the origin and destination are close to the port. This is in line with the previous studies [6, 40].
Figure 7. The relationship between transport cost and transport distance on different mode
Based on the previous studies, the corridor of which length is 372.8 km has a difference between road mode and maritime mode cost of -19.2%. This means that the maritime transport cost of a short corridor is higher than the road mode cost. On the contrary, the corridor of which length is 1,647-2,344 km has the difference between road mode and maritime mode cost of 12.3-32.8%. This means that the maritime transport cost of the long corridor is lower than the road mode cost [6, 40].
Java Island has a medium-long transport corridor, of which the origin and destination are close to the port. These geographical advantages make the maritime intermodal transport relatively competitive against the road mode transport in terms of freight transport cost.
4.7 The impact of the external factors on the cost structures
The impact of environmental impact costs, congestion, and logistical challenges on the structure of transport costs is discussed in this section. The concept of environmental impact costs emerges because the adverse impact of transport on the environment is not borne by the transport providers [50]. The environmental impact costs are estimated based on the amount of fuel consumed. Based on the previous analysis, the road mode transport consumes more fuel and oil than the maritime intermodal transport for the same quantity of freight transported. As a result, the implementation of the environmental impact costs will substantially increase the road mode transport costs. On the contrary, the implementation of the environmental impact costs will slightly increase the maritime intermodal transport costs.
Congestion is commonly experienced by the road mode transport. Congestion enlarges the transport time. Road mode transport is very sensitive to transport time because the mode has high human resources costs. Two drivers are usually hired for a medium-long trip. As a result, congestion can substantially increase the road mode transport costs. Congestion might slightly increase the maritime intermodal transport costs as well, particularly on the first mile and the last mile segments.
Logistical challenges include container matchbacks and the efficiency of freight loading and unloading in the port. Container matchbacks—filling containers with freight on the return trip—substantially decrease the maritime intermodal transport cost. The main haul transport bears the roundtrip costs when there is an empty backhaul.
The efficiency of freight loading and unloading in the port can slightly increase the maritime intermodal transport cost. Based on previous analysis, the maritime intermodal transport has a low time-related cost. Time parameter correlates to human resources costs, auxiliary machine fuel and oil consumptions, and fleet capital costs; however, the maritime intermodal transport is not substantially sensitive to the aforementioned cost components.
4.8 The impact of the maritime intermodal transport on sustainability
A previous study [51] discovered that the transport sector is one of the largest contributors to the increase in CO2 emissions in several developed and developing countries. One of the causes of the increase in transport activities is the increase in household consumption. As a result, green logistics should be attempted to reduce the CO2 emissions due to freight transportation activities.
According to the European Environment Agency [52], CO2 emissions for the freight transported by trucks are 12 times higher than those for the freight transported by the maritime shipping.
The previous part of this study has discovered the potency of the competitiveness of the maritime intermodal transport cost against those of the road mode in the agricultural commodity in Java Island. The agricultural commodity is one of the top commodities moved in large quantities across Java Island [39]. As a result, the modal shift from the road to the sea in Java Island could decrease the CO2 emissions by a relatively large amount.
The CO2 reduction could mitigate the costs borne by society as a result of the CO2 emissions and the associated climate changes. In addition, it is the moral responsibility of the logistics business to carry out the logistics activities without sacrificing the environment.
4.9 Policy implications
The previous part of this study discovers the potency of the competitiveness of the maritime intermodal transport cost against those of road mode in Java Island, of which the corridor is long and close to the port at the origin and destination. The previous part of this study also describes in general the potential for reducing the CO2 emissions due to the modal shift from the road to the sea. As a result, the government should create policies that support the modal shift from the road to the sea in Java Island. Specifically, the government should offer port charge incentives for businesses transporting freight to and from Java Island. This suggestion is based on this study finding showing that the port charges are one of the substantial factors influencing the cost differences between the road mode and the maritime intermodal transport.
Modal shift from the road to the sea might decrease the volume of vehicles on the road. As a result, reducing the vehicle volume might reduce the road maintenance costs. The margin might be allocated for the port charge incentives.
This study compares the cost of freight transport of the road mode transport with that of the maritime intermodal transport in the island of Java. The transport corridor in Java Island is unique because, firstly, the land distance and the maritime distance are relatively equal, and, secondly, the length of the major corridor in Java Island is medium.
There are two corridors of the maritime intermodal transport studied in this research: the first one has a close distance of the origin to the port and the other one has a distant distance of the origin to the port. The freight transport costs of the road mode transport are lower than those of the maritime intermodal transport for both corridors.
The cost differences between the two modes are correlated with node charges, human resources costs, fuel and oil costs, and first and last mile costs. The maritime intermodal transport is competitive on human resources costs and fuel and oil costs. Conversely, the road mode transport is competitive on the node charges and first mile and last mile costs.
Regarding the corridor of which the origin is close to the port, the transport cost is close to the road mode transport cost. As a result, the maritime intermodal transport serving the port-adjacent origin and destination has the potential to compete with the road mode transport on the freight transport corridor, on condition that the land distance is shorter than or equal to the maritime distance.
A sensitivity analysis was conducted to discover the impact of the mode type on the transport cost with respect to the transport distance. The maritime intermodal transport has lower costs compared to the road transport at transport distances longer than around 1,000 km.
A modal shift from the road to the sea in Java Island might reduce the CO2 emissions. CO2 reduction might mitigate the costs borne by society due to CO2 emissions and the associated climate changes.
The government should offer the port charge incentives for businesses domestically transporting freight in Java Island. This is because the maritime intermodal transport cost is substantially sensitive to port charges. The modal shift from the road to the sea might reduce the road maintenance cost, which might be allocated for the port charge incentives.
To our knowledge, this paper is the first one to present a comparison between the maritime intermodal freight transport cost and that of the road haulage across the specific routes in the island of Java. Future work should include the number of annual working days of the ships as the cost consideration. Consequently, future work should study other commodities whose origins are close to the ports in eastern Java. By involving other commodities in the maritime transport in the island of Java, the frequency of ship operations is expected to increase. In addition, future research should expand the variety of data by using the data obtained from the established international maritime transport in Java Island.
The road mode freight transport in Java Island has already in operation, while the maritime intermodal freight transport serving domestic transport in this island is not running yet. As a result, the authors predominantly used primary data to estimate the road mode transport cost, and partly used secondary data to estimate the maritime intermodal transport cost. This limitation could influence the accuracy of the cost estimation. Thus, the results of this research are not to be used for technical calculations in business activities. However, the results of this research can be used as input for transport planning.
This work is supported by The Indonesia Endowment Fund for Education Agency (LPDP), Ministry of Finance, the Republic of Indonesia (Decision letter of scholarship recipient No: SKPB-1892/LPDP/LPDP.3/2024).
[1] Schrobback, P., Irannezhad, E., Prato, C.G. (2023). Potential demand for coastal shipping in Queensland: A behavioural econometric analysis. Maritime Policy and Management, 1-24. https://doi.org/10.1080/03088839.2023.2191255
[2] Arianto, D., Marpaung, E., Malisan, J., Humang, W.P., Puriningsih, F.S., Mutharuddin, Mardiana, T.S., Siahaan, W.J., Pairunan, T., Kurniawan, A. (2022). Cost efficiency and CO2 emission reduction in short sea shipping: Evidence from Ciwandan Port-Panjang Port routes, Indonesia. Sustainability, 14(10): 6016. https://doi.org/10.3390/su14106016
[3] Purwosaputra, A.A., Artana, K.B., Dinariyana, A.A.B. (2022). Selection over small-scale LNG transportation model in designing an efficient and reliable LNG supply chain using analytical network process. Marine Systems and Ocean Technology, 17: 95-112. https://doi.org/10.1007/s40868-022-00115-0
[4] Ng, A.K.Y. (2009). Competitiveness of short sea shipping and the role of port: The case of North Europe. Maritime Policy and Management, 36(4): 337-352. https://doi.org/10.1080/03088830903056983
[5] Morales-Fusco, P., Saurí, S., Lago, A. (2012). Potential freight distribution improvements using motorways of the sea. Journal of Transport Geography, 24: 1-11. https://doi.org/10.1016/j.jtrangeo.2012.05.007
[6] Galati, A., Siggia, D., Crescimanno, M., Martín-Alcalde, E., Saurí Marchán, S., Morales-Fusco, P. (2016). Competitiveness of short sea shipping: The case of olive oil industry. British Food Journal, 118(8): 1914-1929. https://doi.org/10.1108/BFJ-05-2016-0193
[7] Perez-Mesaa, J.C., Galdeano-Gomez, E., Salinas Andujar, J.A. (2012). Logistics network and externalities for short sea transport: An analysis of horticultural exports from Southeast Spain. Transport Policy, 24: 188-198. https://doi.org/10.1016/j.tranpol.2012.08.010
[8] Sambracos, E., Maniati, M. (2012). Competitiveness between short sea shipping and road freight transport in mainland port connections; the case of two Greek ports. Maritime Policy and Management, 39(3): 321-337. https://doi.org/10.1080/03088839.2012.671545
[9] Juste, N., Ghiara, H. (2015). ICT policies in Mediterranean motorways of the sea. International Journal of Transport Economics, 42(2): 191-209.
[10] Chang, Y.T., Lee, P.T.W., Kim, H.J., Shin, S.H. (2010). Optimization model for transportation of container cargoes considering short sea shipping and external cost: South Korean case. Transportation Research Record, 2166(1): 99-108. https://doi.org/10.3141/2166-12
[11] Suárez-Alemán, A., Campos, J., Jiménez, J.L. (2015). The economic competitiveness of short sea shipping: An empirical assessment for Spanish ports. International Journal of Shipping and Transport Logistics, 7(1): 42-67. https://doi.org/10.1504/IJSTL.2015.065894
[12] Sun, Q.W., Sun, J.Q., Jin, Z.H., Sun, S.C. (2019). Mode selection of tractor-and-semitrailer swap transport for ro-ro shipping under land-sea combined transportation. Maritime Policy and Management, 46(8): 995-1010. https://doi.org/10.1080/03088839.2019.1675194
[13] Qiu, X., Xu, S.X., Xu, G.Y. (2021). Pricing and scheduling of barge hinterland transportation service for inbound containers. Transportation Research Part E: Logistics and Transportation Review, 156: 102515. https://doi.org/10.1016/j.tre.2021.102515
[14] Pistilli, G., Campagna, A., Persia, L., Saporito, M.R. (2020). Regionalization of ports as a strategic leverage to improve competitiveness: A study on central italy ports and related hinterland. International Journal of Transport Development and Integration, 4(1): 51-61. https://doi.org/10.2495/TDI-V4-N1-51-61
[15] Chapapría, V.E. (2017). New trends in maritime transportation and port activity. International Journal of Transport Development and Integration, 1(4): 624-632. https://doi.org/10.2495/TDI-V1-N4-624-632
[16] Renna, A., Petrelli, M., Carrese, S., Bertocci, R. (2021). An innovative simulation agent‐based model for the combined sea‐road transport as a DSS. Sustainability, 13(19): 10773. https://doi.org/10.3390/su131910773
[17] Fadda, P., Fancello, G., Mancini, S., Pani, C., Serra, P. (2020). Design and optimisation of an innovative two-hub-and-spoke network for the Mediterranean short-sea-shipping market. Computers and Industrial Engineering, 149: 106847. https://doi.org/10.1016/j.cie.2020.106847
[18] Dahim, M. (2021). Enhancing the development of sustainable modes of transportation in developing countries: Challenges and opportunities. Civil Engineering Journal, 7(12): 2030-2042. https://doi.org/10.28991/cej-2021-03091776
[19] Zahraee, S.M., Rahimpour Golroudbary, S., Shiwakoti, N., Stasinopoulos, P. (2021). Particle-gaseous pollutant emissions and cost of global biomass supply chain via maritime transportation: Full-scale synergy model. Applied Energy, 303: 117687. https://doi.org/10.1016/j.apenergy.2021.117687
[20] Montwiłł, A., Pietrzak, K., Pietrzak, O. (2020). Analysis of the possibility of reducing external costs of transport within land-sea transport chains on the example of zachodniopomorskie voivodeship, Poland. Transport Problems, 15(4): 179-190.
[21] Ikegaya, A., Kosugi, T., Toyoizumi, T., Nagafuji, A., Yamazaki, S., Arai, E. (2021). Ingenuity in packaging maintains the quality of fresh fruits and vegetables in mixed cargo exported by sea. Packaging Technology and Science, 34(11-12): 693-708. https://doi.org/10.1002/pts.2604
[22] Jia, B.Z., Tierney, K., Reinhardt, L.B., Pahl, J. (2022). Optimal dual cycling operations in roll-on roll-off terminals. Transportation Research Part E: Logistics and Transportation Review, 159: 102646. https://doi.org/10.1016/j.tre.2022.102646
[23] Zhang, Y., Tian, H., He, L., Ma, S., Yang, L. (2020). A two-phase stowage approach for passenger-cargo RoRo ship based on 2D-KP: Coping with complex rotation and safe navigation constraints. IEEE Access, 8: 95807-95822. https://doi.org/10.1109/ACCESS.2020.2995639
[24] Tiyaningsih, T., Suyitno., Saddhono, K. (2020). Sustainable technology in marine fisheries in Cilacap Regency, Central Java, Indonesia. International Journal of Design and Nature and Ecodynamics, 15(3): 401-407. https://doi.org/10.18280/ijdne.150313
[25] Purwanto, E., Biasini, N., Yulianto, A., Sitompul, C., Gunawan, T. (2023). Environmental awareness and food waste reduction among generation Z in Indonesia. International Journal of Environmental Impacts, 6(3): 101-111. https://doi.org/10.18280/ijei.060302
[26] Muntafi, Y., Nojima, N. (2021). Seismic properties and fractal dimension of subduction zone in Java and its vicinity using data from 1906 to 2020. International Journal of GEOMATE, 21(85): 71-83. https://doi.org/10.21660/2021.85.j2217
[27] Iriany, A., Iriany, A., Sulistyono, A.D. (2021). The correlation model between microclimates and potato plant growth. International Journal on Advanced Science, Engineering and Information Technology, 11(1): 223-228. https://doi.org/10.18517/ijaseit.11.1.7515
[28] Fauzan, A., Ahdika, A., Kartikasari, M.D., Dini, S.K. (2022). Spatial profiling of the main producing unhulled grain areas in Java Island, Indonesia. Journal of Engineering Science and Technology, 17: 1-10
[29] Suryani, E., Hendrawan, R.A., Muhandhis, I., Indraswari, R. (2022). A simulation model to improve the value of rice supply chain (A case study in East Java – Indonesia). Journal of Simulation, 16(4): 392-414. https://doi.org/10.1080/17477778.2020.1829118
[30] Warlina, L., Pradana, S.B.R. (2021). Sustainable agricultural land management in Garut Regency, West Java Province, Indonesia. Journal of Engineering Research, 1-15. https://doi.org/10.36909/jer.ASSEEE.16089
[31] Perdana, T., Kusnandar, K., Perdana, H.H., Hermiatin, F.R. (2023). Circular supply chain governance for sustainable fresh agricultural products: Minimizing food loss and utilizing agricultural waste. Sustainable Production and Consumption, 41: 391-403. https://doi.org/10.1016/j.spc.2023.09.001
[32] Haryanto, I., Ilmi, N.N., Hutabarat, J., Adhiperdana, B.G., Fauzielly, L., Sendjaja, Y.A., Sunardi, E. (2020). Tectonic and geological structures of gunung kromong, West Java, Indonesia. International Journal of GEOMATE, 19(74): 185-193. https://doi.org/10.21660/2020.74.05449
[33] Prastyantoro, R., Putro, H.P.H., Yudoko, G., Dirgahayani, P. (2022). E-commerce parcel distribution in urban areas with sustainable performance indicators. Sustainability, 14(23): 16229. https://doi.org/10.3390/su142316229
[34] Putro, H.P.H., Rosadi, A. (2021). Using MAMCA for selecting toll road trace to West Java Seaport, Indonesia. Transport Problems, 16(3): 77-87. https://doi.org/10.21307/TP-2021-043
[35] Hermani, W.T., Setyawan, A., Syafi’i. (2023). The effect of toll road operation on national road performance in Central Java Province. Journal of Applied Engineering Science, 21(2): 741-748. https://doi.org/10.5937/jaes0-43041
[36] Mulyono, A.T. (2016). Ketimpangan produksi angkutan barang dan penumpang tiap moda transportasi jalur utama Pantura Jawa. Jurnal HPJI (Himpunan Pengembangan Jalan Indonesia), 2(2): 71-78. https://doi.org/10.26593/jh.v2i2.2311.%25p
[37] Yulfadli, Z., Arifin, M.Z., Djakfar, L., Wicaksono, A., Nafis, M.A. (2023). Analysis of the impact of the railway allowance policy and the increase in fines for loaded trucks on the transfer of modes to rail transportation types. Eastern-European Journal of Enterprise Technologies, 4(3(124)): 54-59. https://doi.org/10.15587/1729-4061.2023.285861
[38] Malisan, J., Marpaung, E., Hutapea, G., Puriningsih, F.S., Arianto, D. (2023). Development of short sea shipping in the north coast of Java Island, Indonesia as a potential market. Transportation Research Interdisciplinary Perspectives, 18: 100760. https://doi.org/10.1016/j.trip.2023.100760
[39] Departemen Perhubungan RI. Portal Asal Tujuan Transportasi Nasional. https://attn-barang.dephub.go.id/data/site/front/?page=pergerakan&jenis=mat&komoditas=Beras&data_jenis=prov2prov&provinsi_asal=JAWA+TENGAH&provinsi_tujuan=BANTEN&generate=, accessed on Sep. 3, 2023.
[40] Lee, P.T.W., Hu, K.C., Chen, T. (2010). External costs of domestic container transportation: Short-sea shipping versus trucking in Taiwan. Transport Reviews, 30(3): 315-335. https://doi.org/10.1080/01441640903010120
[41] Kementerian PUPR RI. Dashboard Infrastruktur. https://sigi.pu.go.id/astv2/, accessed on Dec. 15, 2023.
[42] PELINDO. Wilayah Kerja. https://www.pelindo.co.id/operasional, accessed on Dec. 15, 2023.
[43] Kementerian Perhubungan RI. Data Informasi Pelabuhan Nasional. https://simpel.dephub.go.id/index.php/front, accessed on Dec. 15, 2023.
[44] BPS Provinsi Jawa Timur. (2022). Pola distribusi perdagangan 4 komoditas strategis Provinsi Jawa Timur. Surabaya, Indonesia. https://jatim.bps.go.id/publication/2023/05/11/84d7887d0b10ad314236c919/pola-distribusi-perdagangan-4-komoditas-strategis-provinsi-jawa-timur-2022.html.
[45] Palmer, A., Mortimer, P., Greening, P., Piecyk, M., Dadhich, P. (2018). A cost and CO2 comparison of using trains and higher capacity trucks when UK FMCG companies collaborate. Transportation Research Part D: Transport and Environment, 58: 94-107. https://doi.org/10.1016/j.trd.2017.11.009
[46] Peraturan Menteri Perhubungan Republik Indonesia Nomor PM 22 Tahun 2018. (2018). Kementerian Perhubungan RI. https://peraturan.bpk.go.id/Details/102554/permenhub-no-22-tahun-2018.
[47] Asri, S. (2019). Perspektif teknik dan ekonomi perancangan motorized container barge (MCB). Kementerian Perhubungan RI, Jakarta, Indonesia. https://baketrans.kemenhub.go.id/file/213.
[48] Malisan, J. (2019). Potensi demand pengembangan motorized container barge dalam mengurangi beban lalu lintas barang di jalur Pantura. Kementerian Perhubungan RI, Jakarta, Indonesia. https://baketrans.kemenhub.go.id/file/212.
[49] Resat, H.G., Turkay, M. (2015). Design and operation of intermodal transportation network in the Marmara region of Turkey. Transportation Research Part E: Logistics and Transportation Review, 83: 16-33. https://doi.org/10.1016/j.tre.2015.08.006
[50] Zis, T.P.V., Psaraftis, H.N., Panagakos, G., Kronbak, J. (2019). Policy measures to avert possible modal shifts caused by sulphur regulation in the European Ro-Ro sector. Transportation Research Part D: Transport and Environment, 70: 1-17. https://doi.org/10.1016/j.trd.2019.03.001
[51] Pompermayer Sesso, P., Amâncio-Vieira, S.F., Zapparoli, I.D., Sesso Filho, U.A. (2020). Structural decomposition of variations of carbon dioxide emissions for the United States, the European Union and BRIC. Journal of Cleaner Production, 252: 119761. https://doi.org/10.1016/j.jclepro.2019.119761
[52] European Environment Agency. (2021). Transport and environment report 2020 - Train or plane? European Environment Agency, Copenhagen, Denmark. https://doi.org/10.2800/43379