Mohamad Jamil*![]() | Hadiyanto Hadiyanto
| Hadiyanto Hadiyanto![]() | Ridwan Sanjaya
| Ridwan Sanjaya![]()
© 2024 The authors. This article is published by IIETA and is licensed under the CC BY 4.0 license (http://creativecommons.org/licenses/by/4.0/).
OPEN ACCESS
This study discusses the evaluation of aspects of technology acceptance of M2RSi using Hybrid Technology Acceptance Model (HTAM) that is linked with its external factors, including information quality, infrastructure, knowledge and skills, costs, and virtual simulation environments. The four response alternatives on the 4-point Likert scale utilized in this study were (1) Strongly Disagree, (2) Disagree, (3) Agree, and (4) Strongly Agree. Structural Equation Modeling was used to examine the data (SEM). To assess the efficacy of Mixed Reality (MR) technology in crisis management, this study included 100 respondents from two cities in the evaluation process. The research questionnaire included numerous questions about the features of technological acceptability. This research tested 19 hypotheses, and each hypothesis had a significant influence on external variables related to the effectiveness of MR technology in disaster management. There were 5 dominant priority variables for evaluation by developers: Acceptance (ACC), Behavioral Intention (BI), Satisfaction (SA), Perceived Usefulness (PU), and Trialability (TR). In conclusion, developers will gain a more holistic understanding of the effectiveness of Mixed reality (MR) technology in disaster mitigation simulations by prioritizing evaluation of these variables.
disaster simulation, mobile, mixed reality, Hybrid Technology Acceptance Model (HTAM), structural equation modeling, PLS-SEM
A rapid advancement in hardware and software has led to the development of Mixed Reality to a higher level. It can be seen from the development of modern devices, such as Augmented reality (AR) and virtual reality (VR), and the integration of increasingly sophisticated sensor and computing technologies. Mixed reality (MR) is now at the center of innovation, attracting the interest of developers, companies, and users due to its ability to provide more immersive and interactive experiences [1-3]. The MR technology revolution brings new functionalities and empowerment to all sectors of society. MR brings many benefits to various fields, especially those related to learning, training, and simulation [4, 5]. To give consumers a distinctive experience, MR integrates virtual reality and telepresence technology during the simulation process [6]. Using this technology, students can learn practical skills in a safe setting, visualize complex ideas, and construct interactive simulations [7, 8].
In educational settings, technology has an important role in coordinating people, ideas, procedures, and outcomes of educational implementation. All educational activities can be controlled with technology, making it easier to project the achievement of educational goals clearly [6]. It covers various fields, including disaster education. Nowadays, the use of various types of learning media plays a crucial role in increasing understanding of the disaster risk reduction process [9]. Media has an interdependent relationship with society and plays a significant role in disseminating information before, during, and after a disaster [10]. Learning media comes in a range of forms that can be customized to meet the needs and preferences of the user, such as interactive, audio, and visual media. Because immersive technologies can offer interactive visualizations, like Virtual Reality (VR) and Augmented Reality (AR), they can open up new experiences for users [11, 12]. A significant factor in the creation of the metaverse is MR technology, since it complements all the shortcomings of AR and VR [13, 14]. MR not only displays virtual objects but also receives all new information, processes feedback, and synchronizes data from users.
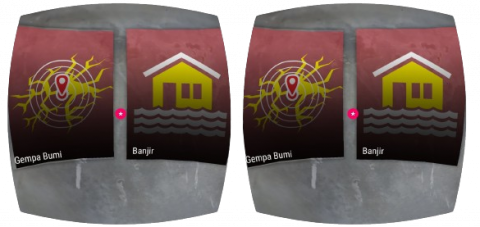
Mobile Mixed Reality Simulator (M2RSi) is an application that combines real-world and virtual elements. MR2Si is designed to increase understanding of disaster preparedness through simulations and interactive instructions based on Mixed Reality technology. In this way, users can easily practice preparedness actions in real world contexts. However, the use of technology cannot be easily accepted by society, especially in emergencies. It is important to consider many aspects, including intentions, behavior, benefits, convenience, and comfort in using the media, devices, or services being developed. In Figure 1, an example of the initial display of the MR2Si application is shown.
Figure 1. Mobile Mixed Reality Simulator (M2Rsi)
However, the use of technology cannot be easily accepted by society, especially in emergencies. It is important to consider many aspects, including intentions, behavior, benefits, convenience, and comfort in using the media, devices, or services being developed.
The Technology Acceptance Model (TAM) is one model that is frequently used to assess elements or factors influencing users in using a technology or system. Several previous studies explained that the factors in the Technology Acceptance Model (TAM) variables need to be reviewed to examine the extent to which the use of immersive technology can influence users in the learning process [15]. TAM is widely used in various contexts with reliable and accurate results [16, 17].
The Hybrid Technology Acceptance Model (HTAM) concept is an idea to test aspects of technology acceptance, which are then linked with external factors. External factors play a significant role in shaping user perceptions about ease of use, usefulness, usage intentions, and actual behavior regarding technology acceptance [18]. Study limitations and research on using Extended Reality (AR, VR, MR) technology are necessary to support better disaster management [19]. HTAM integrates the Technology Acceptance Model (TAM) with the Innovation Diffusion Theory (IDT) [20].
This study discusses the evaluation of aspects of technology acceptance of M2RSi using the Hybrid Technology Acceptance Model (HTAM) linked with its external factors, including information quality, infrastructure, knowledge and skills, costs, and virtual simulation environments. TAM theory explains two things that influence users to use new technology, namely Perceived Usefulness (PU) and Perceived Ease of Use (PEOU) [21]. TAM is a theory that measures users’ willingness and intention to use technology based on four main elements, including Perceived Usefulness, Perceived Ease of Use, Attitude, and Behavioral Intention [22-24].
The four response alternatives on the 4-point Likert scale utilized in this study were (1) Strongly Disagree, (2) Disagree, (3) Agree, and (4) Strongly Agree. Next, the Structural Equation Model (SEM) was used to evaluate the data and look for relationships between the variables. SEM consists of relationships between latent variables, where each cause-and-effect relationship can be expressed by a linear regression equation, or called a structural equation [25].
TAM analysis using small sample data can cause problems since it is related to the statistical methods used in the hypothesis analysis of relationships between constructs in the TAM structure. SEM requires the fulfillment of several assumptions, including normality and linearity [26, 27]. The use of the Partial Least Squares (PLS) analysis technique is a necessity in TAM analysis to meet normality assumptions and to solve the problem of small data size in the research [28].
In the context of a Mobile Mixed Reality Simulator (M2RSi) evaluation related to disaster mitigation simulation, TAM analysis is expanded by combining aspects of technology acceptance with aspects of innovation diffusion theory (IDT). The combination of two approach models (TAM+IDT) called the Hybrid Technology Acceptance Model (HTAM) can provide a more holistic approach in understanding and designing technology to support disaster management, by considering the psychological aspects of users as well as effective presentation of information in emergency situations, especially concerns the effectiveness of using MR technology in disaster management.
2.1 The Hybrid Technology Acceptance Model (HTAM)
Several empirical studies recommend integrating TAM with other theories or models to address radical technological change. TAM is the most used framework to explore the adoption of technology [29]. Previous researchers showed that the integration of TAM and IDT can provide better models than use alone [30]. The HTAM concept was first used to overcome the ineffectiveness of the previous method (TAM) in explaining the complex information technology adoption process [31]. The HTAM technology acceptance model is of great benefit in explaining and analyzing information system usage behavior, which in turn is influenced by attitudes and behavioral intentions [20]. The integration of the TAM model has been proven to provide appropriate antecedents in utilizing technology since TAM has a stronger theoretical background in predicting behavioral intentions [32, 33].
2.2 Mixed reality technology in disaster management
The use of MR technology in disaster management provides many significant benefits in preparing, planning and responding to disaster situations better and more effectively. As a technology for disaster training simulation, MR has a bright future [34]. Fischer research proposed using serious games based on MR technology in disaster response scenarios [35]. Lochhead and Hedley [36] introduced a new way of linking human simulations to real-world contexts utilizing MR technology. Girau et al. [37] introduced an MR system for emergency and first aid simulation scenarios. Several previous studies that have been presented have focused more on the use of MR technology, but have not yet discussed the process of evaluating the use of MR technology.
2.3 Framework and development hypothesis
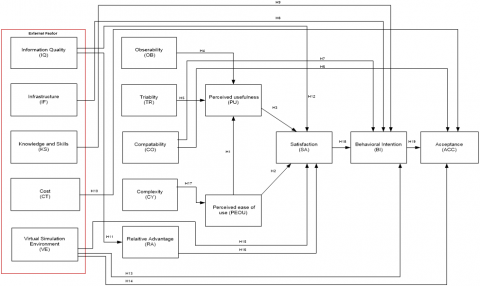
The HTAM framework was developed not only to connect the classic TAM method with the problem of information technology (IT) adoption, but was also employed to investigate several issues surrounding the application of Mixed Reality (MR) technology in disaster management. Figure 2 shows the development of the hypothesis and framework of HTAM which reveals causal relationships between variables by mapping based on respondents' hypotheses to the research problem. The instrument in the form of a questionnaire was created online and can be accessed on the page http://mrsi.my.id/technology-acceptance to get information from responders with the aim of testing hypotheses or gaining a better understanding of the phenomenon being studied.
This research was conducted in two different locations, namely in Termate City, North Maluku Province and Semarang City, Central Java Province. These two areas were chosen because they are potentially prone to disasters such as floods, earthquakes and volcanic eruptions. The population in this study was obtained based on the number of residents sourced from data from the Central Statistics Agency (BPS) in 2022. The sampling technique used in this research was Proportionate random sampling. Proportionate random sampling technique was used to determine the number of samples with a population taken proportionally [38]. The sample criteria selected were grouped based on age ranging from 10-64 years. The population was then divided into several groups according to proportion, namely with a ratio of 60:40, (60 Respondents from Semarang City), (40 Respondents from Ternate City) samples were taken randomly from each group. The sample size in this study was calculated using the Slovin equation. Slovin's formula is as follows:
$\mathrm{n}=\frac{\mathrm{N}}{1+\mathrm{Ne}^2}$ (1)
where:
n = Sample size/ number of respondents
N = Population size
e = Acceptable percentage of error; e = 0.1 (10%)
Based on this equation, the sample size in this study was 100 respondents. Table 1 shows the sample and proportion based on age group.
$\mathrm{n}=\frac{1375417}{1+1 \cdot 375 \cdot 417(0,1)^2}=99,99 \sim 100$ respondents
Table 1. Sample and proportions based on age group
|
Location |
Age Group |
Population |
Proportion |
Sample |
|
A Semarang City |
10-14 |
124,332 |
10.04% |
6 |
|
15-19 |
127,834 |
10.32% |
6 |
|
|
20-24 |
123,356 |
9.96% |
6 |
|
|
25-29 |
127,842 |
10.32% |
6 |
|
|
30-34 |
131,434 |
10.61% |
6 |
|
|
35-39 |
135,311 |
10.92% |
7 |
|
|
40-44 |
134,405 |
10.85% |
7 |
|
|
45-49 |
122,443 |
9.88% |
6 |
|
|
50-54 |
109,113 |
8.81% |
5 |
|
|
55-59 |
95,163 |
7.68% |
5 |
|
|
60-64 |
7,704 |
0.62% |
0 |
|
|
Number of Respondents |
1,238,937 |
100.00% |
60 |
|
|
B. Ternate City |
10-14 |
16,841 |
12.34% |
5 |
|
15-19 |
16,684 |
12.22% |
5 |
|
|
20-24 |
17,966 |
13.16% |
5 |
|
|
25-29 |
19,144 |
14.03% |
6 |
|
|
30-34 |
18,731 |
13.72% |
5 |
|
|
35-39 |
1,703 |
1.25% |
1 |
|
|
40-44 |
15,225 |
11.16% |
4 |
|
|
45-49 |
12,867 |
9.43% |
4 |
|
|
50-54 |
10,634 |
7.79% |
3 |
|
|
55-59 |
842 |
0.62% |
0 |
|
|
60-64 |
5,843 |
4.28% |
2 |
|
|
Number of Respondents |
136,480 |
100.00% |
40 |
|
|
Total A+ B |
1,375,417 |
100.00% |
100 |
|
The formulation of the hypothesis is shown in Table 2 below.
Figure 2. HTAM framework and hypothesis development
Table 2. HTAM hypothesis variable
|
Variable |
Indicator |
Hypothesis |
|
H1 |
Perceived ease of use (PEOU) |
Has a positive influence on Perceived Usefulness (PU) |
|
H2 |
Perceived ease of use (PEOU) |
Has a positive influence on Satisfaction (SA) |
|
H3 |
Perceived usefulness (PU) |
Has a positive influence on Satisfaction (SA) |
|
H4 |
Observability |
Has a positive influence on Perceived Usefulness (PU) |
|
H5 |
Trialability |
Has a positive influence on Perceived Usefulness (PU) |
|
H6 |
Compatibility |
Has a positive influence on Acceptance (ACC) |
|
H7 |
Compatibility (CO) |
Has a positive influence on Behavioral Intention (BI) |
|
H8 |
Infrastructure (IS) |
Has a positive influence on Behavioral Intention (BI) |
|
H9 |
Knowledge and Skills (KS) |
Has a positive influence on Behavioral Intention (BI) |
|
H10 |
Cost (CT) |
Has a positive influence on Acceptance (ACC) |
|
H11 |
Information Quality (IQ) |
Has a positive influence on Relative Advantage (RA) |
|
H12 |
Information Quality (IQ) |
Has a positive influence on Satisfaction (SA) |
|
H13 |
Virtual Simulation Environment (VE) |
Has a positive influence on Behavioral Intention (BI) |
|
H14 |
Virtual Simulation Environment (VE) |
Has a positive influence on Acceptance (ACC) |
|
H15 |
Virtual Simulation Environment (VE) |
Has a positive influence on Satisfaction (SA) |
|
H16 |
Relative Advantage (RA) |
Has a positive influence on Satisfaction (SA) |
|
H17 |
Complexity (CY) |
Has a negative influence on Perceived Ease of Use (PEOU) |
|
H18 |
Satisfaction (SA) |
Has a positive influence on Behavioral Intention (BI) |
|
H19 |
Behavioral Intention (BI) |
Has a positive influence on Acceptance (ACC) |
Table 3. HTAM research questionnaire
|
Variable |
No. |
Questions |
|
Quality of information |
1 |
The material presented in the mixed reality simulator (MESI) meets expectations. |
|
2 |
The simulation material contains complete procedures regarding the stages of disaster mitigation. |
|
|
3 |
Using mixed reality simulators (MRSI) greatly assists in understanding the disaster mitigation process. |
|
|
Perceived ease of use |
1 |
Using mixed reality simulators (MRSI) provides experience and convenience in understanding the simulation process of disaster mitigation. |
|
2 |
The mixed reality simulator helps understand disaster mitigation. |
|
|
Perceived usefulness |
1 |
Mixed reality simulators offer more opportunities to understand the simulation material effectively. |
|
2 |
Mixed reality simulators offer more opportunities to understand mitigation procedures. |
|
|
Compatibility |
1 |
Each simulation content created is sufficient to meet the procedures for disaster mitigation stages. |
|
2 |
Mixed reality simulator (MRSI) can describe the same conditions as those in the real world. |
|
|
Complexity |
1 |
Mixed reality simulators are difficult to use in the disaster mitigation simulation process. |
|
2 |
The scenarios presented are difficult to understand in the learning process. |
|
|
Trialability |
1 |
The guidelines for using mixed reality devices are very easy to understand. |
|
2 |
It takes a long time to understand how to use a mixed reality simulator. |
|
|
Observability |
1 |
Simulation using a mixed reality simulator has an effective impact on society. |
|
2 |
Mixed reality simulator technology is easy to implement in everyday life. |
|
|
Relative advantage |
1 |
Mixed reality simulator technology has better quality than the previous technology |
|
2 |
Mixed reality simulator technology provides a more effective and efficient training model. |
|
|
Behavioral intention |
1 |
Mixed reality simulator provides a detailed understanding of disaster mitigation |
|
2 |
The use of mixed reality simulators can change attitudes and actions in responding to disaster events. |
|
|
Satisfaction |
1 |
Simulation using a mixed reality simulator provides satisfaction in understanding the disaster mitigation process. |
|
2 |
The use of a mixed reality simulator provides convenience in the simulation process. |
|
|
Infrastructure |
1 |
The use of mixed reality simulator requires adequate network connectivity |
|
2 |
The use of mixed reality simulator requires adequate hardware specifications. |
|
|
Knowledge and skills |
1 |
The use of mixed reality technology requires knowledge and skills in information technology. |
|
2 |
The use of mixed reality simulators can enrich knowledge, attitudes, and skills in disaster response... |
|
|
Cost |
1 |
The use of mixed reality simulators requires quite large costs to implement. |
|
2 |
The use of mixed reality technology is only limited to certain circles or industries. |
|
|
Virtual environment simulation |
1 |
The use of mixed reality simulator provides flexibility in exploring the simulated environment. |
|
2 |
The simulation process using mixed reality simulator devices is only limited to certain spaces and environments. |
|
|
Acceptance |
1 |
The use of mixed reality simulators can reduce user anxiety about the threat of disasters. |
|
2 |
The use of mixed reality simulators can help and support government programs in reducing disaster risk. |
The questionnaire consists of 31 questions and is based on a conceptual model that controls the variables' involvement. Table 3 lists the variables and questions from the Hybrid TAM (HTAM) questionnaire used in the M2RSi evaluation procedure for simulations of disaster mitigation.
On the 4-point Likert scale used in this study, the four response options were (1) Strongly Disagree, (2) Disagree, (3) Agree, and (4) Strongly Agree. The most excellent score for an answer is 4, while the lowest is 1. After reducing the number of classes/categories used to establish the criteria to a scale of 4 classes, the class interval was (4-1): 4=0.75. The requirements for describing the mean value produced for each item, indicator, and variable are outlined in Table 4.
Table 4. Indicator score of research variable
|
No |
Score |
Interpretation |
|
1 |
1.00-1.74 |
Poor |
|
2 |
1.75-2.49 |
Bad |
|
3 |
2.50-3.24 |
Good |
|
4 |
3.25-4.00 |
Excellent |
3.1 Measurement model assessment
The validity of the measurement model can be evaluated by looking at the results of the estimated loadings for each factor. If a variable's standard factor loading is ≥ 0.50 and/or its factor loading t-value is larger than the critical value (≥ 1.96), it is deemed to have strong validity for its construct or latent variable. Meanwhile, if the Average Variance Extracted (AVE) value is > 0.50 and Construct Reliability (CR ≥ 0.70) it can be used to assess the reliability of the measurement model in PLS. A recapitulation of validity and reliability results can be seen in Table 5.
According to the Table 5, all loading factor values for the reflective indicators are ≥ 0.50 (Valid), and all AVE values are ≥ 0.50 (Valid), indicating that all indicators that measure them are deemed valid. In the meantime, the Composite Reliability (CR) value is > 0.70 (Reliable), according to the reliability computation findings. Consequently, it may be said that each of these latent variables has a reasonable and workable indicator. Specifically, the following criteria can be used to identify the most prominent signs that contribute to the latent concept:
Table 5. Summary measurement model evaluation (outer model)
|
Variable |
Indicator (Factor) |
Partial Validity Parsial (Per Indicator) |
Ranking |
Over All Validity (Per Construct) |
Composite Reliability (CR > 0.7) |
|||
|
(LF > 0.5=Valid) |
(AVE > 0,5=Valid) |
|||||||
|
Outer Loading |
Detail |
AVE |
Conclusion |
CR |
Detail |
|||
|
Acceptance (ACC) |
ACC1 |
0.858 |
Valid |
1 |
0.721 |
Valid |
0.838 |
Reliable |
|
ACC2 |
0.841 |
Valid |
2 |
|||||
|
Behavioral Intention (BI) |
BI1 |
0,906 |
Valid |
1 |
0.805 |
Valid |
0.892 |
Reliable |
|
BI2 |
0.889 |
Valid |
2 |
|||||
|
Compatibility (CO) |
CO1 |
0.867 |
Valid |
1 |
0.656 |
Valid |
0.791 |
Reliable |
|
CO2 |
0.749 |
Valid |
2 |
|||||
|
Cost (CT) |
CT1 |
0.846 |
Valid |
2 |
0.763 |
Valid |
0.865 |
Reliable |
|
CT2 |
0.900 |
Valid |
1 |
|||||
|
Complexity (CY) |
CY1 |
0.910 |
Valid |
2 |
0.853 |
Valid |
0.921 |
Reliable |
|
CY2 |
0.937 |
Valid |
1 |
|||||
|
Infrastructure (IF) |
IF1 |
0.654 |
Valid |
2 |
0.582 |
Valid |
0.732 |
Reliable |
|
IF2 |
0.858 |
Valid |
1 |
|||||
|
Information Quality (IQ) |
IQ1 |
0.812 |
Valid |
3 |
0.693 |
Valid |
0.871 |
Reliable |
|
IQ2 |
0.842 |
Valid |
2 |
|||||
|
IQ3 |
0.843 |
Valid |
1 |
|||||
|
Knowledge and Skills (KS) |
KS1 |
0.790 |
Valid |
2 |
0.665 |
Valid |
0.798 |
Reliable |
|
KS2 |
0.840 |
Valid |
1 |
|||||
|
Observability (OB) |
OB1 |
0.851 |
Valid |
1 |
0.668 |
Valid |
0.801 |
Reliable |
|
OB2 |
0.782 |
Valid |
2 |
|||||
|
Perceived ease of use (PEOU) |
PEOU1 |
0.913 |
Valid |
1 |
0.826 |
Valid |
0.905 |
Reliable |
|
PEOU2 |
0.905 |
Valid |
2 |
|||||
|
Perceived usefulness (PU) |
PU1 |
0.861 |
Valid |
2 |
0.766 |
Valid |
0.868 |
Reliable |
|
PU2 |
0.889 |
Valid |
1 |
|||||
|
Relative advantage (RA) |
RA1 |
0.882 |
Valid |
2 |
0.779 |
Valid |
0.876 |
Reliable |
|
RA2 |
0.883 |
Valid |
1 |
|||||
|
Satisfaction (SA) |
SA1 |
0.890 |
Valid |
1 |
0.787 |
Valid |
0.881 |
Reliable |
|
SA2 |
0.884 |
Valid |
2 |
|||||
|
Trialability (TR) |
TR1 |
0.919 |
Valid |
1 |
0.604 |
Valid |
0.745 |
Reliable |
|
TR2 |
0.602 |
Valid |
2 |
|||||
|
Virtual Environment Simulation (VE) |
VE1 |
0.866 |
Valid |
1 |
0.735 |
Valid |
0.848 |
Reliable |
|
VE2 |
0.849 |
Valid |
2 |
|||||
3.2 Structural model assessment
As with regression interpretation, the R-squared value for each endogenous latent variable will be looked at first when evaluating a structural equation model using PLS. This will determine the structural model's predictive potential. The impact of some exogenous latent factors on endogenous latent variables is explained and its significance is assessed using changes in the R-squared value. The R-squared number in PLS represents the percentage of the construct's variance that the model can account for. The percentage of variance that the model can explain increases with an increase in the R-squared value.
The perceived ease of use (PEOU), observability (OB), and trialability (TR) models' coefficient of determination (R-squared) on perceived usefulness (PU) is 0.665, which indicates that 66.5% of the variables can be accurately measured on perceived usefulness (PU), while the remaining 33.5 is influenced by other variables outside the research. The Complexity (CY) model's coefficient of determination (R-squared) on Perceived Ease of Use (PEOU) is 0.213, meaning that 21.3% of the data can be accurately measured, with the remaining 78.7% being influenced by factors outside the scope of the study. The information quality (IQ) model's coefficient of determination (R-squared) on relative advantage (RA) is 0.663, which indicates that 66.3% of the information quality (IQ) on RA can be accurately measured, with the remaining 33.7 percent influenced by variables not included in the study. From the models of perceived usefulness (PU), perceived ease of use (PEOU), information quality (IQ), relative advantage (RA), and virtual environment simulation (VE) for satisfaction (SA), the coefficient of determination (R-squared) is 0.931, which can be explained that the accuracy of measurement of Perceived Usefulness (PU), Perceived Ease of Use (PEOU), Information Quality (IQ), Relative Advantage (RA), Virtual Environment Simulation (VE) on Satisfaction (SA) is 93.1% and the remaining 6.9 is influenced by other variables outside the research. The coefficient of determination (R-squared) obtained from the models of Satisfaction (SA), Infrastructure (IF), Knowledge and Skills (KS), Compatibility (CO), and Virtual Environment Simulation (VE) on Behavioral Intention (BI) is 0.937, which can be explained that the accuracy of measurement of Satisfaction (SA), Infrastructure (IF), Knowledge and Skills (KS), Compatibility (CO), and the impact of Virtual Environment Simulation (VE) on Behavioral Intention (BI) is 93.7%. external factors influence the remaining 6.3%. The coefficient of determination (R-squared) obtained from the models of the Behavioral Intention (BI), Virtual Environment Simulation (VE), Compatibility (CO), and Cost (CT) on Acceptance (ACC) is 0.906, which can be explained that the accuracy of measuring Behavioral Intention (BI), Virtual Environment Simulation (VE), Compatibility (CO), and Cost (CT) on Acceptance (ACC) is 90.6% and the remaining 9.4 is influenced by other variables outside the research. Table 6 below shows the evaluation results of R-squared values in PLS.
Table 6. Evaluation results R-squared values in PLS
|
Influence |
R Square Values |
||
|
Perceived ease of use (PEOU) |
--> |
Perceived usefulness (PU) |
0.665 |
|
Observability (OB) |
--> |
||
|
Trialability (TR) |
--> |
||
|
Complexity (CY) |
--> |
Perceived ease of use (PEOU) |
0.213 |
|
Information Quality (IQ) |
--> |
Relative advantage (RA) |
0.663 |
|
Perceived usefulness (PU) |
--> |
Satisfaction (SA) |
0.931 |
|
Perceived ease of use (PEOU) |
--> |
||
|
Information Quality (IQ) |
--> |
||
|
Relative advantage (RA) |
--> |
||
|
Virtual Environment Simulation (VE) |
--> |
||
|
Satisfaction (SA) |
--> |
Behavioral Intention (BI) |
0.937 |
|
Infrastructure (IF) |
--> |
||
|
Knowledge and Skills (KS) |
--> |
||
|
Compatibility (CO) |
--> |
||
|
Virtual Environment Simulation (VE) |
--> |
||
|
Behavioral Intention (BI) |
--> |
Acceptance (ACC) |
0.906 |
|
Virtual Environment Simulation (VE) |
--> |
||
|
Compatibility (CO) |
--> |
||
|
Cost (CT) |
--> |
||
3.3 Hypothesis testing (path analysis)
If at a significance threshold of 0.05, the t-statistic falls between -1.96 and 1.96, a causal association is deemed non-significant. Resampling procedures such as bootstrapping are used to make t-statistic estimates more stable. In the bootstrapping process, samples are determined through replacement (sampling with replacement), so each sample has the same size as the original sample. Then, statistical estimates are calculated from each sample to produce more stable and accurate statistical estimates. The results of PLS-SEM Path Analysis are shown in Table 7.
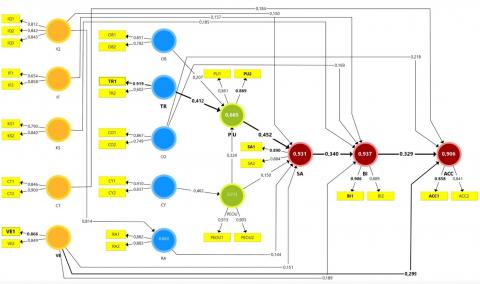
Perceived Usefulness (PU) is known to be positively impacted by the Perceived Ease of Use (PEOU) variable. The results of Perceived Usefulness (PU), where the Path coefficient found is 0.324 with a t-value of 3.546, indicate that the Perceived Ease of Use (PEOU) is higher. Given that the t-value (3.546 > 1.96) exceeds the critical value, according to the statistical hypothesis, H0 is rejected. This indicates a significant relationship between the Perceived Usefulness (PU) and Perceived Ease of Use (PEOU) variables. It is known that the Observability (OB) variable has a positive influence on Perceived Usefulness (PU). It means that the higher the Observability (OB), the higher the results of the Perceived Usefulness (PU), where the Path coefficient obtained is 0.207 with a t-value of 2.079. Statistical hypothesis H0 is rejected since the t-value (2.079 > 1.96) exceeds the critical value, meaning that the Observability (OB) variable has a significant influence on the Perceived Usefulness (PU) variable. It is known that the Trialability (TR) variable has a positive influence on Perceived usefulness (PU). It means that the higher the Trialability (TR), the higher the results of the Perceived Usefulness (PU) variable, where the Path coefficient obtained is 0.412 with a t-value of 4.441. Since the t-value is greater than the critical value (4.441 > 1.96), according to the statistical hypothesis, H0 is rejected, indicating a substantial relationship between the Trialability (TR) and Perceived Usefulness (PU) variables. It is well established that the Complexity (CY) component negatively impacts perceived ease of use (PEOU). It means that the higher the Complexity (CY), the lower the results of the Perceived Ease of Use (PEOU) variable, where the Path coefficient obtained is -0.462, with a t-value of 5.042. Given that the t-value (5.042 > 1.96) is higher than the critical threshold, the statistical hypothesis suggests that H0 is rejected, indicating that the Complexity (CY) variable significantly affects the Perceived Ease of Use (PEOU) variable. It is known that the Information Quality (IQ) variable has a positive influence on Relative Advantage (RA). This indicates that the Relative Advantage (RA) variable's outcomes increase with increasing Information Quality (IQ), with a t-value of 20.097 and a Path coefficient of 0.814 found. Since the t-value is greater than the critical value (20.097 > 1.96), According to the statistical hypothesis, H0 is rejected, indicating a substantial relationship between the Relative Advantage (RA) and Information Quality (IQ) variables. It is well established that Satisfaction (SA) is positively impacted by the Perceived Utility (PU) variable. This indicates that the Satisfaction (SA) variable yields higher outcomes the higher the Perceived usefulness (PU), with a t-value of 4.921 and a path coefficient of 0.452. Given that the t-value above the critical value (4.921 > 1.96), the statistical hypothesis posits the rejection of H0, indicating a noteworthy impact of the Perceived usefulness (PU) variable on the Satisfaction (SA) variable. Figure 3 displays the factor weight values of the manifest variables in the measurement model and the path coefficients in the structural model. These may be seen in the path diagram of the measurement model and structural model.
Based on the Path Diagram above, the Acceptance variable (ACC) is more dominantly influenced by the Behavioral Intention (BI) variable, with the highest path coefficient of 0.329. Meanwhile, the Behavioral Intention (BI) variable is more dominantly influenced by the Satisfaction (SA) variable, with the highest path coefficient of 0.340, where the dominant variable in influencing the Satisfaction (SA) variable is the Perceived Usefulness (PU) variable, with the highest path coefficient of 0.452. This is caused by the Trialability (TR) variable that has a more dominant influence on Perceived usefulness (PU), with the highest path coefficient of 0.412. In this case, the most dominant indicator representing the Trialability (TR) variable is the TR1 indicator (Guidelines for using mixed reality devices are easy to understand), with the highest factor loading of 0.9.
Table 7. Results of PLS-SEM path analysis
|
Influence between Latent Variables |
Path Coefficient |
t-Value |
p-Value |
Conclusion |
||
|
Causal Variables |
--> |
Effect Variables |
||||
|
Perceived ease of use (PEOU) |
--> |
Perceived usefulness (PU) |
0.324 |
3.546 |
0.000 |
Significant |
|
Observability (OB) |
--> |
Perceived usefulness (PU) |
0.207 |
2.079 |
0.038 |
Significant |
|
Trialability (TR) |
--> |
Perceived usefulness (PU) |
0.412 |
4.441 |
0.000 |
Significant |
|
Complexity (CY) |
--> |
Perceived ease of use (PEOU) |
-0.462 |
5.042 |
0.000 |
Significant |
|
Information Quality (IQ) |
--> |
Relative advantage (RA) |
0.814 |
20.097 |
0.000 |
Significant |
|
Perceived usefulness (PU) |
--> |
Satisfaction (SA) |
0.452 |
4.921 |
0.000 |
Significant |
|
Perceived ease of use (PEOU) |
--> |
Satisfaction (SA) |
0.150 |
2.392 |
0.017 |
Significant |
|
Information Quality (IQ) |
--> |
Satisfaction (SA) |
0.150 |
2.173 |
0.030 |
Significant |
|
Relative advantage (RA) |
--> |
Satisfaction (SA) |
0.144 |
2.065 |
0.039 |
Significant |
|
Virtual Environment Simulation (VE) |
--> |
Satisfaction (SA) |
0.151 |
2.451 |
0.015 |
Significant |
|
Satisfaction (SA) |
--> |
Behavioral Intention (BI) |
0.34 |
3.721 |
0.000 |
Significant |
|
Information Quality (IQ) |
--> |
Behavioral Intention (BI) |
0.157 |
2.522 |
0.012 |
Significant |
|
Knowledge and Skills (KS) |
--> |
Behavioral Intention (BI) |
0.185 |
2.482 |
0.013 |
Significant |
|
Compatibility (CO) |
--> |
Behavioral Intention (BI) |
0.169 |
2.605 |
0.009 |
Significant |
|
Virtual Environment Simulation (VE) |
--> |
Behavioral Intention (BI) |
0.189 |
2.61 |
0.009 |
Significant |
|
Behavioral Intention (BI) |
--> |
Acceptance (ACC) |
0.329 |
3.205 |
0.001 |
Significant |
|
Virtual Environment Simulation (VE) |
--> |
Acceptance (ACC) |
0.299 |
3.904 |
0.000 |
Significant |
|
Compatibility (CO) |
--> |
Acceptance (ACC) |
0.218 |
2.338 |
0.020 |
Significant |
|
Cost (CT) |
--> |
Acceptance (ACC) |
0.184 |
3.584 |
0.000 |
Significant |
Figure 3. Path model diagram of the research results
Several findings presented in this research to determine the effectiveness of using mixed reality technology in disaster mitigation are:
The practical application and significance of mixed reality evaluation in disaster mitigation efforts has great potential to increase effectiveness, efficiency and safety in disaster management, namely:
Considering the previous description, it can be concluded that MR technology-based simulation media can be used for disaster simulation because there are objects and artificial virtual environments like in the real world that can carry out scenarios such as a disaster. This can be seen from the 19 hypotheses designed, each of which significantly influences external variables related to the effectiveness of using MR technology in disaster management.
There are several limitations in this research. First, it was carried out using only 100 participants. Future research could replicate this study with more participants and greater representation in terms of gender and age. Second, use statistical analysis such as ANOVA to test the mean between groups.
This research was supported by the Doctoral Program of Information Systems School of Postgraduate Studies, Diponegoro University, and Informatics Engineering Study Program Khairun University.
|
H |
Hypothesis |
|
ACC |
Acceptance |
|
BI |
behavioral intention |
|
CO |
Compatability |
|
CT |
Cost |
|
CY |
Complexity |
|
IF |
Infrastructure |
|
IQ |
Information quality |
|
KS |
Knowledge and skills |
|
OB |
Observability |
|
PEOU |
Perceived ease of use |
|
PU |
Perceived usefulness |
|
RA |
Relative advantage |
|
SA |
Satisfaction |
|
TR |
Trialability |
|
VE |
Virtual environment simulation |
|
CR |
Composite reliability |
|
LF |
Loading factor |
|
Greek symbols |
|
|
--> |
Influence |
|
> |
Greater than |
|
< |
Less than |
[1] Efe, A. (2023). Taking virtual reality and augmented reality to the next level: Artificial intelligence with mixed reality. Journal of Public Administration and Technology, 4(2): 141-165. https://doi.org/10.58307/kaytek.1185712
[2] Acampora, G., Trinchese, P., Trinchese, R., Vitiello, A. (2023). A serious mixed-reality game for training police officers in tagging crime scenes. Applied Sciences, 13(2): 1177. https://doi.org/10.3390/app13021177
[3] Kee, T., Zhang, H., King, R.B. (2023). An empirical study on immersive technology in synchronous hybrid learning in design education. International Journal of Technology and Design Education. https://doi.org/10.1007/s10798-023-09855-5
[4] Wortley, D.J. (2022). The mixed reality revolution - opportunities and challenges. Acta Scientific Computer Sciences, 4(5): 53-63.
[5] Komianos, V. (2022). Immersive applications in museums: An analysis of the use of XR technologies and the provided functionality based on systematic literature review. International Journal Informatics on Visualization, 6(1): 60-73. http://doi.org/10.30630/joiv.6.1.708
[6] Refdinal, R., Adri, J., Prasetya, F., Tasrif, E., Anwar, M. (2023). Effectiveness of using virtual reality media for students’ knowledge and practice skills in practical learning. International Journal on Informatics Visualization, 7(3): 688-694. http://doi.org/10.30630/joiv.7.3.2060
[7] Sviridova, E., Yastrebova, E., Bakirova, G., Rebrina, F. (2023). Immersive technologies as an innovative tool to increase academic success and motivation in higher education. Frontiers in Education, 8: 1-10. https://doi.org/10.3389/feduc.2023.1192760
[8] Nussipova, G., Nordin, F., Sörhammar, D. (2020). Value formation with immersive technologies: an activity perspective. Journal of Business & Industrial Marketing, 35(3): 483-494. https://doi.org/10.1108/JBIM-12-2018-0407
[9] Sejati, P.M., Budiningsih, C.A., Pujianto. (2019). Multimedia in disaster risk reduction. Journal of Physics: Conference Series, 1233: 012090. https://doi.org/10.1088/1742-6596/1233/1/012090
[10] Sarma, R.J. (2021). Media and disaster management: The role of media. International Journal of Advances in Engineering and Management (IJAEM), 3(10): 827-833. https://doi.org/ 10.35629/5252-0310827833
[11] Permanasari, A.E., Nugroho, H.E., Ardhanarko, H.B.S., Fauziati, S., Utami, I.K., Sholihin, M. (2022). Development of VR and AR learning media for enterprise business ethic scenarios. In 2022 International Conference on Information Technology Systems and Innovation (ICITSI), Bandung, Indonesia, pp. 225-230. https://doi.org/10.1109/ICITSI56531.2022.9970892
[12] Almufarreh, A. (2023). Exploring the potential of mixed reality in enhancing student learning experience and academic performance: An empirical study. Systems, 11(6): 292. https://doi.org/10.3390/systems11060292
[13] Trunfio, M., Jung, T., Campana, S. (2022). Mixed reality experiences in museums: Exploring the impact of functional elements of the devices on visitors’ immersive experiences and post-experience behaviours. Information & Management, 59(8): 103698. https://doi.org/10.1016/j.im.2022.103698
[14] Pregowska, A., Osial, M., Dolega-Dolegowski, D., Kolecki, R., Proniewska, K. (2022). Information and communication technologies combined with mixed reality as supporting tools in medical education. Electron., 11(22): 3778. https://doi.org/10.3390/electronics11223778
[15] Fussell, S.G., Truong, D. (2022). Using virtual reality for dynamic learning: An extended technology acceptance model. Virtual Reality, 26(1): 249-267. https://doi.org/10.1007/s10055-021-00554-x
[16] Alshurideh, M.T., Kurdi, B.A. (2023). Factors affecting social networks acceptance: An extension to the technology acceptance model using PLS-SEM and machine learning approach. International Journal of Data and Network Science, 7(1): 489-494. https://doi.org/10.5267/j.ijdns.2022.8.010
[17] Alarefi, M. (2023). Cloud computing usage by governmental organizations in Saudi Arabia based on vision 2030. Uncertain Supply Chain Management, 11(1): 169-178. https://doi.org/10.5267/j.uscm.2022.10.010
[18] Jain, M., Soni, G., Verma, D., Baraiya, R., Ramtiyal, B. (2023). Selection of technology acceptance model for adoption of industry 4.0 technologies in Agri-fresh supply chain. Sustainability, 15(6): 4821. https://doi.org/10.3390/su15064821
[19] Khanal, S., Medasetti, U.S., Mashal, M., Savage, B., Khadka, R. (2022). Virtual and augmented reality in the disaster management technology: A literature review of the past 11 years. Frontiers in Virtual Reality, 3: 843195. https://doi.org/10.3389/frvir.2022.843195
[20] Sanayei, A., Ansari, A., Ranjbarian, B. (2010). A hybrid technology acceptance approach for using the E-CRM information system in clothing industry. International Journal of Information Science and Management, 8(1): 15-26.
[21] Davis, F.D., Bagozzi, R.P., Warshaw, P.R. (1989). User acceptance of computer technology: A comparison of two theoretical models. Management Science, 35(8): 903-1028. https://doi.org/10.1287/mnsc.35.8.982
[22] Davis, F.D., Venkatesh, V. (1996). A critical assessment of potential measurement biases in the technology acceptance model: Three experiments. International Journal of Human-Computer Studies, 45(1): 19-45. https://doi.org/10.1006/ijhc.1996.0040
[23] Huang, L.S., Huang, C.F. (2017). A study of using technology acceptance model and its effect on improving road pavement smoothness in Taiwan. Eurasia J. Math. Sci. Eurasia Journal of Mathematics, Science and Technology Education, 13(6): 2181-2195. https://doi.org/10.12973/eurasia.2017.01220a
[24] Profile, S.E.E. (2011). An analysis of technology acceptance in turkey using fuzzy logic and structural equation modelling. Yapısal Eşitlik Modeli ve Bulanık Mantık Kullanılarak Türkiye de Teknoloji Kabulünün Bir Analizi, 4: 34-48.
[25] Han, N., Hayashi, K., Miyao, Y. (2020). Analyzing word embedding through structural equation modeling. In Proceedings of the 12th Conference on Language Resources and Evaluation, pp. 1823-1832.
[26] Tomarken, A.J., Waller, N.G. (2005). Structural equation modeling: Strengths, limitations, and misconceptions. Annual Review of Clinical Psychology, 1: 31-65. https://doi.org/10.1146/annurev.clinpsy.1.102803.144239
[27] Hasman, A. (2015). An introduction to structural equation modeling. Studies in Health Technology and Informatics, 213: 3-6. https://doi.org/10.3233/978-1-61499-538-8-3
[28] Fauzi, M.A. (2022). Partial least square structural equation modelling (PLSSEM) in knowledge management studies: Knowledge sharing in virtual communities. Knowledge Management & E-Learning an International Journal, 14(1): 103-124. https://doi.org/10.34105/j.kmel.2022.14.007
[29] Pham, L.T.T., Nguyen, Y.T.H. (2023). An integrated framework approach to understanding Vietnamese people’s intention to adopt smart home solutions. Human Behavior and Emerging Technologies, 2023: 8882543. https://doi.org/10.1155/2023/8882543
[30] Wu, I.L., Wu, K.W. (2005). A hybrid technology acceptance approach for exploring e-CRM adoption in organizations. Behaviour & Information Technology, 24(4): 303-316. https://doi.org/10.1080/0144929042000320027
[31] Kim, I. (2004). Hybrid technology acceptance model: The case of object-oriented programming. In Pacific Asia Conference on Information Systems (PACIS), pp. 1215-1228.
[32] Krisdina, S., Nurhayati, O.D., Nugraheni, D.M.K. (2022). Hybrid model based on technology acceptance model (TAM) & information system success model (ISSM) in analyzing the use of E-health. E3S Web of Conferences, 359: 05003. https://doi.org/10.1051/e3sconf/202235905003
[33] Mardiana, S., Tjakraatmadja, J.H., Aprianingsih, A. (2015). DeLone-Mclean information system success model revisited: The separation of intention to use - use and the integration of technology acceptance models. International Journal of Economics and Financial Issues, 5(1): 172-182.
[34] Alharthi, S.A., LaLone, N., Khalaf, A.S., Torres, R.C., Nacke, L.E., Dolgov, I., Toups, I.O. (2018). Practical insights into the design of future disaster response training simulations. In Proceedings of the 15th International Conference on Information Systems for Crisis Response and Management, pp. 806-817.
[35] Fischer, J.E., Jiang, W., Moran, S. (2012). AtomicOrchid: A mixed reality game to investigate coordination in disaster response. Lecture Notes in Computer Science, 7522: 572-577. https://doi.org/10.1007/978-3-642-33542-6_75
[36] Lochhead, I., Hedley, N. (2019). Mixed reality emergency management: Bringing virtual evacuation simulations into real-world built environments. International Journal of Digital Earth, 12(2): 190-208. https://doi.org/10.1080/17538947.2018.1425489
[37] Girau, E., Mura, F., Bazurro, S., Casadio, M., Chirico, M., Solari, F., Chessa, M. (2019). A mixed reality system for the simulation of emergency and first-aid scenarios. In 2019 41st Annual International Conference of the IEEE Engineering in Medicine and Biology Society (EMBC), Berlin, Germany, pp. 5690-5695. https://doi.org/10.1109/EMBC.2019.8856777
[38] Chen, T.Y., Tse, T.H., Yu, Y.T. (2001). Proportional sampling strategy: A compendium and some insights. Journal of Systems and Software, 58(1): 65-81. https://doi.org/10.1016/S0164-1212(01)00028-0