Lakshmi Prasanna Byrapuneni*![]() | Malgireddy Saidireddy
| Malgireddy Saidireddy![]()
© 2024 The authors. This article is published by IIETA and is licensed under the CC BY 4.0 license (http://creativecommons.org/licenses/by/4.0/).
OPEN ACCESS
In response to escalating cyber threats, there is an urgent need for adaptive detection mechanisms. This study introduces a cyber threat detection framework employing ensemble learning and a hybrid feature ranking approach. Designed to address diverse and evolving threats, the framework aims to enhance detection accuracy in dynamic environments. The framework comprises three key components. Firstly, an ensemble feature ranking algorithm identifies influential features in imbalanced datasets, ensuring effective threat detection while mitigating imbalanced class impact. Secondly, a hybrid feature ranking measure (HFRM) integrates fusion entropy to assess feature importance comprehensively. HFRM combines information gain, entropy, and proposed fusion entropy for a holistic ranking. Thirdly, the framework includes a multi-class k-means rank-based classification for efficient clustering and threat categorization. Evaluation using diverse datasets underscores the framework's effectiveness in achieving high detection accuracy and robustness across threat scenarios. The ensemble approach, hybrid feature ranking, and rank-based classification collectively provide an adaptive solution for cyber threat detection. In conclusion, this research introduces an innovative framework integrating ensemble learning, hybrid feature ranking, and k-means clustering, promising more resilient cybersecurity in the face of sophisticated threats.
multi-class classification, data filtering, outlier detection, cyber-attack detection
The rapid proliferation of the Internet of Things (IoT) has significantly reshaped urban landscapes, particularly in the context of smart city applications. With projections estimating an excess of 125 billion IoT devices by 2030, the security of interconnected systems faces unprecedented challenges. This text aims to delve into the intricate vulnerabilities and threats confronting IoT networks within smart city infrastructures, underscoring the imperative for advanced threat intelligence detection mechanisms [1].
1.1 IoT in smart cities: A vulnerability overview
Smart city applications heavily rely on the interconnectivity of IoT devices, presenting a significant impact on urban life. However, the sheer volume and diversity of IoT devices across various technologies and protocols expose residents' personal information to serious cybersecurity threats. This section delves into the challenges of administering IoT networks, emphasizing the susceptibility of smart city applications to cyber dangers [2].
1.2 Intrusion detection system for IoT security
Traditional Intrusion Detection Systems (IDS) prove inadequate for resource-constrained IoT devices. This section introduces the concept of an IDS tailored for IoT networks, highlighting the need for specialized approaches. The text explores the role of IDS in monitoring and defending against intruders, emphasizing its significance as a secondary line of defense [3].
1.3 Machine learning and deep learning for attack detection
As traditional IDS falls short in identifying IoT attacks, this section introduces machine learning and deep learning techniques as viable alternatives. Various algorithms, including Support Vector Machine, Naïve Bayes, Random Forest, K-Nearest Neighbor, Multilayer Perceptron, Logistic Regression, Decision Tree, and Deep Learning CNN, are explored for their potential in detecting and classifying attacks.
The multi-class k-means rank-based classification method with a Hybrid Bayesnet combines several key techniques to offer a robust approach to multi-class classification.
Multi-Class K-Means Clustering:
The method utilizes k-means clustering to partition the dataset into k distinct clusters based on the features' similarity.
Each data point is assigned to the nearest cluster centroid, effectively grouping similar instances together.
Rank-Based Classification:
After clustering, a rank-based classification approach is employed to assign labels to the data points within each cluster.
This classification method utilizes the ranked features, where features with higher importance scores are given more weight in the classification process.
By incorporating feature ranking, the algorithm ensures that the most relevant features contribute more significantly to the classification decision.
Hybrid Bayesnet Construction:
Following classification, a Hybrid Bayesnet is constructed to further refine the classification model.
The Bayesian network captures dependencies between features and their impact on the target labels.
By leveraging both the clustered data and the selected features, the Hybrid Bayesnet enhances the classification model's accuracy and interpretability.
Advantages:
Robustness to Complex Data Structures:
The multi-class k-means clustering allows for the identification of underlying patterns in complex datasets.
By grouping similar data points into clusters, the method can handle non-linear relationships and complex data distributions effectively.
Interpretability through Feature Ranking:
Feature ranking ensures that only the most relevant features contribute to the classification decision.
This enhances the interpretability of the model by focusing on the key factors influencing the classification outcome.
Scalability and Efficiency:
K-means clustering and rank-based classification are computationally efficient techniques, making the method scalable to large datasets.
Distributed computing frameworks can further improve efficiency by parallelizing the computation across multiple processors or nodes.
Integration of Bayesian Networks:
The incorporation of a Hybrid Bayesnet allows for the capture of complex dependencies between features and labels. This integration enhances the model's ability to handle uncertainty and noisy data, leading to more robust classification results.
Flexibility and Adaptability:
The method can be adapted to different types of datasets and classification tasks by adjusting parameters such as the number of clusters (k) and the feature selection criteria.
This flexibility makes the approach suitable for various real-world applications across different domains.
1.4 Problem statement and motivation
The text highlights vulnerabilities in IoT networks within smart cities, aiming to bolster security against increasingly sophisticated cyber threats. It proposes enhancing threat intelligence detection through optimized deep learning and IDS-based attack detection, with novel approaches to feature selection and secure data transmission. Intrusion Detection Systems play a vital role in identifying and alerting to anomalous behavior, safeguarding against internal and external attacks. Various types, such as Network-Based and Distributed IDS, offer scalable defense mechanisms. Feature extraction is crucial in intrusion detection, involving the extraction of values from datasets, categorized into simple heuristic, static, and dynamic features, enhancing detection techniques.
This research works as describes the section 2 of related survey and prosed work as defined as section 3 and results discussion section 4 and finally section 5 as concluded in this paper.
A comprehensive review of major research findings in the field of IoT security in smart cities, both domestically and internationally, underscores the evolving landscape of cybersecurity and highlights areas for further investigation [4, 5].
Noor et al. [6] explored discriminatory features for machine learning-based malware classifiers. They experimented with various feature sets, including byte-n-grams, opcode-n-grams, fields of PE headers, and dynamic traces, for classifying malware families. Their results showcased the optimal algorithm-feature set combinations, highlighting that Decision Tree (DT) performance excels or equals that of Support Vector Machine (SVM) across all features, providing the highest accuracy with minimal features. The escalating growth and sophistication of malware pose a critical challenge to the digital world. To mitigate losses caused by malware, various security solutions, such as Anti-Virus (AV) techniques, have been developed. These AV techniques are broadly categorized into Signature-based and Non-Signature-based methods. Signature-based AV software uses scanning techniques to identify suspicious files based on specific byte sequences, offering high accuracy for known malware but failing to detect "zero-day" and "unknown" malwares. Signature-based techniques face limitations in their signature databases, and the process of creating signatures is time-consuming and complex, providing a larger attack time window for attackers. Dey et al. [7] proposed an Intrusion Detection System (IDS) specifically designed for IoT-related routing attacks, including selective forwarding and sinkhole attacks. The system incorporated anomaly-centric and specification-centric IDS modules, utilizing a voting method to determine suspicious behavior. In a smart city scenario, the hybridized model achieved a 76.19 percent true positive rate and a 5.92 percent False Positive Rate (FPR) during simultaneous selective-forwarding and sinkhole assaults, demonstrating efficient performance with minimal storage requirements. In the exploration conducted by Imran et al. [8] an IoT architecture based on an ID architecture was adopted, emphasizing the use of commodity devices as a core unit for the suggested design. The Raspberry Pi, a widely used single-board computer, was employed in performance evaluations using the open-source IDS, Snort. The study suggested that the proposed design, utilizing resource-constrained devices like the Raspberry Pi, effectively safeguarded IoT distributed systems. However, a notable drawback was identified as the design inadvertently leaving an open door for potential harm by an attacker on the target system. Al-Hawawreh and Hossain [9] proposed that processing health-related data could minimize malware attacks. They utilized a Deep Neural Network (DNN) primarily for authenticating IoT devices. The study highlighted concerns about potential overfitting in this context. Jamal et al. [10] developed a three-layered IDS employing a supervised methodology to detect various network-centric cyber-attacks in IoT networks. The system not only classified and analyzed each connected IoT device but also identified malicious packets and categorized different attack types. Evaluation in a smart-home test environment, utilizing eight commercially available gadgets, demonstrated F-measures of 90%, 98%, and 96% for the system's fundamental activities. Despite the high security level achieved, the implementation cost was higher. Akhter et al. [11] introduced Deep Neural Networks-centric anomalous Network IDSs, an intelligent framework constructing an optimized hybrid model based on Simulated and Improved Genetic Algorithms. Multiple algorithms were applied to determine the most effective combination of parameters crucial for constructing a DNN-centered IDS, such as feature selection, architectural design, data normalization, activation, and momentum functions. The results of experiments showcased the system's superiority over existing frameworks, demonstrating improved detection accuracy and reduced false alarm rates. The network-based IDS's significant advantage in blocking attacks before reaching internal systems was acknowledged, while the study recognized the inevitability of DoS attacks. Alani et al. [12] proposed an algorithm named RBMs (Restricted Boltzmann Machines) for a smart city Intrusion Detection System (IDS) framework. The utilization of unsupervised learning, coupled with real-time data from sensors and smart meters, informed the use of RBMs. Diverse classifiers were subsequently trained based on these characteristics. The methodology's performance was evaluated using a smart water distribution unit, demonstrating its ability to identify attacks with greater precision. It outperformed a categorization strategy lacking a feature learning phase, albeit with a notable reliance on hardware, presenting a significant drawback. Despite a 3.120 error rate, the method exhibited an improved malware detection rate of 98.790 percent, albeit with a significant error rate compared to current methods. Jahromi et al. [13] proposed addressing the effective balance between energy usage and security in IoT networks using three different techniques. Optimization at the MAC layer was deemed necessary to reduce energy consumption during security solution implementation. Trust-centric algorithms, including LDF (Listen Own Data Forwarding), NLDF (No Listening for Data Forwarding), and LT (Listen to All Transmissions), were introduced. LDF was chosen based on the network characteristics of the smart city, resulting in an energy-efficient security strategy for resource-constrained IoT devices. Yazdinejad et al. [14] proposed an anomaly-based Intrusion Detection System based on Recurrent Neural Network (RNN), a deep learning technique. RNN leverages feedback from antecedent data to influence present outcomes, evaluated through multiclass and binary classifications using the NSL-KDD intrusion detection dataset. Noor et al. [15] developed an Anomaly Traffic Detection method using Support Vector Machine, a supervised machine learning approach. The introduction of a novel algorithm estimating the entropy of data instances, coupled with a threshold value, identified aberrations in network behavior. SVM served as the classifier, enhanced by Particle Swarm Optimization (PSO) method, with assessments conducted on KDD CUP 99 and DARPA datasets. Noor et al. [15] designed a peculiar intrusion detection scheme for the IoT environment based on deep learning technology, addressing zero-day threats encountered due to the usage of multiple protocols in the IoT platform. Abirami and Palanikumar [16] introduced a modern network intrusion detection approach based on Conditional Variational Autoencoder (CVAE), specifically created for recognizing threats in the IoT network. The model, with intrusion labels consolidated within the decoder, emphasizes feature reconstruction and is deployable in IoT networks for identifying network intrusions. They tackled the IoT middleware requirement, acknowledging constrained resources in most devices, and proposed intelligent-based making methods for such middleware. An automata theory-based technique was presented in the study of Aygul et al. [17] for the vast and diverse IoT platform. This technique involves designing uniform descriptions of IoT systems through labeled transition systems expansions, facilitating threat identification by correlating the flow of actions. A hybrid Intrusion Detection System (IDS), Jiang et al. [18] were developed to distribute various tasks to the border router and each network node, enabling cooperative functioning. In this design, each node in the IDS module has the capability to monitor neighbor nodes. If an attack is detected on a neighbor node, the notifying node informs the IDS module present in the border router. The specific technique used to identify usual activities is not explicitly mentioned by the authors. An IDS for the IoT environment was developed using a hybrid placement method [19]. Nodes in the centralized module receive notifications from network nodes about variations in nearby nodes. Three algorithms are applied in this technique to examine and identify threats in the network, with reduced power consumption and memory usage in the IoT environment. Alshehri et al. [20] introduced a deep packet anomaly detection-based IDS technique for IoT networks. Optimal attributes are selected using bit-pattern matching, considering the payload of the network as a byte sequence. N-gram and bit-pattern comparisons significantly reduce the false positive rate for traditional threats. Lin et al. [21] deployed the Knowledge-driven Adaptable Lightweight Intrusion Detection System (KALIS) in a centralized placement method. KALIS is knowledge-driven, self-adapting, and supports various communication protocols. It automatically gathers attribute details while monitoring the network, accurately detecting routing, Denial of Service (DoS), and conventional threats compared to other classical IDS approaches. Racherache et al. [22] introduced an anomaly-based intrusion detection system to address threats in the cloud platform. Binary-based Particle Swarm Optimization (BPSO) selects the most relevant instances, which are then classified using Support Vector Machine (SVM). Control parameters of SVM are tuned by Standard-based Particle Swarm Optimization (SPSO). Chen et al. [23] designed a novel security scheme for the virtual network layer in cloud computing using snort and classifiers like decision tree, associative, and Bayesian. An intrusion detection system is deployed in each host of the cloud, performing analysis in both offline and real-time. Admass et al. [24] developed the Online Intrusion Detection System Cloud System (OIDCS) to detect zero-day threats in online mode. The NeuCube architecture, based on the TBR algorithm, is deployed on OIDCS, achieving high accuracy. Yockey et al. [25] introduced a packet scrutinization algorithm and NK-RNN (normalized Kmeans with the recurrent neural network) using trust authority, cloudlet controller, and virtual machine. A one-time signature secures end-users from invaders, detecting port scan and flooding attacks through the Packet Scrutinization Algorithm (PS). Irshad and Siddiqui [26] examined the interaction between malignant users and rational cloud resource supporters in the context of multi-mesh distributed technology in cloud computing, addressing its fragility and sensitivity to security risks.
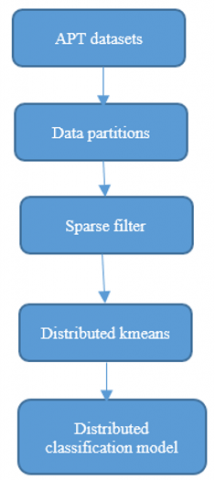
In this framework, a hybrid system is devised to handle threat data across three distinct phases, as illustrated in Figure 1. The input dataset emerges as a pivotal tool for detecting network intrusions within the Internet of Things (IoT) network. This dataset comprises data capturing the behavior of various devices interconnected within the network. Information about these devices, including their type, behavior, and communication patterns, is collected and stored in the cloud. Subsequently, this data undergoes analysis to pinpoint potential intrusions.
The initial phase of cyber threat dataset analysis involves statistical outlier detection. Outliers, characterized by data points significantly divergent from the dataset's norm, are scrutinized. Input data, in the context of machine learning and data analysis, denotes raw information or observations furnished to a system or algorithm for processing, analysis, or other purposes. The quality and relevance of input data play pivotal roles in determining the efficacy of machine learning models.
Data filtering, a subsequent step, entails the selection of a subset of data from a larger dataset based on specific criteria or conditions. This process aids in reducing dataset size and focusing on pertinent information. Techniques such as removing duplicates, applying specific conditions (e.g., selecting recent customers), and eliminating outliers contribute to refining the dataset for subsequent analysis or modeling.
Ranking, another crucial aspect, involves ordering items or data points within a dataset based on specific attributes. This assigns a numerical or ordinal position to each item, indicating its relative importance, value, or relevance. Such ordering enhances the interpretability of the dataset and aids in subsequent analysis.
Unlike traditional multi-class classification, where a model is trained to classify data into one of several mutually exclusive classes, parallel multi-class classification involves performing these classifications concurrently. This approach proves advantageous when dealing with a vast number of classes or when speed and efficiency are paramount. Proposed multi-class classification can be implemented through distributed computing frameworks, allowing the training and evaluation of multiple classifiers simultaneously. Each classifier handles the classification of data into one of the classes, and their results are amalgamated to make the final prediction, as depicted in Figure 1.
The "Distributed Feature Ranking for Subset Selection" algorithm aims to efficiently rank features for subset selection by leveraging decision tree-based methods. Initially, the algorithm takes as input an input feature matrix X consisting of n samples and m features, along with a target variable vector y containing n labels. Additionally, the maximum depth of the decision tree, denoted as max_depth, is specified. The algorithm defines a function, rank_features (X, y), responsible for ranking features based on their importance, employing a suitable feature ranking method and returning a list of features sorted in descending order of importance. Subsequently, another function, construct_ decision_tree (X, y, depth), is defined to recursively build the decision tree. If the depth equals the maximum depth or if all samples in y belong to the same class, a leaf node with the majority class is created and returned. If X has no features remaining, a leaf node with the majority class is created and returned. Features are ranked using the rank_features function, and the top feature is selected for branching in the decision tree. For each unique value of the selected feature, subsets of samples and corresponding labels are created, and the process recurs until the tree reaches the maximum depth or all samples in a subset belong to the same class. Finally, the constructed decision tree is returned. The algorithm concludes by calling construct_decision_tree with the input data and depth initialized to zero, initiating the construction of the decision tree. Through this approach, the algorithm efficiently ranks features and constructs a decision tree for subset selection, aiding in identifying relevant features and improving model interpretability.
The "Multi Class K-Means Rank Based Classification with Hybrid Bayes Net" function describes a comprehensive approach for multi-class classification by sequentially executing several key steps. Initially, feature ranking is performed to assess the relevance of features within the dataset (X, y), followed by feature selection to isolate the most informative ones based on a specified parameter (m). Subsequently, the selected features are utilized in K-Means clustering to partition the dataset into distinct clusters, facilitating the identification of underlying patterns. Upon clustering, rank-based classification is employed to assign labels to the data points, enhancing interpretability. Additionally, a hybrid Bayesian network is constructed to further refine the classification model, leveraging both the clustered data and the selected features. Overall, this methodological framework ensures a robust and informed approach to multi-class classification, offering insights into complex data structures and enhancing predictive accuracy.
Figure 1. Overall framework of proposed cluster based classification model
Algorithm 1: Filling missing values in numerical feature F using non-linear Gaussian estimation
|
Algorithm 1 outlines the procedure for filling missing values in a numerical feature array, denoted as F, using a non-linear Gaussian estimation. The input parameters include the numerical feature array F with missing values and the total number of elements in F, denoted as N. The algorithm initializes an array NLG to store the non-linear Gaussian estimation values. It then iterates through each index of F, calculating the natural logarithm of each element and subsequently determining the corresponding Gaussian value. The maximum value (maxF) in F and the sum of all non-missing values in F (sumF) are calculated. Additionally, the sum of all values in NLG (NLG_sum) is computed. Another array, filled_values, is initialized to store the filled values. For each index in F, if the corresponding element is missing (e.g., NaN or null), the algorithm calculates the NLG_ratio using specific formulas, and the missing value is filled using this ratio and the sum of non-missing values. If the element is not missing, it is simply copied to the filled_values array. The output of the algorithm is the filled_values array, containing the original values where available and estimated values for the missing ones based on non-linear Gaussian estimation.
The Algorithm 2 described outlines a process for constructing a decision tree within a distributed feature ranking framework for subset selection. This procedure takes as input an array of features (X) and corresponding target labels (y), utilizing a specified maximum depth for the decision tree. The algorithm comprises two key functions: rank_features (X, y) and construct_decision_tree (X, y, depth). The former is responsible for assessing the importance of each feature through a designated ranking method, returning a list of features sorted by their significance. The latter function, construct_decision_tree, is a recursive process that builds the decision tree. It first checks stopping conditions, such as reaching the maximum depth or having all samples in the same class. Subsequently, it ranks features, selects the most important one, and creates decision nodes based on its unique values. The process is repeated recursively for each subset until leaf nodes are created, capturing the majority class. This distributed feature ranking approach ensures that the decision tree is constructed by considering the importance of features in a systematic manner, facilitating effective subset selection for predictive modeling.
Algorithm 2: Distributed Feature ranking for subset selection
|
The algorithm 3 and algorithm 4 outlined is a procedure for constructing Multi Class K-Means Rank Based Classification with the following steps.
STEP 1: FEATURE RANKING
In the feature ranking step, the significance or importance of each feature in the dataset is determined with respect to the target variable. A specific method, such as mutual information, correlation coefficient, or feature importance from a model like a decision tree, is used to rank each feature. The outcome is a rank or score that indicates the relevance or importance of each feature with respect to the target variable. These ranks are then stored in a vector for further processing in the subsequent steps.
STEP 2: FEATURE SELECTION AND KMEANS
Once the features have been ranked, the feature selection step aims to select a subset of the most important or relevant features based on predefined criteria. The ranking vector is first sorted in descending order, ensuring that features with the highest ranks or scores are considered first. Two criteria are provided for feature selection:
Algorithm 3: Multi Class KMeans Rank Based Classification (X, k, T, θ)
|
Algorithm 4: Multi Class K-Means Rank Based Classification with Hybrid Bayes Net
|
The algorithm 5 outlined is a procedure for constructing a Bayesian network from a given dataset. It takes as input a dataset (D) containing variables of interest, a set of variables for the Bayesian network (S), the number of samples in the dataset (N), the maximum number of states for each variable (q), and the maximum number of parents for each variable (r). The algorithm initializes an empty Bayesian network (BN) with nodes for each variable in S. It estimates the conditional prior probabilities for each variable based on the dataset D and sets them as the prior probabilities in BN. Then, for each variable in S, it iterates through all possible combinations of parent variables and calculates the joint probabilities. The Bayesian network is gradually constructed by selecting variables and their parents based on the Bayesian score, considering the logarithms of conditional prior probabilities and joint probabilities. The process continues until all variables in S are included in the network. This algorithm ensures the systematic creation of a Bayesian network, capturing dependencies and conditional probabilities among variables from the input dataset.
Algorithm 5: Hybrid Bayes Net
|
The dataset comprises multiple components, featuring a baseline dataset that captures ordinary activities observed during a 10-minute simulation. Additionally, six distinct attack scenarios were executed independently on the baseline architecture, each involving RT0 as the rogue terminal. These attacks encompassed a spectrum from basic denial-of-service (DOS) and ATP attacks to the injection of fake data and logic attacks, each with varying message counts and durations. The dataset is structured as separate CSV files, encompassing diverse fields such as message ID, timestamps, error indicators, mode codes, channel information, and more. These fields furnish comprehensive details about message exchanges within the threat data during both regular operations and simulated attacks. This dataset serves as a valuable asset for scrutinizing the databus's behavior under diverse conditions and evaluating the efficacy of intrusion detection and security measures.
In this section, we present a comprehensive analysis of the performance metrics obtained from applying various machine learning models to the cyber threat dataset. The evaluation metrics utilized include Accuracy, Recall, Precision, F-measure, MCC (Matthews Correlation Coefficient), and ROC (Receiver Operating Characteristic) curve analysis.
Model Performance Metrics:
Accuracy:
Accuracy measures the proportion of correctly classified instances out of the total instances evaluated. It provides an overall assessment of the model's predictive performance.
Recall (Sensitivity):
Recall calculates the proportion of actual positive instances that were correctly predicted by the model. It is particularly useful in scenarios where detecting all positive instances is crucial, such as in identifying cyber threats.
Precision:
Precision quantifies the proportion of predicted positive instances that were correctly classified. It is essential for assessing the reliability of positive predictions made by the model.
F-measure:
The F-measure combines precision and recall into a single metric, providing a balanced assessment of a model's performance. It is calculated as the harmonic mean of precision and recall.
Matthews Correlation Coefficient (MCC): MCC takes into account true and false positives and negatives, providing a correlation coefficient value between -1 and +1. A value closer to +1 indicates a stronger predictive performance, while values near 0 suggest random predictions.
ROC Curve Analysis:
ROC curve analysis evaluates a classifier's performance across various threshold settings by plotting the true positive rate against the false positive rate. The area under the ROC curve (AUC) quantifies the classifier's discriminative ability, with higher values indicating better performance.
In this section, we provide a detailed overview of the experimental procedures conducted to evaluate the effectiveness of the proposed cluster-based classification approach for detecting IoT bot cyberattacks. The experimental pipeline encompasses data collection, preprocessing, model training, evaluation, and validation steps.
1. Data Collection:
Dataset Selection:
Choose an appropriate dataset containing network traffic data collected from IoT devices under various conditions, including normal operation and simulated attack scenarios.
Data Sources:
Access datasets from reliable sources or generate synthetic datasets to simulate different types of cyberattacks, including denial-of-service (DoS), command-and-control (C2) communication, data exfiltration, and malware propagation.
Dataset Characteristics:
Ensure that the dataset includes relevant features such as packet headers, timestamps, source-destination IP addresses, communication protocols, and payload data.
2. Data Preprocessing:
Data Cleaning: Remove any irrelevant or redundant features from the dataset to reduce dimensionality and improve computational efficiency.
Missing Value Handling:
Address missing values by imputation techniques such as mean imputation, median imputation, or using algorithms like algorithm 1 for filling missing values in numerical features.
Normalization/Standardization:
Scale the features to a standard range to prevent any bias due to varying scales across features.
Feature Engineering:
Extract relevant features from the raw data and perform feature engineering techniques to enhance the discriminative power of the model.
3. Model Training:
Feature Selection: Use feature ranking methods such as mutual information, correlation coefficient, or model-based feature importance to select the most informative features for training the model.
Cluster-based Classification: Implement the proposed cluster-based classification approach using algorithms such as K-Means, DBSCAN, or hierarchical clustering to identify patterns indicative of IoT bot cyberattacks.
Model Initialization: Initialize the model parameters and hyperparameters based on domain knowledge and experimentation.
Training Algorithm: Train the model using the selected features and the labeled dataset, ensuring a suitable loss function and optimization algorithm.
4. Model Evaluation:
Cross-Validation: Employ cross-validation techniques such as k-fold cross-validation to assess the model's performance on different subsets of the data and mitigate overfitting.
Table 1. Statistical analysis of data features
|
Features |
Skewness |
Kurtosis |
Mode |
Range |
Variance |
|
msgId |
0.189494 |
-1.30816 |
1 |
22999 |
53529192 |
|
Timestamp |
3.310311 |
10.78406 |
67.47067 |
5266.15 |
1056135 |
|
Error |
|||||
|
modeCode |
|||||
|
Channel |
2.78255 |
5.743005 |
0 |
1 |
0.085169 |
|
connType |
0.554083 |
-1.17511 |
0 |
2 |
0.617999 |
|
Sa |
9.670794 |
161.3402 |
1 |
31 |
2.758459 |
|
Ssa |
1.624146 |
1.227912 |
5 |
30 |
75.58434 |
|
Da |
9.936773 |
110.0526 |
3 |
30 |
6.181331 |
|
Dsa |
2.534756 |
4.540211 |
0 |
20 |
36.35458 |
|
Wc |
2.379626 |
4.722685 |
2 |
31 |
67.95668 |
|
modeCodeVal |
-24.3663 |
591.7619 |
17 |
13 |
0.282783 |
|
txRsp |
-8.69845 |
73.66835 |
8.5 |
8.5 |
0.907073 |
|
txSts |
-0.58344 |
-1.00942 |
6 |
6 |
3.289346 |
|
rxRsp |
0 |
0 |
8.5 |
0 |
0 |
|
rxSts |
-0.00579 |
-1.59076 |
5 |
5 |
2.786449 |
|
dw0 |
1.552994 |
1.336516 |
0 |
47 |
157.6272 |
|
dw1 |
-0.759 |
-1.42304 |
11 |
11 |
26.41443 |
|
dw2 |
-1.09264 |
-0.62502 |
19 |
19 |
52.16003 |
|
dw3 |
-1.19516 |
-0.3292 |
26 |
26 |
94.19917 |
|
dw4 |
-2.01009 |
2.580657 |
20 |
20 |
38.30193 |
|
dw5 |
-1.15126 |
-0.38477 |
12 |
12 |
18.67084 |
|
dw6 |
-1.3204 |
0.019284 |
20 |
20 |
53.94966 |
|
dw7 |
-1.57751 |
1.229838 |
13 |
13 |
17.25815 |
|
dw8 |
-0.96041 |
-1.07694 |
11 |
11 |
24.56234 |
|
dw9 |
-2.78109 |
5.734853 |
1 |
1 |
0.085229 |
|
dw10 |
-2.78109 |
5.734853 |
1 |
1 |
0.085229 |
|
dw11 |
-2.78109 |
5.734853 |
1 |
1 |
0.085229 |
|
dw12 |
-2.78109 |
5.734853 |
1 |
1 |
0.085229 |
|
dw13 |
-2.78109 |
5.734853 |
1 |
1 |
0.085229 |
|
dw14 |
-2.78109 |
5.734853 |
1 |
1 |
0.085229 |
|
dw15 |
-2.78109 |
5.734853 |
1 |
1 |
0.085229 |
|
dw16 |
-2.78109 |
5.734853 |
1 |
1 |
0.085229 |
|
dw17 |
-2.78109 |
5.734853 |
1 |
1 |
0.085229 |
|
dw18 |
-2.78109 |
5.734853 |
1 |
1 |
0.085229 |
|
dw19 |
-2.78109 |
5.734853 |
1 |
1 |
0.085229 |
|
dw20 |
-3.35466 |
9.254449 |
1 |
1 |
0.065565 |
|
dw21 |
-3.35466 |
9.254449 |
1 |
1 |
0.065565 |
|
dw22 |
-3.35466 |
9.254449 |
1 |
1 |
0.065565 |
|
dw23 |
-3.35466 |
9.254449 |
1 |
1 |
0.065565 |
|
dw24 |
-3.35466 |
9.254449 |
1 |
1 |
0.065565 |
|
dw25 |
-3.35466 |
9.254449 |
1 |
1 |
0.065565 |
|
dw26 |
-3.35466 |
9.254449 |
1 |
1 |
0.065565 |
|
dw27 |
-3.35466 |
9.254449 |
1 |
1 |
0.065565 |
|
dw28 |
-3.35466 |
9.254449 |
1 |
1 |
0.065565 |
|
dw29 |
-3.35466 |
9.254449 |
1 |
1 |
0.065565 |
|
dw30 |
-3.35466 |
9.254449 |
1 |
1 |
0.065565 |
|
dw31 |
-3.35466 |
9.254449 |
1 |
1 |
0.065565 |
|
Gap |
2.542136 |
4.462845 |
14 |
249968 |
5.89E+09 |
|
msgTime |
2.049213 |
3.352466 |
65 |
667 |
29916.96 |
|
Class |
-6.83715 |
44.74991 |
1 |
1 |
0.019708 |
|
attack_type |
-2.69207 |
6.426248 |
6 |
6 |
1.389317 |
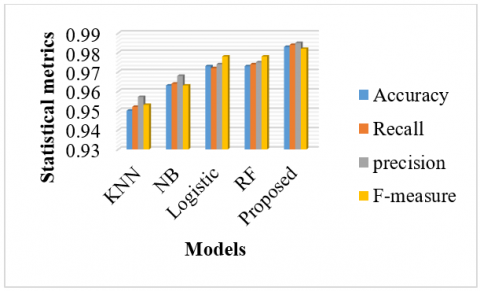
The graph illustrates the evaluation outcomes of various machine learning models applied to a cyber threat dataset. The evaluation metrics employed include Accuracy, Recall, Precision, and F-measure. Among the models tested, the proposed model demonstrated the highest overall performance, achieving an Accuracy of 0.985, as well as impressive scores for Recall, Precision, and F-measure. These results indicate that the proposed model exhibits strong predictive capabilities, effectively identifying patterns and making accurate predictions on the dataset.
Table 1 describes the statistical analysis of each feature for data processing.
Figure 2 illustrates the statistical accuracy, precision, recall and F-measure on input training dataset.
Figure 2. Statistical performance metrics and its analysis on cyber threat dataset
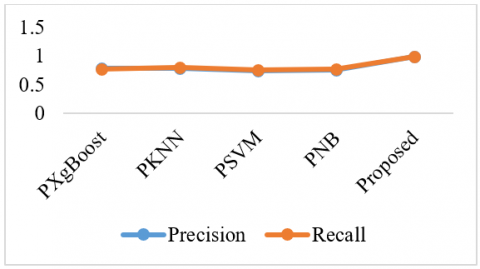
Figure 3. Statistical performance metrics and its analysis on cyber threat dataset with large data size
Figure 3 shows the results of the classification recall, precision achieved using this proposed technique on N-BaIoT dataset. The X-axis of the graph would represent the different techniques or methods used, while the Y-axis would display the classification precision, recall on N-BaIoT stat data.
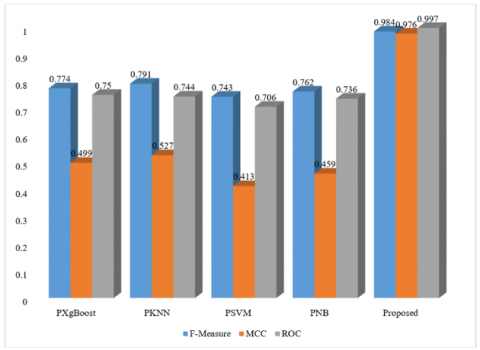
Figure 4 shows the results of the classification F-measure, MCC, ROC achieved using this proposed technique on N-BaIoT dataset. The X-axis of the graph would represent the different techniques or methods used, while the Y-axis would display the classification F-measure, MCC, ROC on N-BaIoT stat data.
Network traffic data containing communication patterns between IoT devices and external servers is collected for analysis.
Feature extraction focuses on identifying patterns indicative of C2 communication, such as unusual traffic volumes, frequency of connections, and communication protocols.
The model effectively detects and flags suspicious communication patterns consistent with C2 activity.
By analyzing network traffic at scale, the model can identify potential C2 channels and alert network administrators to take proactive measures.
Figure 4. Statistical performance of F-measure, MCC and ROC on cyber threat dataset with large data size
Additional Experimental Cases:
Malware Propagation Detection:
Experimentally simulate scenarios where IoT devices become infected with malware and attempt to propagate the infection within the network.
Evaluate the model's performance in detecting malware propagation attempts based on network behavior and communication patterns.
Data Exfiltration Detection:
Investigate the model's effectiveness in identifying unauthorized data exfiltration attempts from IoT devices.
Analyze network traffic to detect anomalies indicative of data exfiltration, such as unusual data transfer rates and destination IP addresses.
Zero-Day Exploit Detection:
Explore the model's capability to detect previously unseen or zero-day exploits targeting IoT devices.
Utilize techniques such as anomaly detection and behavioral analysis to identify suspicious activities that deviate from normal network behavior.
By identifying and addressing these limitations, we aim to provide a comprehensive understanding of the model's strengths and weaknesses.
1. Sensitivity to Feature Selection:
Limited Feature Set:
The effectiveness of the model heavily relies on the selection of informative features. If crucial features related to emerging attack vectors are not included or adequately represented in the dataset, the model may fail to detect novel or sophisticated cyberattacks.
Feature Engineering Challenges:
Extracting meaningful features from raw network traffic data can be challenging, especially when dealing with encrypted or obfuscated communication protocols. In such cases, feature engineering techniques may not capture subtle variations indicative of malicious activity, leading to false negatives or reduced detection accuracy.
2. Generalization to New Attack Patterns:
Limited Training Data:
The model's ability to generalize to previously unseen attack patterns is constrained by the availability and diversity of training data. If the training dataset predominantly consists of known attack types or lacks representation of emerging threats, the model may struggle to adapt to novel attack scenarios.
Transferability to Real-World Environments:
While the model may demonstrate high performance under controlled experimental conditions, its efficacy in real-world IoT environments with heterogeneous network architectures and dynamic traffic patterns remains uncertain. Factors such as network congestion, device heterogeneity, and environmental noise could impact the model's performance in practice.
IoT devices and networks play a crucial role in the Internet but have security weaknesses and vulnerabilities. Most widely-used IoT devices lack security design, making them vulnerable to recent attacks that exploit these weaknesses and recruit the devices to cause severe harm. In this work, a cluster based classification approach was proposed for detecting IoT bot cyberattacks. The proposed method achieved good results in terms of accuracy, precision, recall and F1-score, compared to traditional methods. To mitigate the threat posed by IoT bot cyberattacks, we proposed a cluster-based classification approach tailored specifically for detecting such malicious activities. Our method leverages clustering techniques to identify patterns indicative of botnet behavior within IoT network traffic. Through comprehensive experimentation and evaluation, we have demonstrated the efficacy of our approach in detecting IoT bot cyberattacks in real-time.
The results of our study indicate that the proposed cluster-based classification approach outperforms traditional methods in terms of accuracy, precision, recall, and F1-score. By effectively identifying and classifying IoT bot cyberattacks, our method offers a promising solution for enhancing the security of IoT devices and networks.
Future scope in IoT cybersecurity includes refining detection with AI, implementing real-time monitoring, enforcing stringent device security standards, and establishing collaborative defence mechanisms for information sharing among stakeholders.
[1] Ahmetoglu, H., Das, R. (2022). A comprehensive review on detection of cyber-attacks: Data sets, methods, challenges, and future research directions. Internet of Things, 20: 100615. https://doi.org/10.1016/j.iot.2022.100615
[2] Sufi, F. (2023). A global cyber-threat intelligence system with artificial intelligence and convolutional neural network. Decision Analytics Journal, 9: 100364. https://doi.org/10.1016/j.dajour.2023.100364
[3] Bitirgen, K., Filik, Ü.B. (2023). A hybrid deep learning model for discrimination of physical disturbance and cyber-attack detection in smart grid. International Journal of Critical Infrastructure Protection, 40: 100582. https://doi.org/10.1016/j.ijcip.2022.100582
[4] Jeffrey, N., Tan, Q., Villar, J.R. (2024). A hybrid methodology for anomaly detection in Cyber-Physical Systems. Neurocomputing, 568: 127068. https://doi.org/10.1016/j.neucom.2023.127068
[5] Tavella, F., Giaretta, A., Conti, M., Balasubramaniam, S. (2022). A machine learning-based approach to detect threats in bio-cyber DNA storage systems. Computer Communications, 187: 59-70. https://doi.org/10.1016/j.comcom.2022.01.023
[6] Noor, U., Anwar, Z., Amjad, T., Choo, K.K.R. (2019). A machine learning-based FinTech cyber threat attribution framework using high-level indicators of compromise. Future Generation Computer Systems, 96: 227-242. https://doi.org/10.1016/j.future.2019.02.013
[7] Dey, A.K., Gupta, G.P., Sahu, S.P. (2023). A metaheuristic-based ensemble feature selection framework for cyber threat detection in IoT-enabled networks. Decision Analytics Journal, 7: 100206. https://doi.org/10.1016/j.dajour.2023.100206
[8] Imran, M., Siddiqui, H.U.R., Raza, A., Raza, M.A., Rustam, F., Ashraf, I. (2023). A performance overview of machine learning-based defense strategies for advanced persistent threats in industrial control systems. Computers & Security, 134: 103445. https://doi.org/10.1016/j.cose.2023.103445
[9] Al-Hawawreh, M., Hossain, M.S. (2023). A privacy-aware framework for detecting cyber attacks on internet of medical things systems using data fusion and quantum deep learning. Information Fusion, 99: 101889. https://doi.org/10.1016/j.inffus.2023.101889
[10] Jamal, A.A., Majid, A.A.M., Konev, A., Kosachenko, T., Shelupanov, A. (2023). A review on security analysis of cyber physical systems using Machine learning. Materials Today: Proceedings, 80(3): 2302-2306. https://doi.org/10.1016/j.matpr.2021.06.320
[11] Akhter, A., Acharjee, U.K., Talukder, M.A., Islam, M.M., Uddin, M.A. (2023). A robust hybrid machine learning model for Bengali cyber bullying detection in social media. Natural Language Processing Journal, 4: 100027. https://doi.org/10.1016/j.nlp.2023.100027
[12] Alani, M.M., Mauri, L., Damiani, E. (2023). A two-stage cyber attack detection and classification system for smart grids. Internet of Things, 24: 100926. https://doi.org/10.1016/j.iot.2023.100926
[13] Jahromi, A.N., Karimipour, H., Dehghantanha, A. (2023). An ensemble deep federated learning cyber-threat hunting model for Industrial Internet of Things. Computer Communications, 198: 108-116. https://doi.org/10.1016/j.comcom.2022.11.009
[14] Yazdinejad, A., Kazemi, M., Parizi, R.M., Dehghantanha, A., Karimipour, H. (2023). An ensemble deep learning model for cyber threat hunting in industrial internet of things. Digital Communications and Networks, 9(1): 101-110. https://doi.org/10.1016/j.dcan.2022.09.008
[15] Noor, Z., Hina, S., Hayat, F., Shah, G.A. (2023). An intelligent context-aware threat detection and response model for smart cyber-physical systems. Internet of Things, 23: 100843. https://doi.org/10.1016/j.iot.2023.100843
[16] Abirami, A., Palanikumar, S. (2023). BBBC-DDRL: A hybrid big-bang big-crunch optimization and deliberated deep reinforced learning mechanisms for cyber-attack detection. Computers and Electrical Engineering, 109: 108773. https://doi.org/10.1016/j.compeleceng.2023.108773
[17] Aygul, K., Mohammadpourfard, M., Kesici, M., Kucuktezcan, F., Genc, I. (2024). Benchmark of machine learning algorithms on transient stability prediction in renewable rich power grids under cyber-attacks. Internet of Things, 25: 101012. https://doi.org/10.1016/j.iot.2023.101012
[18] Jiang, T., Shen, G., Guo, C., Cui, Y., Xie, B. (2023). BFLS: Blockchain and federated learning for sharing threat detection models as cyber threat intelligence. Computer Networks, 224: 109604. https://doi.org/10.1016/j.comnet.2023.109604
[19] Guarascio, M., Cassavia, N., Pisani, F.S., Manco, G. (2022). Boosting Cyber-Threat Intelligence via Collaborative Intrusion Detection. Future Generation Computer Systems, 135: 30-43. https://doi.org/10.1016/j.future.2022.04.028
[20] Alshehri, M., Abugabah, A., Algarni, A., Almotairi, S. (2022). Character-level word encoding deep learning model for combating cyber threats in phishing URL detection. Computers and Electrical Engineering, 100: 107868. https://doi.org/10.1016/j.compeleceng.2022.107868
[21] Lin, P.C., Hsu, W.H., Lin, Y.D., Hwang, R.H., Wu, H.K., Lai, Y.C., Chen, C.K. (2023). Correlation of cyber threat intelligence with sightings for intelligence assessment and augmentation. Computer Networks, 228: 109736. https://doi.org/10.1016/j.comnet.2023.109736
[22] Racherache, B., Shirani, P., Soeanu, A., Debbabi, M. (2023). CPID: Insider threat detection using profiling and cyber-persona identification. Computers & Security, 132: 103350. https://doi.org/10.1016/j.cose.2023.103350
[23] Chen, T.M., Zeng, H., Lv, M.Q., Zhu, T.T. (2024). CTIMD: Cyber threat intelligence enhanced malware detection using API call sequences with parameters. Computers & Security, 136: 103518. https://doi.org/10.1016/j.cose.2023.103518
[24] Admass, W.S., Munaye, Y.Y., Diro, A.A. (2024). Cyber security: State of the art, challenges and future directions. Cyber Security and Applications, 2: 100031. https://doi.org/10.1016/j.csa.2023.100031
[25] Yockey, P., Erickson, A., Spirito, C. (2023). Cyber threat assessment of machine learning driven autonomous control systems of nuclear power plants. Progress in Nuclear Energy, 166: 104960. https://doi.org/10.1016/j.pnucene.2023.104960
[26] Irshad, E., Siddiqui, A.B. (2023). Cyber threat attribution using unstructured reports in cyber threat intelligence. Egyptian Informatics Journal, 24(1): 43-59. https://doi.org/10.1016/j.eij.2022.11.001