Yusuke Kasahara* | Akihito Ito | Nobutaka Tsujiuchi | Hirosuke Horii | Keisuke Kitano
© 2020 IIETA. This article is published by IIETA and is licensed under the CC BY 4.0 license (http://creativecommons.org/licenses/by/4.0/).
OPEN ACCESS
During the construction planning of a large structure, such as a building or underground area, evacuation plans for disaster response are pre-examined by investigating the efficiency of an evacuation route or the safety of the floor plan. However, a pre-examined evacuation plan is not sufficient for disaster preparedness, since situations on the evacuation route may dynamically change due to blockage by obstacles or congestion by the concentration of evacuees. We therefore proposed an adaptive evacuation guide sign that monitors the disaster and evacuation situations in real time, and controls the evacuation direction dynamically. In the literature, fundamental evaluations of the proposed system have previously been performed using a discrete element method (DEM)-based evacuation simulation in limited small area. In this paper, we enlarge the simulation area based on an actual underground area floor plan and demonstrate the effectiveness of our proposed system with an evacuation simulation.
discrete element method, evacuation simulation, evacuation guide sign
Japan is one of the most earthquake-prone countries in the world, with a high probability of future disasters such as the Great East Japan Earthquake of March 2011. When natural disasters occur, we can expect that pedestrian congestion during evacuation from a building or an underground area; thus, the issue of how to guide people to an exit is very important. Buildings must be constructed after fully considering disaster countermeasures, and evacuation simulations are necessary to establish an evacuation plan before construction. In this study, since the force acting on people can be evaluated quantitatively, we modelled humans using the discrete element method (DEM).
Evacuation guide signs are installed in buildings and underground areas to enable people to evacuate smoothly without getting lost or misdirected. However, there are problems with conventional guide signs including low recognition rate, so it is a difficult to say that they function sufficiently. Therefore, Horii et al. [1] proposed adaptive evacuation guide signs that change the evacuation direction guidance by constantly feeding back the degree of congestion. The purpose of this study is to verify the effectiveness of this adaptive evacuation guide signs system by improving the system and performing a simulation using an actual facility as a model.
2.1 Discrete Element Method
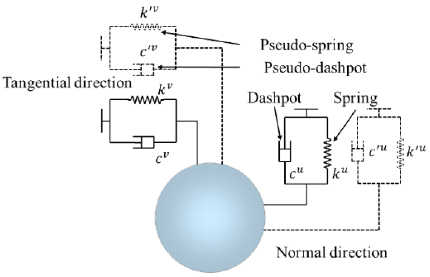
To quantitatively understand the complex situations that can occur during evacuation, we adopted the discrete element method (DEM), which analyses by focusing on individual elements. Figure 1 shows the model used in DEM. DEM is a method that determines the position of each element at the current time by creating equations of motion for each element, assuming that the force transmission between elements is performed by springs and dashpots at the contact points. One spring and one dashpot are installed in each tangential and normal direction. (Pseudo springs and Pseudo dashpots are explained in Section 2.2.) The spring constant and damping constant in the tangential direction are $k^{v}$ and $c^{v},$ and those in the normal direction are $k^{u}$ and $c^{u}$. If the mass of the p-th element is $m_{p}$ and the displacement of this in the $\mathrm{x}$ and $\mathrm{y}$ directions is $x_{p}$ and $y_{p}$, the equations of motion are
$m_{p} \ddot{x}_{p}(t)=f_{p}^{x}(t)$ (1)
$m_{p} \ddot{y}_{p}(t)=f_{p}^{y}(t)$ (2)
Here, $f_{p}^{x}$ and $f_{p}^{y}$ are the resultant forces in the x and y directions acting on the p-th element. These consist of resistant force of the elastic spring of spring constant k, resistant force of the dashpot of damping constant c, and the individual’s thrust force. By integrating e.g. Eq. (1). and (2)., we obtain the velocity and displacement at t.
2.2 Human modelling by DEM with Pseudo springs and Pseudo dashpots
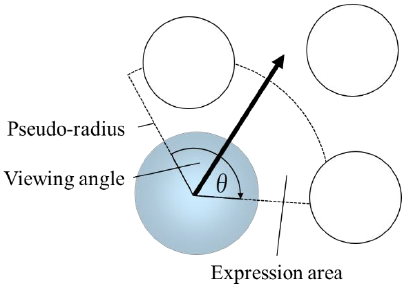
In this study, we introduce Pseudo springs and Pseudo dashpots to represent the human expression area. We set the expression area as shown in Figure 2. This is determined from the Pseudo radius and Viewing angle θ. Humans tend to maintain a certain distance to avoid physical contact when moving. We call this psychological distance the Pseudo radius. When other elements invade this area, we assume that the force transmission of avoidance between elements is performed by the Pseudo springs and Pseudo dashpots.
Figure 1. Models used in DEM
Figure 2. Expression area
Furthermore, each element in the DEM model has one target point to go to and moves with the force toward it. The force toward the target point is defined as the individual’s thrust force. Each element is accelerated by this force until the walking velocity reaches the limit velocity set individually, and when the contact between each element occurs and decelerates, it accelerates again to the limit velocity.
Based on the above, we calculate the equation of motion for a human being modelled at each minute time step. First, the initial arrangement is performed, the target position and maximum velocity of each element are set, and the acting force is calculated. Regarding the acting force, contact determination is performed first and then determination is performed in the expression area. Then, the acceleration is obtained from the applied force and each element move.
3.1 Adaptive evacuation guide sign
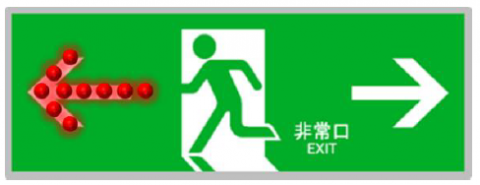
In this study, we propose a new evacuation guidance algorithm for smooth evacuation. Evacuation guide signs indicating an evacuation route are generally installed in buildings. Figure 3 shows a conventional evacuation guide sign. This is a static evacuation guide sign showing only a certain direction. However, a study by Onishi et al. [2] shows that less than 15% of people evacuate a building following the indication on the evacuation guide sign. In addition, since real-time evacuation situations cannot be taken into account with conventional evacuation guide signs, overall evacuation time could increase remarkably when many people concentrate on a specific exit and stay there. Thus, it is difficult to say that conventional evacuation guide signs function sufficiently.
For efficient evacuation guidance, we propose adaptive evacuation guide signs that can change the evacuation direction by constantly feeding back the congestion status of the evacuation route and its associated evacuation guidance algorithm. Our proposed evacuation guide sign that dynamically switches the evacuation direction by feeding back the exit evacuation situation is shown in Figure 4. The purpose of this study is to verify the effectiveness of the proposed guidance algorithm by simulation.
Figure 3. Conventional evacuation guide sign
Figure 4. Proposed adaptive evacuation guide sign
3.2 Recognition area of adaptive evacuation guide sign
We obtained the recognition area of the adaptive evacuation guide signs from Horii et al. [1]. In addition, Edwin et al. [3] proved that by combining dynamically changing guide signs and evacuation voice prompts, the probability that people will recognize and follow the guide signs can be increased to 66%. Therefore, in this simulation, we assume that 66% of the people will follow the guide signs when entering the area.
3.3 Induction index using flow coefficient
Horii et al. [1] changed the direction of the guide signs using the exit density as a threshold, but this does not take into account the exit’s processing capacity. For this reason, it is thought that congestion cannot be prevented in facilities where exits of various widths coexist. Therefore, a guidance index using the flow coefficient is set as the threshold value. The flow coefficient is an index that expresses how many people can pass per unit time per unit width of space. In this simulation, the flow coefficient at each exit is calculated per unit time. The set threshold is represented by the following equation.
$E_t=\frac {N(t)}{e\times C(t)}$ (3)
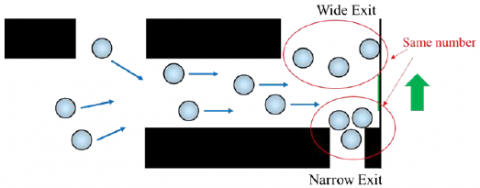
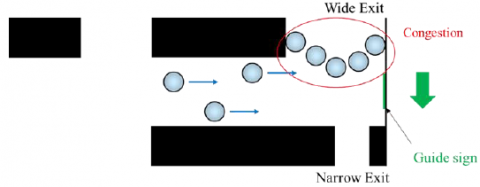
Here, t is the time [s], N is the number of people at the exit [person], e is the unit area [m2] of the exit, and C is the flow coefficient [person / [m2]· s]. Et is the time when all people at the exit at time t complete the evacuation. This Et is calculated for each exit and fed back each unit time. The direction of the evacuation is then switched to the exit with a small Et, achieving adaptive evacuation guide signs that perform smooth evacuation guidance. We use the situation shown in Figure 5 as an example. Figure 5 shows a passage with one wide exit and one narrow exit. People first go to the evacuation guide sign. In (a), the same number of people stay at both exits. However, because the exit width is different, the calculated Et is smaller for the Wide Exit. Therefore, the direction of the guide sign faces the Wide Exit. People that enter the recognition area of the evacuation guide sign move according to the guidance issued by the evacuation guide sign. In (b), people guided in (a) cause congestion at the Wide Exit. Therefore, the direction of the guide sign faces the Narrow Exit.
(a) The same number of people stay at both exits
(b) Congestion occurs at the Wide Exit
Figure 5. Example of switching of evacuation direction indication
4.1 Simulation conditions
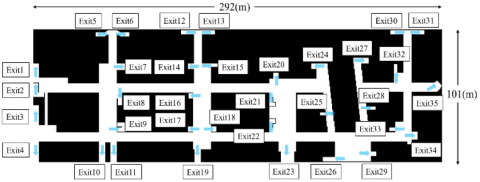
In order to verify the effectiveness of the proposed adaptive evacuation guide signs, we performed a simulation by reproducing actual facilities. We used the “Kyoto Station Underground Mall Porta” (Kyoto Porta), a commercial facility that has publicly disclosed on the Internet the route dimensions and conditions when evacuation simulations are conducted by the operating company. Figure 6 shows the layout of the simulation built using this as a model. The blue arrow in Figure 6 indicates the escape direction. We used Kyoto Porta to simulate the conventional guide signs and the adaptive evacuation guide signs five times each. The evacuation simulations were carried out with two guide policies. In Policy A, conventional evacuation guide signs are installed. In Policy B, adaptive evacuation guide signs were installed. In the case of the conventional guide signs, all people were evacuated to the nearest exit. Table 1 shows the simulation conditions. We used the number of people described in the Kyoto Porta underground area disaster prevention promotion plan [4]. Table 2 shows the parameter values for the model used in the simulation, which are the parameters used by Kiyono et al. [5]; however, the radius of the expression area was determined by Kasahara et al. [6].
Table 1. Simulation conditions
|
Total number of evacuees |
7799 (persons) |
|
Number of exits |
35 |
|
Detection rate of evacuation sign |
66 (%) |
|
Particle radius |
r(m) |
2.15´10-1 |
|
Particle mass |
m(kg) |
6.00´101 |
|
Maximum moving velocity |
Vmax(m/s) |
1.3~3.6 |
|
Self-drive force |
ff(N) |
1.62´102 |
|
Calculation time step |
$\Delta t(s)$ |
1.00´10-2 |
|
Viewing angle |
θ (°) |
100 |
|
Physical normal spring constant |
ku(N/m) |
8.18´103 |
|
Physical tangential spring constant |
kv(N/m) |
4.09´102 |
|
Physical normal damping constant |
cu(N/m) |
1.10´103 |
|
Physical tangential damping constant |
cv(N/m) |
2.47´102 |
|
Pseudo normal spring constant |
$k^{\prime u}(N / m)$ |
5.00´101 |
|
Pseudo tangential spring constant |
$k^{\prime v}(N / m)$ |
2.50´100 |
|
Pseudo normal damping constant |
$c^{\prime u}(N / m)$ |
8.64´101 |
|
Pseudo tangential damping constant |
$k^{\prime v}(N / m)$ |
1.93´101 |
Figure 6. Simulation layout
4.2 Setting of adaptive evacuation guide signs
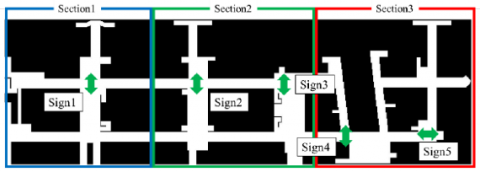
Figure 7 shows the position of the adaptive evacuation guide signs to be installed. This position was determined from the location where congestion occurred as a result of the conventional guide signs simulation. Also, as shown in Figure 7, Kyoto Porta handled in this study is a large facility, so we consider it in sections for convenience. Table 3 shows the exit combinations guided by the adaptive evacuation guide signs, the threshold Et shown in Section 3.3 for each exit shown in Table 3, and the guide to the exit with a smaller value.
Figure 7. Position of adaptive evacuation guide sign
Table 3. Combination of exits guided by guide sign
|
Sign number |
Exit number |
|
Sign 1 |
Exit7, Exit8 |
|
Sign 2 |
Exit14, Exit16 |
|
Sign 3 |
Exit20, Exit21 |
|
Sign 4 |
Exit25, Exit26 |
|
Sign 5 |
Exit33, Exit34 |
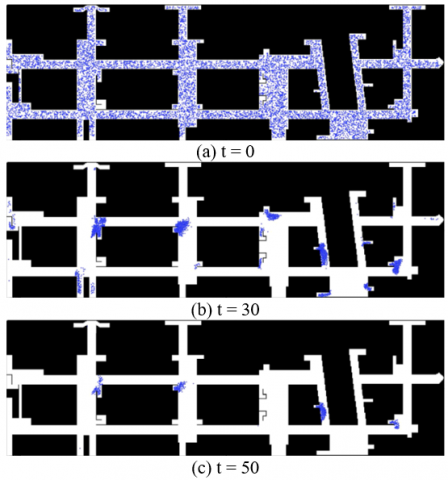
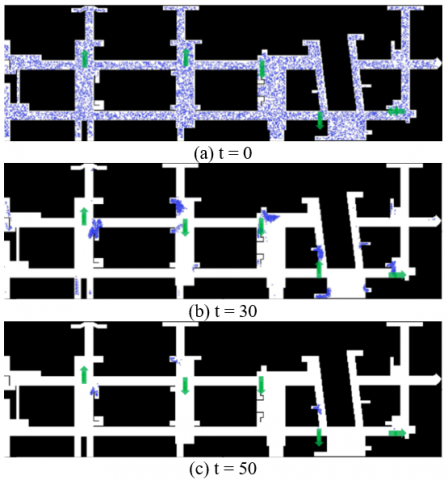
Table 4 shows the evacuation completion time for Policy A and Policy B. We applied a 1-tailed 2-sample t-test (Welch) to the conventional method and the proposed method. As a result, the p-value is smaller than the significant value of 0.05. The adaptive evacuation guide signs are shown to be superior to the conventional evacuation guide signs. Figure 8 and 9 show the evacuation simulation of 0, 30, and 50 seconds. At 30 seconds, both Policy A and Policy B have congestion of the same scale. However, at 50 seconds, Policy B has fewer people. This is because people were guided to the wider exit in Policy B.
Table 4. Evacuation completion time
|
|
Policy A[sec] |
Policy B[sec] |
|
Trial 1 |
87 |
65 |
|
Trial 2 |
87 |
66 |
|
Trial 3 |
83 |
68 |
|
Trial 4 |
83 |
66 |
|
Trial 5 |
80 |
66 |
Figure 8. Evacuation situation of Policy A
Figure 9. Evacuation situation of Policy B
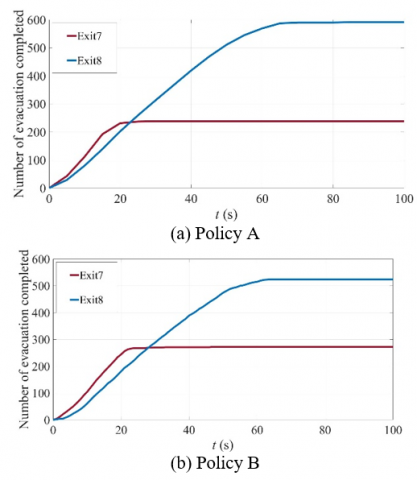
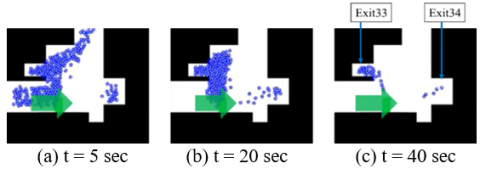
Figure 10 thru 12 show the time course of the number of people evacuated from the exit guided by the adaptive evacuation guide signs for each section of Trial 1; (a) in each figure shows the case with the conventional evacuation guide signs, and (b) shows the case with the adaptive evacuation guide signs. As demonstrated in (a), there is a large difference in the number of people between the exit where the congestion occurs and the exit nearby. In other words, there is congestion at the exit with a large number of people. However, as shown in (b), the people who stayed by the adaptive evacuation guide signs were distributed to nearby exits, and the difference in the number of people at each exit is small. At Exit 34 in Figure 12 (b), people flow through intermittently. Figure 13 shows the evacuation situations of Exit 33 and Exit 34, proving that this is a phenomenon that occurs as a result of people following the guide signs.
Figure 10. Number of evacuations completed (Section 1)
Figure 11. Number of evacuations completed (Section 2)
Figure 12. Number of evacuations completed (Section 3)
It can also be seen that the evacuation completion time is shortened as a result of the control of congestion. Without the adaptive evacuation guide signs, about 1% of all people completed evacuation within this shortened time. In other words, in the case of Kyoto Porta, by introducing adaptive evacuation guide signs, an escape delay of 1% of the people can be prevented, thus proving the effectiveness of the adaptive evacuation guide signs.
Figure 13. Evacuation situation of Exit33 and Exit34
In this study, we improved the adaptive evacuation guide signs proposed by Horii et al. using an index based on the flow coefficient and verified the effectiveness of this adaptive evacuation guide signs system using actual facilities as a model. This system was able to suppress the occurrence of congestion at specific exits and shorten the overall evacuation completion time. Furthermore, 1% of all escape delays could be prevented. In this study, the installation position of the adaptive evacuation guide signs was determined by trial and error from the simulation results. Therefore, if a more optimal installation position determination method is established, the evacuation completion time can be further shortened. In addition, psychological factors, such as the synchrony of people in an emergency, must also be considered.
[1] Horii, H., Ito, A., Tsujiuchi, N., Fukuda, T., Kasahara, Y. (2019). Fundamental study of an adaptive evacuation guide sign by using a discrete element method-based simulation, WIT Transactions on Engineering Sciences, 125: 143-150. http://dx.doi.org/10.2495/CMEM190141
[2] Onishi, M., Yamashita, T., Hoshikawa, T., Sato, K., (2015). Transmission of knowledge for evacuation drill using pedestrian tracking and simulation –example of opera concert with evacuation drill in new national theatre Tokyo–, SIG-KST-026-06, 2015, (in Japanese).
[3] Galea, E.R., Xie, H., Deere, S., Cooney, D., Filippidis, L. (2017). Evacuation the effectiveness of an improved active dynamic signage system using full scale evacuation trials. Fire Safety Journal, 91: 908-917. https://doi.org/10.1016/j.firesaf.2017.03.022
[4] Online sources: Kyoto Station underground mall Porta underground area disaster prevention promotion plan; KYOTO STATION CENTER CO. LTD, http://www.porta.co.jp/front/img/pdf/bousaisuisinkeikaku.pdf, accessed on 5 May. 2019, (in Japanese).
[5] Kiyono, J., Miura, F., Takimoto, K. (1996). Simulation of emergency evacuation behaviour during disaster by using distinct element method, (in Japanese). Journal of Japan Society of Civil Engineers, 537: 233-244. https://doi.org/10.2208/jscej.1996.537_233
[6] Kasahara, Y., Ito, A., Tsujiuchi, N., Fukuda, T., Horii, H. (2018). Introduction of evasive behaviour according to the velocity of movement to pedestrian model in evacuation simulation. JSME Annual Meeting, 18-1, (in Japanese). https://doi.org/10.1299/jsmemecj.2018.G1000906