Dubey Dhanraj![]() | Deepali Vora*
| Deepali Vora*![]() | Pranav Naik
| Pranav Naik![]()
© 2023 IIETA. This article is published by IIETA and is licensed under the CC BY 4.0 license (http://creativecommons.org/licenses/by/4.0/).
OPEN ACCESS
In response to the rapid urbanization and housing demands, there has been a shift from traditional courtyards to multi-story city structures. Unfortunately, this transition can significantly affect the local climate and overall comfort due to increased heat. To overcome these challenges, our proposed approach suggests implementing multi-objective optimization techniques to strike a balance between various competing goals. These goals may encompass outdoor thermal comfort, energy efficiency, and urban sustainability when designing urban courtyard blocks. This study has many potential benefits for sustainable living and aligns with several Sustainable Development Goals (SDGs) like Energy Efficiency (SDG 7 - Affordable and Clean Energy), Sustainable Cities and Communities (SDG 11 - Sustainable Cities and Communities) and Good Health - Well-being (SDG 3 - Good Health and Well-being). The outcomes from this paper will help reduce the effects of climate change by making a positive contribution to sustainable development. This research aims to anticipate the cooling load per unit area (cooling/m2) of buildings in hot arid zones based on building features such as overall height, orientation, and other considerations of buildings. The deep learning algorithms used are MLP Regressor, RNN LSTM, and RBFN. This research aims to create a model to properly forecast cooling load per unit area and provide insights into the best building design for lowering cooling loads in hot arid zones. RBFN outperformed MLP Regressors and RNN LSTM in forecasting cooling rates in urban courtyard blocks, according to the findings.
deep learning, optimization, cooling rates, urban sustainability, heat transfer, courtyards, sustainable design
Because of the increasing urbanization and the growing demand for energy-efficient and sustainable urban design, the optimization of modern courtyard blocks in dry and tropical locations has received much attention. Urban areas in hot arid regions confront significant problems, such as high temperatures and increased energy demand for cooling, making it critical to create design solutions that provide acceptable living conditions while reducing energy consumption [1].
There has been an extraordinary surge of urbanization in these locations, leading to a considerable increase in housing demand. This urban expansion has resulted in the replacement of traditional courtyards with high-rise structures, which has had a significant impact on the local temperature and outdoor comfort. For example, figures show that typical energy usage for cooling in these areas has increased by 20-30% approximately in the last decade alone. Similarly, urbanization has reduced traditional courtyard spaces by 10-20%, worsening the problem of outdoor thermal comfort [2]. In recent years, the use of multi-objective optimization techniques and deep learning in modern courtyard design has grown in popularity. Authors Ibrahim et al. [2] have made significant advances in applying multi-objective optimization to balance competing design goals. Our research expands on this by diving into the specific context of predicting cooling rates and the unique parameters on which they depend.
Our study will test the following hypothesis: “By optimizing the design elements of contemporary courtyard sections, it is possible to achieve a balance between thermal comfort in hot desert environments." We want to find the best combinations of factors like, direction, wall and roof area, overall height, age, and cooling load per unit area of the building by using deep learning algorithms to improve living conditions while lowering energy consumption. By exploring diverse design parameters, designers can use this deep learning model to identify the optimal combination that maximizes these objectives. Deep learning algorithms use an optimisation algorithm that helps the network maximize or minimize an objective function depending on the use case [3]. This study focuses on the large area of urban courtyard blocks and their optimization. By comprehensively analyzing existing research in the field of cooling optimization within urban courtyard blocks, this study plays a vital role in the following ways:
Guiding Urban Planners and Designers: Urban planners and designers take responsibility for shaping the cities of tomorrow. They focus on creating urban environments that are not only functional but also resilient to the challenges posed by a changing climate [4].
Advancing Strategies for Thermal Comfort and Energy Efficiency: It is very important to make cities cool and energy efficient. In this research various publications were studied to filter the ones that were most relevant to courtyard optimization. This can help researchers and architects to create constructions in a way that consumes less energy and is better for the environment [5].
Identifying Research Gaps and Fostering Collaboration: The problems caused by urban heat are a lot and complex, and hence, this study carefully identifies the areas where more research is required. These areas are opportunities for further exploration of new ideas, innovation, and creativity. If such identified research gaps are looked upon in a collaborative manner, solving problems related to urban heat and efficiency would become easier [6].
Contributing to Cooler, More Sustainable Urban Environments: It is very important to propose evidence-based studies on critical issues where the cities face adverse effects of climate change every day. These strategies should be proposed so that urban environments are not only cooler but also comfortable [7]. We, in this research, focus on such strategies. The basic correlation of the previous description is explained in Figure 1.
Figure 1. Significance of study
Through this research, we hope to provide valuable insight to the design and optimization of courtyard segments, ultimately leading to enhanced thermal comfort, lower energy usage, and significant economic and environmental benefits in these difficult environments.
The optimization of courtyard blocks in high temperature regions presents a complex undertaking that involves balancing multiple competing design objectives. Recent research has shown the effectiveness of deep learning techniques in enhancing design goals, heating performance, and energy efficacy in urban courtyard blocks. These proposed frameworks based on deep learning have exhibited promising outcomes, holding the potential to transform urban planning practices in hot and arid zones. Nonetheless, further investigation is necessary to assess the reliability and scalability of these methodologies in the real-world.
Before searching for a comprehensive assessment of the existing literature related to city courtyard cooling, it's essential to set up a clean knowledge of key principles in this area.
1) Thermal Comfort: The concept of thermal comfort is fundamental to our discussion. It characterizes the psychological state of individuals about their satisfaction or dissatisfaction with the thermal environment in which they are situated. Factors contributing to thermal comfort include temperature, humidity, wind speed, and the interaction between these variables [8]. Ensuring thermal comfort is very important as it directly affects the overall well-being and productivity of the inhabitants of urban spaces.
2) Sustainable Design: Sustainable urban courtyard design aims to create environments that strike a balance between human habitation and environmental conservation. Its main objectives are to minimize the consumption of resources, reduce the ecological footprint, and raise the overall quality of life for the urban population. Sustainable design involves a multifaceted strategy, including optimizing energy efficiency, minimizing emissions, and promoting environmentally friendly practices [9]. The ultimate goal is to create urban courtyards that are environmentally responsible, economically viable, and socially rich.
3) Energy Efficiency: Energy efficiency constitutes a central tenet within the realm of urban courtyard design. This theory revolves around efforts to reduce energy consumption without compromising the functionality or performance of designed spaces. In the context of urban courtyards, achieving energy efficiency involves a careful analysis of building guidelines, material selection, and spatial layout. By reducing heating and cooling loads through judicious design decisions, energy-efficient urban courtyards can significantly contribute to sustainability goals, reduce urban heat island effects, and reduce pressure on energy resources [10].
The interconnectivity of these important key concepts is shown in Figure 2.
Figure 2. Interconnectivity of key concepts
Guedouh and Zemmouri [11] investigate the courtyard's impact on building morphology in the thermal and dazzling surroundings in hot and arid regions. They stress the importance of design aspects in increasing energy efficiency and occupant comfort through their study. Their findings show the potential of courtyard buildings in creating beneficial microclimates in arid environments, and they suggest that further improvements in the study can help to have accurate results.
Xu et al. [12] also use genetic deep learning algorithms to optimize the urban layout for improved microclimate performance in a cold region of China. The research considers optimization parameters that include courtyard design variables, building location, simulation settings, mechanical system, and thermal characteristics. They were able to optimize the microclimatic conditions by up to 80 percent. This happens because the optimized design creates more wind corridors and reduces the amount of heat that is trapped in the urban area.
Hasehzadeh Haseh, Khakzand, and Ojaghlou [13] investigate the best thermal characteristics of courtyards in the hot and desert climates of Isfahan. The authors investigate the effect of the courtyard design features on thermal performance, considering parameters such as shading, ventilation, and surface materials. The study provides valuable insights for architects and urban planners to enhance the heat comfort of courtyard spaces in arid regions. In a recent study, the authors M’Saouri El Bat et al. [14] propose a methodology to optimize the form of urban courtyards by combinaning outdoor zonal approach and building energy modeling. Their study demonstrates the possibility for combining multiple computational methodologies to enhance the efficacy of energy and thermal performance comfort of urban courtyard designs. The findings help to design sustainable urban planning techniques in arid regions, but this model doesn’t give us the exact magnitude of cooling rates or loads required in a courtyard if designed.
Khan et al. [15] focuses on the optimization of courtyard house design for passive cooling in hot, dry regions. Their study investigates the impact of design parameters, such as courtyard size, shape, and orientation, on cooling performance. By employing computer simulations and performance metrics, they offer design guidelines for achieving energy-efficient and comfortable living environments in arid climates. Ibrahim et al. [16] address the multi-objective optimization of city courtyard blocks in hot arid zones. The authors propose an optimization framework taking into account aspects such as thermal comfort, daylighting, and energy consumption. By further research and employing simulation techniques and genetic algorithms, they provide insights into designing sustainable and adaptive courtyard blocks in arid regions.
The papers examined within this research explore the use of optimization methods aimed at enhancing the thermal comfort of urban courtyards in diverse climatic contexts. These queries use a variety of optimization algorithms, including genetic algorithms, multi-objective evolutionary algorithms, and artificial neural networks. In addition, a range of datasets, including measurements, simulation-generated data, and historical records, serve as the foundation for these investigations. Findings from these studies underscore the effectiveness of optimization techniques for improving the thermal comfort experienced within urban courtyards.
3.1 Multilayer Perceptron (MLP)
Single hidden layer MLP with vector x as input, hidden layer activations h, output activations y, weight matrices W, and biases b where f1 shows the activation function for the layer that is hidden, f2 shows the activation function for the layer that is responsible for output, and * denotes matrix multiplication. These activation functions will decide whether or not to fire the neuron, and hence their inclusion is necessary.
$h=f_1\left(W_1 * x+b_1\right)$ (1)
$y=f_2\left(W_2 * h+b_2\right)$ (2)
3.2 Long Short-Term Memory (LSTM)
Long Short-Term Memory (LSTM): A single LSTM cell with input x, previously hidden state h(t-1), and hidden state h(t). Here, σ is the sigmoid activation function, * is matrix multiplication, [h(t-1), x] denotes the concatenation of h(t-1) and x along the feature dimension, and Wf, Wi, bf, bi represent the weight matrices and biases for the different gates and activations in the LSTM cell.
The forget gate is a neural network component that determines what information from the cell state should be discarded or retained for the current time step based on the input and previous hidden state. Following is the equation for the same.
Forget gate: $f_{(t)}=\sigma\left(W_f *\left[h_{(t-1)}, x\right]+b_f\right)$ (3)
The input gate is a neural network component that decides what new information should be added to the cell state for the current time step based on the input and previous hidden state. Following is the equation for the same.
Input gate: $i_{(t)}=\sigma\left(W_i *\left[h_{(t-l)} x\right]+b_i\right)$ (4)
The output gate is a neural network component that determines what information from the cell state should be exposed as the output for the current time step based on the input and previous hidden state. Following is the equation for the same.
Output gate: $o_{(t)}=\sigma\left(W_o *\left[ h_{(t-1)}, x\right]+b_o\right)$ (5)
3.3 Radial Basis Function Network (RBFN)
In these equations for the Radial Basis Function Network (RBFN) algorithm, φ(x) represents the radial basis function used to gauge the similarity between an input data point 'x' and a chosen center point 'μ' based on their Euclidean distance and the spread parameter 'σ.' 'Hi' signifies the output of an individual hidden neuron and is determined by applying the radial basis function to the input 'x' concerning the specific center 'μ.' The final network output, denoted as 'Output,' is obtained by taking a weighted sum of these hidden neuron outputs using weights 'Wi.' These weights learned during training, control the contribution of each hidden neuron to the network's ultimate prediction or response to the input data 'x'.
A Radial Basis Function (RBF) is an activation function that assigns higher output values for inputs closer to a center point in a high-dimensional space using a radial basis kernel. Following is the equation:
Radial basis function $\varphi(x)=\exp \left(-\left(\|x-\mu\|^2\right) /\left(2 \sigma^2\right)\right)$ (6)
The output of a hidden neuron in a neural network represents the weighted sum of its inputs passed through an activation function, which introduces non-linearity. Following is the equation for the same.
Hidden neuron output $H_i=\varphi(|| x-\mu||)$ (7)
The output here is the product sum for the weighted inputs and hidden neuron output. Following is the equation for the same.
Output $=\Sigma\left(W_i * H_i\right)$ (8)
4.1 Dataset description
The dataset has been sourced via the University of Bath, United Kingdom [17]. This dataset contains several observations of hot and desert zone urban courtyard blocks. The columns of data indicate the geometric features of the blocks: elongation, distances, and orientation. The height of the block is represented by the following nine columns: southwest, southeast, west, east, northwest, northeast, south, north, and the average height. The last column reflects the blocks' cooling per square meter (cooling/m2). The size of this dataset is substantially large, containing about 708 rows and 13 columns, respectively. The dataset can be used to optimize multi-objective urban courtyard blocks for hot and arid zones to predict cooling per square meter while keeping the required FAR (Floor Aspect Ratio) and geometric and height aspects of the blocks. The dataset contains a variety of values for various geometric and height features that can be used to construct and optimize urban courtyard blocks in hot and arid climates.
Table 1 below displays various building design characteristics, in a hot arid zone, including elongation, distances, orientation, height, FAR, and cooling load per unit area.
Table 1. Design parameters with description
|
Design Parameters |
Description |
|
Elongation [E] |
The ratio of the longer side of the building to the shorter side |
|
Distances [D] |
The distance between the building and adjacent buildings or roads |
|
Orientation [O] |
The orientation of the building |
|
Height [H](SW) |
The height of the building on the southwest side |
|
Height [H](SE) |
The height of the building on the southeast side |
|
Height [H](W) |
The height of the building on the west side |
|
Height [H](E) |
The height of the building on the east side |
|
Height [H](NW) |
The height of the building on the northwest side |
|
Height [H](NE) |
The height of the building on the northeast side |
|
Height [H](S) |
The height of the building on the south side |
|
Height [H](N) |
The height of the building on the north side |
|
FAR |
The ratio of the total floor area of the building to the area of the site |
|
Cooling/m2 (c/m2) |
Cooling load per unit area of the building (Target variable) |
4.2 Proposed work
The aim of our methodology is to predict the cooling rates/m2 with the help of other variables as specified in the dataset description. To achieve this, we are using three algorithms, namely, RBFN (Radial Basis Function Network (RBFN), MLP Regressor, and RNN LSTM (Long Short Term Memory).
These algorithms are used in contrast to other prominent Deep Learning algorithms like CNN (Convolutional Neural Network) and ANN (Artificial Neural Network) because the algorithms we choose work efficiently on the type of data we are using. Additionally, the performance of these algorithms was relatively better. The entire code was run on Google Colab. Figure 3 shows the basic diagram to depict the workflow of our methodology.
Figure 3. Proposed methodology
4.2.1 Algorithm 1: MLP Regressor
MLP Regressor is a computational model based on neural networks and backpropagation. This is applied for training purposes. This methodology is designed to address regression tasks using supervised learning techniques [18].
The following Table 2 represents the libraries that are imported for the successful implementation of algorithms:
Table 2. Libraries used for MLPRegressor
|
Library |
Purpose |
|
numpy |
Numerical computations |
|
pandas |
Data manipulation |
|
matplotlib.pyplot |
Data visualization |
|
sklearn |
Machine learning tools |
|
MLPRegressor |
Multi-Layer Perceptron Regressor |
|
train_test_split |
Data splitting for training and validation |
|
MinMaxScaler |
Feature scaling |
|
mean_squared_error |
Mean Squared Error (MSE) calculation |
|
root_mean_squared_error |
Root Mean Squared Error (RMSE) calculation |
|
mean_absolute_error |
Mean Absolute Error (MAE) calculation |
The proposed strategy involves a series of sequential steps:
1. Data Preprocessing: The dataset is loaded. Feature scaling is applied to normalize the input features. The dataset is divided into training and validation subsets (80% training and 20% validation).
2. Model Architecture: An MLP (Multi-Layer Perceptron) regressor model is constructed. The architecture consists of two hidden layers with 50 and 25 units, respectively, followed by a ReLU activation function.
3. Training: The MLP model is trained with a maximum of 1000 iterations. The random state is set to 42 for reproducibility.
4. Evaluation: The model's performance is evaluated on the validation set. Evaluation metrics include MSE, RMSE, and MAE.
5. Prediction: The trained MLP model is used to make predictions on new data. Table 3 represents the parameters used in MLP Regressor Algorithm.
Table 3. Parameters used for MLPRegressor
|
Parameter |
Value |
|
Model |
MLP Regressor |
|
Hidden Layers |
50, 25 |
|
Optimizer |
Adam |
|
Activation |
Relu |
|
Epochs |
100 |
|
Random State |
42 |
4.2.2 Algorithm 2: RNN Long Short Term Memory
LSTMs are RNNs that can learn long-term dependencies by selectively retaining or discarding input via a gating mechanism [19].
The following Table 4 shows the libraries that are used in this algorithm for successful implementation:
Table 4. Libraries used for RNN LSTM
|
Library |
Purpose |
|
numpy |
Numerical computations |
|
pandas |
Data manipulation |
|
matplotlib.pyplot |
Data visualization |
|
sklearn |
Machine learning tools |
|
tensorflow.keras |
Deep learning framework |
|
tensorflow |
Deep learning library for TensorFlow |
|
train_test_split |
Data splitting for training and validation |
|
MinMaxScaler |
Feature scaling |
|
LSTM |
Long Short-Term Memory layer for RNNs |
|
Dense |
Dense layer for neural networks |
|
Adam |
Adam optimizer for gradient descent |
|
mean_squared_error |
Mean Squared Error (MSE) calculation |
|
mean_absolute_error |
Mean Absolute Error (MAE) calculation |
The following phases are included in the proposed methodology for this architecture:
1. Data Preprocessing: The dataset is loaded, consisting of features and the target variable, cooling/m2. Feature scaling is performed to normalize the input features. The dataset is split into training and validation sets (80% training and 20% validation).
2. Model Architecture: An RNN LSTM (Recurrent Neural Network with Long Short-Term Memory) model is constructed. The architecture comprises a single LSTM layer with 50 units, followed by a dense layer with ReLU activation. The model uses the Adam optimizer to minimize the loss function.
3. Training: The model is being trained for 50 epochs with a batch size of 32. During training, the Mean Squared Error (MSE) is used as the loss function to minimize the prediction error.
4. Evaluation: The model's performance is assessed on the validation set. Evaluation metrics include MSE, Root Mean Squared Error (RMSE), and Mean Absolute Error (MAE).
5. Prediction: The trained model is used to make predictions on new data. Parameters used for RNN LSTM algorithm are shown in Table 5.
Table 5. Parameters used for RNN LSTM
|
Parameter |
Value |
|
Model |
RNN LSTM |
|
Hidden Layers |
50 |
|
Optimizer |
Adam |
|
Activation |
Relu |
|
Epochs |
50 |
|
Batch size |
32 |
4.2.3 Algorithm 3: RBFN
The Radial Basis Function Network (RBFN) is another computational model used for regression tasks based on neural networks. It is distinct from the more common feedforward neural networks (such as multilayer perceptrons) in its architecture and activation functions. RBFNs are particularly useful when dealing with problems that involve nonlinear relationships in the data [20]. The libraries included in this model are shown in the Table 6:
Table 6. Libraries used for RBFN
|
Library |
Purpose |
|
numpy |
Numerical computations |
|
pandas |
Data manipulation |
|
matplotlib.pyplot |
Data visualization |
|
sklearn |
Machine learning tools |
|
MinMaxScaler |
Feature scaling |
|
mean_squared_error |
Mean Squared Error (MSE) calculation |
|
root_mean_squared_error |
Root Mean Squared Error (RMSE) calculation |
|
mean_absolute_error |
Mean Absolute Error (MAE) calculation |
The following steps were implemented here:
1. Data Preprocessing: The same dataset is used for the RNN LSTM and MLP model. Feature scaling is applied to normalize the input features. The dataset is divided into training and validation subsets (80% training 20% validation).
2. Model Architecture: An RBFN model is constructed. The architecture consists of Radial Basis Functions (RBF) as activation functions. The number of RBF neurons is determined based on the dataset or prior knowledge.
3.Training: The RBFN model is being trained. The center points and widths of the RBF neurons are typically learned during training. The training process aims to minimize the error between the RBFN model's predictions and the actual target values.
4. Evaluation: The model's performance is evaluated on the validation set. Evaluation metrics include Mean Squared Error (MSE), Root Mean Squared Error (RMSE), and Mean Absolute Error (MAE). These metrics help assess the accuracy and performance of the RBFN model. Parameters used for this algorithm are shown in an effective manner in Table 7.
5. Prediction: The trained RBFN model makes predictions on new or unseen data. The model applies the learned RBF activations to the input data to produce predictions.
Table 7. Parameters used for RBFN
|
Parameter |
Value |
|
Model |
RBFN |
|
Hidden Layers |
3 |
|
Optimizer |
Adam |
|
Activation |
Relu |
|
Epochs |
100 |
|
Batch size |
32 |
5.1 MLP Regressor
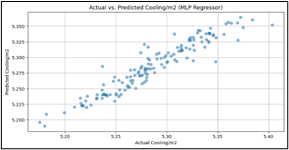
Based on the provided dataset, the MLP Regressor model is used to predict cooling rates with input parameters [20, 19, 90, 36, 36, 36, 36, 36, 36, 36, 36, 6.8]. These values are relative to various parameters of building that include {Elongation[E], Distances[D], Orientation[O], Height [H](SW), Height [H](SE), Height [H](W), Height [H](E), Height [H](NW), Height [H](NE), Height [H](S), Height [H](N), FAR}. The model projected a cooling rate of 5.5751/m2. The following main metrics are found from an evaluation of the model's performance:
The MSE for the MLP Regressor model is found to be 0.0984, indicating the average squared difference between predicted and actual cooling rate values. The typical magnitude of prediction mistakes is represented by the Root Mean Squared Error (RMSE), which is calculated as the square root of the MSE and is calculated around 0.3136. Furthermore, the Mean Absolute Error (MAE) was found to be roughly 0.2325, which reflects the average absolute deviations between projected and actual cooling rate values. The MAE gives information about the model's average prediction error magnitude. This information is described in a summarized manner in Table 8.
Figure 4 visually represents actual and predicted cooling rates for the MLP Regressor algorithm. The trend here is visible. A good training and validation loss graph shows a constant drop in training and validation loss over time, with the validation loss not behind the training loss much. During machine learning model training, it is necessary to analyze the model's learning progress, identify overfitting, and ensure generalization to unknown data. The plot for training and validation loss is depicted in Figure 5.
Figure 4. Actual vs Predicted Cooling rates (MLP Regressor)
Figure 5. Training and validation loss (MLP Regressor)
Figure 6. Actual vs Predicted cooling rates (RNN LSTM)
Table 8. Error metrics (MLP Regressor)
|
Model |
MSE |
RMSE |
MAE |
|
MLP Regressor Model |
0.0172 |
0.1313 |
0.0964 |
5.2 RNN LSTM
The RNN LSTM model is used to predict cooling rates based on the provided dataset. The input provided is the same as the previous algorithm. RNN LSTM models predicted cooling rate is 5.1285/m2. The model's performance was assessed using key metrics.
The model's Mean Squared Error (MSE) is 0.0032, indicating the average squared difference between predicted and actual cooling rate values. The Root Mean Squared Error (RMSE), which measures the square root of the MSE, is at 0.0570, indicating the normal level of prediction mistakes. Furthermore, the Mean Absolute Error (MAE), which measures the average difference between projected and actual cooling rate values, is found to be around 0.0432. This entire data is represented in a summarized manner in Table 9.
The validation loss, evaluated in terms of MSE, is monitored during model training and evaluation. The validation loss is roughly 0.0032, suggesting the model's ability to generalize well to previously unseen data.
Figure 6 is a visual representation of actual and predicted cooling rates for the RNN LSTM algorithm. The trend here is visible. The plot for training and validation loss is depicted in Figure 7.
Table 9. Error metrics (RNN LSTM)
|
Model |
MSE |
RMSE |
MAE |
|
RNN LSTM Model |
0.0029 |
0.0537 |
0.0429 |
Figure 7. Training and validation loss (RNN LSTM)
5.3 RBFN
Similarly, the RBFN model was used to predict cooling rates utilizing the input parameters consistent with the previous algorithms. The model achieved a predicted cooling rate of 5.2087/m². Evaluation of the model's performance is also based on the following key metrics:
The RBFN model's Mean Squared Error (MSE) is remarkably low, at 0.0016. This MSE is the average squared difference between expected and real cooling rate values, showing impressive prediction accuracy. The RMSE is calculated as the square root of the MSE and is found to be 0.0395. This RMSE shows a relatively small amount of prediction errors, confirming the model's accuracy in anticipating cooling rates. Furthermore, the Mean Absolute Error (MAE) is found to be roughly 0.0315, which shows the average absolute deviations between projected and actual cooling rate values. The MAE shows the model's consistent and accurate prediction of cooling rates. This information is shown in an effective manner in Table 10.
Figure 8. Actual vs Predicted cooling rates (RBFN)
Table 10. Error metrics (RBFN)
|
Model |
MSE |
RMSE |
MAE |
|
RBFN Model |
0.0016 |
0.0395 |
0.0315 |
Figure 8 is a similar representation of actual and predicted cooling rates for the RBFN algorithm. The trend here is also clearly visible. Similarly, the plot for training and validation loss is depicted in Figure 9.
Figure 9. Training and Validation loss (RBFN)
5.4 Comparison of results achieved
In order to achieve a relevant comparison between the three types of algorithms used, we choose to provide the same values for input parameters for each model. This is represented in a summarized manner in Table 11. The predicted cooling rate for RNN LSTM was the lowest, while the predicted cooling rate for the MLPRegressor algorithm was the highest.
Table 11. Comparison of cooling rate prediction
|
Algorithm |
Input |
Cooling/m2 |
|
RNN LSTM |
20, 19, 90, 36, 36, 36, 36, 36, 36, 36, 36, 6.8 |
5.1285 |
|
RBFN |
5.2087 |
|
|
MLP Regressor |
5.5751 |
Following Figure 10 is a histogram comparison plot to have an efficient analogy between the error metrics used for each algorithm. From the graph it may be analyzed that, among the three models, the RBFN Model has the lowest MSE, RMSE, and MAE, indicating more excellent predictive performance. The RNN LSTM Model has a relatively low MSE, RMSE, and MAE, suggesting that it has good predictive ability. Among the three models, the MLP Regressor Model has the greatest MSE, RMSE, and MAE, implying the least accurate predictions. Similarly, Figure 11 compares actual and predicted cooling rates for all three models. It can be clearly seen that the RBFN model has the best scatter with the most efficient trend compared to the other two models.
Figure 10. Comparison of error metrics for each algorithm
Figure 11. Comparison of actual vs Predicted cooling rates (All algorithms)
Finally, deep learning techniques are used to optimize urban courtyard blocks in hot and arid climates to forecast cooling rates in these blocks to ensure their long-term viability. For this objective, neural network models such as RNN-LSTM, MLP Regressor, and RBFN are used. RBFN outperformed MLP Regressors and RNN LSTM in forecasting cooling rates in urban courtyard blocks, according to the findings. This is critical because accurate forecasting is required to maintain the long-term viability of these blocks in hot and arid areas. As a result, RBFN is a more effective choice for predicting cooling rates in such urban courtyard blocks. When we say these algorithms perform well, it is also important to understand that these algorithms hold certain limitations, including data constraints, the need for expertise, and the unavailability of large datasets for better predictions.
Further, we could continue the study by optimizing models that not only give us the cooling rates but also predict thermal comfort and thermal cooling levels accurately. Currently, the study is focused on hot arid zones using a “Cairo, Egypt” dataset; in the future, we can use this technique and modify parameter settings to fit into different temperature environments and use it to predict cooling and thermal rates on various datasets from diverse cities.
Designers, Architects, Urban city planners, and Environmentalists can all use this study to develop software/models that easily let them enter parameters such as area and size specifications of a plot and building and estimate the cooling rate, cooling load, and thermal comfort according to different specifications. They can use the results to make design changes to optimize load results to decrease the energy consumption of courtyard blocks and buildings, by which a greener, sustainable way of urban development can be achieved. Policy makers can also use it to regulate new design plans. Anticipating cooling loads based on building features encourages architects and builders to design and construct buildings that are better adapted to the local climate conditions. Sustainable building design promotes the use of passive cooling strategies, such as optimal orientation, shading, and insulation, which can reduce the reliance on energy-intensive cooling systems.
As climate change continues to bring rising temperatures and more frequent heat waves, the ability to accurately anticipate and manage cooling loads becomes critical for building resilience. Buildings designed to handle extreme heat efficiently are better equipped to provide a comfortable indoor environment during heatwaves, thus enhancing the resilience of communities to climate change impacts. Sustainable building practices and energy-efficient technologies can foster local economic development. The research can encourage the adoption of green building standards and the growth of industries related to energy-efficient construction and retrofitting. This aligns with the goal of conserving energy resources and reducing greenhouse gas emissions associated with energy production.
Overall, this research highlights the importance of using advanced machine learning techniques, such as neural networks, to optimize urban courtyard blocks in hot, arid environments. It underscores the significance of precise cooling rate predictions in ensuring the long-term viability of these blocks. In the future, these insights can inform the development of more sustainable urban design solutions in hot and arid zones. It aligns with global goals related to sustainable development and climate change adaptation, contributing to a more sustainable and resilient built environment.
The authors thank Symbiosis Institute of Technology in Pune, Maharashtra, India, for their assistance in this research.
|
SDG |
Sustainable Development Goals |
|
RBFN |
Radial Basis Function Network |
|
MLP |
Multi Layer Perceptron |
|
LSTM |
Long Short-Term Memory |
|
RNN |
Recurrent neural network |
|
MSE |
Mean Squared Error |
|
RMSE |
Root Mean Squared Error |
|
MAE |
Mean Absolute Error |
|
Greek symbols |
|
|
σ |
Activation function |
|
μ |
Center Point (RBFN) |
|
Subscripts |
|
|
f |
Forget gate |
|
i |
Input gate |
|
o |
Output gate |
|
t |
Present state |
|
t-1 |
Previous state |
[1] Sözen, R., Koçlar Oral, G. (2019). Outdoor thermal comfort in urban canyon and courtyard in hot arid climate: A parametric study based on the vernacular settlement of Mardin. Sustainable Cities and Society, 48: 101398. https://doi.org/10.1016/j.scs.2018.12.026
[2] Chandola, D., Gupta, H., Tikkiwal, V.A., Bohra, M.K. (2020). Multi-step ahead forecasting of global solar radiation for arid zones using deep learning. Procedia Computer Science, 167: 626-635. https://doi.org/10.1016/j.procs.2020.03.329
[3] Mohamed, S.A.E.M., Mohamed, M.H., Farghally, M.F. (2021). A new cascade-correlation growing deep learning neural network algorithm. Algorithms, 14(5): 158. https://doi.org/10.3390/a14050158
[4] Morita, M. (1996). Heat exhaust load by energy consumption in urban areas. Environmental Systems Research, 24: 593-600. https://doi.org/10.2208/proer1988.24.593
[5] Zoure, A.N., Genovese, P.V. (2023). Implementing natural ventilation and daylighting strategies for thermal comfort and energy efficiency in office buildings in Burkina Faso. Energy Reports, 9: 3319-3342. https://doi.org/10.1016/j.egyr.2023.02.017
[6] Maheshwari, B., Pinto, U., Akbar, S., Fahey, P. (2020). Is urbanization also the culprit of climate change?–Evidence from Australian cities. Urban Climate, 31: 100581. https://doi.org/10.1016/j.uclim.2020.100581
[7] Omer, A.M. (2021). Design thermal comfort in greenhouses environment. Modern Techniques in Horticultural Research, 1(1). https://doi.org/10.53902/mthr.2021.01.000501
[8] Manesh, S.V., Tadi, M. (2013). A Sustainable urban morphology for a greener city: Strategy applied for a sustainable oriented urban design. The International Journal of Architectonic, Spatial, and Environmental Design, 6(2): 171-182. https://doi.org/10.18848/2325-1662/cgp/v06i02/38334
[9] Taleghani, M., Tenpierik, M., van den Dobbelsteen, A., Sailor, D.J. (2014). Heat in courtyards: A validated and calibrated parametric study of heat mitigation strategies for urban courtyards in the Netherlands. Solar Energy, 103: 108-124. https://doi.org/10.1016/j.solener.2014.01.033
[10] Ragab, A. (2023). The effects of courtyard envelope on the energy required for cooling in the hot desert climate. SVU-International Journal of Engineering Sciences and Applications, 4(2): 155-164. https://doi.org/10.21608/svusrc.2023.193025.1097
[11] Guedouh, M.S., Zemmouri, N. (2017). Courtyard building's morphology impacts on thermal and luminous environments in hot and arid regions. Energy Procedia, 119: 153-162. https://doi.org/10.1016/j.egypro.2017.07.063
[12] Xu, X., Liu, Y., Wang, W., Xu, N., Liu, K., Yu, G. (2019). Urban layout optimization based on genetic algorithms for microclimate performance in the cold region of China. Applied Sciences, 9(22): 4747. https://doi.org/10.3390/app9224747
[13] Hasehzadeh Haseh, R., Khakzand, M., Ojaghlou, M. (2018). Optimal thermal characteristics of the courtyard in the hot and arid climate of Isfahan. Buildings, 8(12): 166. https://doi.org/10.3390/buildings8120166
[14] M’Saouri El Bat, A., Romani, Z., Bozonnet, E., Draoui, A., Allard, F. (2023). Optimizing urban courtyard form through the coupling of outdoor zonal approach and building energy modeling. Energy, 264: 126176. https://doi.org/10.1016/j.energy.2022.126176
[15] Khan, H.M., Lane-Serff, G.F., Dewsbury, J. (2022). Optimizing the design of courtyard houses for passive cooling in hot, dry regions. Journal of Building Performance Simulation, 16(2): 231-247. https://doi.org/10.1080/19401493.2022.2134460
[16] Ibrahim, Y., Kershaw, T., Shepherd, P., Elkady, H. (2022). Multi-objective optimisation of urban courtyard blocks in hot arid zones. Solar Energy, 240: 104-120. https://doi.org/10.1016/j.solener.2022.05.024
[17] Ibrahim, Y. (2022). Dataset for "Multi-objective optimisation of urban courtyard blocks in hot arid zones". Solar Energy, 240: 104-120. https://doi.org/10.15125/BATH-01137
[18] Tao, P., Cheng, J., Chen, L. (2022). Brain-inspired chaotic backpropagation for MLP. Neural Networks, 155: 1-13. https://doi.org/10.1016/j.neunet.2022.08.004
[19] Linzen, T., Dupoux, E., Goldberg, Y. (2016). Assessing the ability of LSTMs to learn syntax-sensitive dependencies. Transactions of the Association for Computational Linguistics, 4: 521-535. https://doi.org/10.1162/tacl_a_00115
[20] Zhao, Q., Bao, Z. (1996). Radar target recognition using a radial basis function neural network. Neural Networks, 9(4): 709-720. https://doi.org/10.1016/0893-6080(96)00088-3