Ali Basem*![]() | Ihab Omar
| Ihab Omar![]() | Ammar Mohammed Ali Al-Tajer
| Ammar Mohammed Ali Al-Tajer![]() | Abbas Fadhil Khalaf
| Abbas Fadhil Khalaf![]()
© 2023 IIETA. This article is published by IIETA and is licensed under the CC BY 4.0 license (http://creativecommons.org/licenses/by/4.0/).
OPEN ACCESS
Sewage pumping stations (SPSs) are an essential part of the sewage system, especially in flat areas such as many cities in Iraq, therefore any delay in operation schedule may be cause flooding in the upstream part of the system. The objective of this study is to evaluate the operating efficiency of the pumps and the fluctuation of sewage flow between the influent and effluent of the sewage pumping stations as an indicator of the operating system inside the station. The methodology of the study includes find the hydraulic analysis, the Performance Index by statistical model and evaluate the efficiency of pumps in Al-Dora SPS. This work suggests and classifies the behavioral of index of SPSs in sewage system using the systematic Supervisory control and data acquisition (SCADA) to collect the data during a period from January to December 2018. Dora sewage pump station position in western part of Baghdad city has been carried out to investigate the operation as real field operation conditions. The critical behavioral of the sewage pumps has examined and analyzed to observe the pumps involved in this station. The achieved results showed flooded, emergency, a good and very good performance which evaluates the SPS using Artificial neural network (ANN) with its correlation coefficient (R2 97.5%) of the model and gives a suitable indication that Dora SPS works in good condition, but an overflow is caused by the backup in the inlet sewer. For all these cases, pump efficiency has been identified and provided through this project.
Performance Index, sewage pump station, supervisory control and data acquisition, pump efficiency, artificial neural network
In sewage fields, the pump stations particular properties associated with the expanse of Baghdad areas when compared with others Iraqi Provinces. So, the performance of transport and the treatment of sewage are influenced by the unsteady behavior and condition of transport systems. Furthermore, the study and analysis of the performance of the transport system is complicated by its unsteady behavior. Nonetheless, performance issues in the transport system can effectively be detected with advanced monitoring applying and appropriate indices techniques. In this way, advanced monitoring assists in setting priorities in asset management and improving system performance [1, 2].
In conventional wet well sewage pumping station, the pumps are submerged in the sewage. In this case, the inlet liquid does not filter, so the solids content is high and the control system is not implemented but recently performance monitoring system is being developed [3]. Zhang et al. [4] improve of the hydraulic performance and operation efficiency of prefabricated pump stations using numerical simulation method (CFD) and provide a theoretical basis for parameter selection for prefabricated pumping stations. the internal flow pattern of the prefabricated pump station is better when the distance between the connecting line of two pumps and the center of the sump is L=0.2 R, the distance between the two pumps is S=0.6 R, and the suspension height of the two pumps is H=0.6 D.
Every index could be considered as a tool to track the sewage pump station efficiently because it’s a compute the amount of which the resources are used in optimal methods of production and effective to measure the amount of which managing objectives are meets. Identification Performance Index as a tool to track and monitor the quality of SPSs has been suggested and studied. Individual sewers of Al-Rusafa in Baghdad city are studied, and the performance is evaluated in a sub-index range from minimum level to high level, i.e., range between (0.5-1D). Results are presented a tool which helps the managers to take the best operational decisions [5, 6] while the pump performance changes are predicted and develop a statistical model using the neural network model (ANN) and multiple linear regression (MLR) in Baghdad city was determined [7].
The data used to evaluate pumping system refers to the procedure used to access and manage information or data from the equipment being controlled and monitored by SCADA system. The information accessed is then forwarded onto a telemetry system prepared for transfer to the various sites. Spellman [8] describes a SCADA software application implemented on wastewater treatment plant relating to the architecture, the interface to the process hardware, the functionality and capabilities to create a comprehensive real-time applications management environment for a modern wastewater operation.
The current study is focused on the operation of SPS, hydraulic analysis, Performance Index, monitoring control system using (SCADA) system and using the ANN model is to develop a system to perform various computational tasks faster than the traditional systems and predict the values of variable depends on other input parameters with their importance on it. It is a completely new idea which means the control system can work directly with the pumps’ operations. Many modifications were carried out including using the indices to evaluate the performance of pumps under real conditions. The Performance Index proposed technique allows the identification the pump station condition, assets its hydraulic analysis and their overall efficiency, so, the objective of this research is to suggest and classify the index performance of SPSs to use in the field of sewage compared with other work and considering their drawbacks.
The detailed step of the study is presented in Figures 1 and 2 achieving the main objectives by the three lines of methodology includes the hydraulic analysis, the Performance Index by statistical model and evaluate the efficiency of pumps. This figure shows the basic steps of this study in a brief and clear way so the reader can define a clear vision about the main lines of this study.
Figure 1. Pump house of Dora SPS
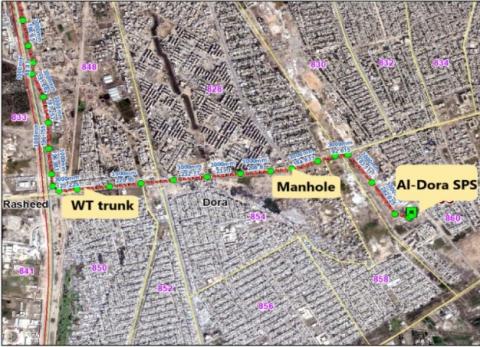
Figure 2. Location of Dora SPS on WT line
In this research, daily data were collected and taken from Mayoralty of Baghdad/Sewage Department-section geographic information system (GIS) and systematic Supervisory control and data acquisition (SCADA) controlling for period from January to December 2020 for the sewage level in the wet well and the schedule pumps operation per day. The data were arranged by Excel 2021 and IBM SPSS 24 software were used for data analysis in the multilayer prediction artificial neural network model.
In many researches, showed that the pump stations design and the operational schedule were the main cause of sewage pumping stations problems. So, some of municipalities found that take the best operation decisions and regular maintenance may be helpful to minimize these types of problems. However, to find the solution of these problems and local conditions immediately, special experience need to be acquired through the years based on the practical experience and theoretical concepts and hydraulics considerations. In order to evaluate that sewage pumping stations operates at an acceptable level, the following criteria are recommended [3].
The actual sewage flowing that is received by the pumping station (inflow) must be less than the station overall design capacity. The actual sewage flow (qp) is determined with three cases for the operating conditions of pumps: in the morning, at the peak time and night. Also, the full flow (Q) and full velocity (V) from the Manning's formula Eq. (1) and Eq. (2) [9, 10]:
$Q=\frac{1}{n} R^{\frac{2}{3}} \sqrt{S} A$ (1)
$V=\frac{1}{n} R^{\frac{2}{3}} \sqrt{S}$ (2)
where, Q is full flow discharge (m3/s), V is the full velocity (m/s), R is the Hydraulic Radius (m), S is the Slope of Pipe (m/m), (A) Cross-sectional Area of Flow (m2) and n is the Coefficient of Roughness.
Finally, find the hydraulic elements characteristics, (q/Q) and then (d/D) and (v/V) can be obtained from the proportionate graph prepared for different values of d/D from Figure 3 start from the y-axis with d/D and draw a horizontal line until intersect the Q Curve (for n=constant, the dashed line) ,then draw a vertical line to intersect the x-axis q/ Q after that extend the horizontal line until intersect the velocity curve then draw a vertical line to intersect the x-axis (for n=constant , the dashed line) at v/V so, the flow depth (d) and the actual velocity (v) are determined .
Figure 3. Hydraulic elements curve for circular sewer [11, 12]
The efficiency rates of the pump depend largely on the load of flow rates. Therefore, it should be kept as high as possible to endure the increasing of discharges during the wet weather flow. So, the ratio of useful pump output power to the input power is defined as pump efficiency. The efficiency is expressed by Eq. (3) [13]:
$\mathrm{E}=\gamma \mathrm{QH} / \mathrm{P}$ (3)
where, γ specific weight of the sewage (kN/m3), Q: flow rate (m3/s), H: total head (m) and P: power of the pump (kW) [14].
Performance Index is a set of quantitative and qualitative measures used to track performance over time to infer how well they meet the agreed performance levels, the test points that monitor progress towards standards [15]. Furthermore, performance indices are used to improve the performance of enterprises for competitive purposes, tool to assess the success of operation and maintenance of systems and provide information and data to the government for monitoring and accounting purposes. At present, the monitoring of measurement data is mostly limited to a few signals only and is mainly intended for pump operation or the reporting of failures. Analysis of the data is only done after an incident has occurred. Prior to this, inefficient operations may have gone unnoticed on a large scale, which can result in unnecessarily high maintenance and/or running costs [15]. So, in this study PI is used as an indicator for the station operation condition and it is used as the ratio between the effluent sewage flow (Qout) to the influent sewage flow (Qin) in Eq. (4), furthermore, the ratio is defined so that reduced performance leads to a PI >1.
$P I=\frac{Q_{\text {out }}}{Q_{\text {in }}} \times 100$ (4)
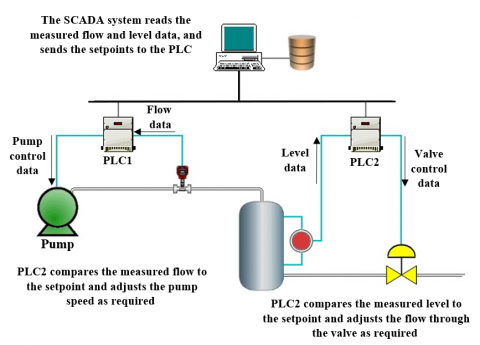
Figure 4. Simple SCADA system
The fundamental level of SCADA system is the industrial system to control the behavioural of pump stations. It’s a computerize control system used to track and control the process of industries that be in the physical fields. This system could be found in manufacturing facilities, energy, processing and water distribution and treatments. This system of processing techniques is the best solution which have large amount of information which is used to analysis and gathering over large distance or critical control requirements in quick pace processing [16, 17]. Figure 4 shows a simple SCADA system with a single computer, which represents the simplest configuration of SCADA.
The Artificial Neural Network (ANN) is a strong soft computing technology made up of interconnected nodes (similar to neurons in the brain) linked by weighted synaptic connections. This approach, which is based on biological brain activity, is commonly used in water resource and hydrological forecasting. This technique can manage a wide range of issues because to its speed, flexibility, great adaptability, and robustness in newer and noisier surroundings. ANN has been effectively used in engineering domains such as rainfall-runoff modelling, time series prediction, and rule-based control, according to extensive study [18]. For each independent variable, a multiple training was performed in SPSS 24 using multilayer perceptron to optimize weights and bias values using the hidden layers. The training, testing and holdout are based on the deviation between the data, which minimizes error [19].
7.1 Operational assessment using Performance Index
Sewage transport systems have become increasingly complex recently and extensive branched systems with numerous pumping stations are operated locally and therefore real-time performance analysis of the entire system is critical for effective management [9, 20]. The results obtained by applying the performance indices range were divided into four limits. The suggested categorization of four Performance Index accessible in this study is illustrated in Table 1. The values ranges corresponding to “Flood”, “very good”, “good”, and “Emergency” are indicated in this table. It was found that the Dora SPS is working well based on the Performance Index, but in the hot summer days it was found that the station is almost unable to absorb the quantities of sewage, especially in July and when PI value less than 100%. In addition, the station is in critical condition during the rainy seasons and operates at maximum capacity for 24 hours.
Table 1. Performance indices ranges
|
PI Indicator |
Inputs |
|
Flood |
Qin > Qout |
|
Emergency |
Qin $\approx$ Qout |
|
Good |
Qin < 0.5 Qout |
|
Very good |
Qin << Qout |
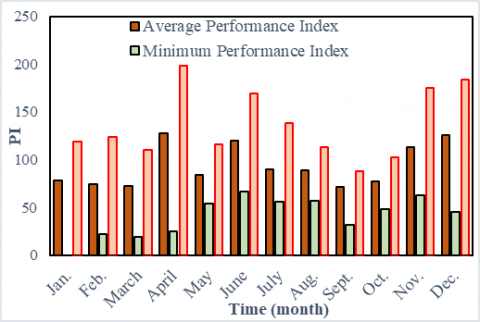
From Figure 5 below, it's showed the Performance Index of the station during the year from January to December and shows that the station is working well, but there is a state of flooding occurred during the month of July when the Performance Index was less than 100% which means that most pumps in the station not working under the normal case of its capacity [21]. In addition, the station is in critical condition when the rain intensity is high during the winter, forcing managers to work at full capacity during the day to pump the additional sewage during the rainy season.
Figure 5. Monthly PI percentage variation of Dora SPS
Performance indices provide sufficient information for the stations managers and experts for the purpose of operation decision. With respect to the PI evaluation, especially in the maximum flow where the results showed that the station works well but flooding occur at July when PI value less than 100%.
7.2 Hydraulic analysis of Dora SPS
I. Influent sewer
The influent sewer to Dora SPS is a concrete sewer pipe of 3 m diameter and according to Manning’s formula (Eqs. (1) and (2), the partially full flow discharge and velocity are Q = 24.58 m3/s and V= 3.48 m3/s, respecitively. To know the effects of the operational performance of this sewage pumping station based on the influent sewage flow, three cases of influent sewage flow must be determined. These cases include d/D equal to 0.3, 0.5 and 0.75 and their corresponding q/Q equal 0.14, 0.4 and 0.8 from Figure 3, which represent low, medium and high flow respectively [22]. The influent sewage flow qin, that is calculated for the three cases, and the three operational conditions of this SPS (qp) are shown in Table 2.
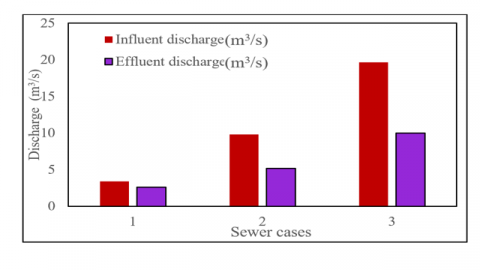
It appears from Figure 6 that for all cases of flow conditions, the pumps flow qp is less than the inlet flow qin which causes accumulate the sewage in the wet well and influent sewer. These cases can be solved by running more pumps or increase pump working time to discharge the inlet flow. As the overall design capacity of the station is 13.5 m3/s, it can deal with these flow conditions. But for the high flow condition, the inlet flow is greater than the design capacity 13.5 m3/s, here a problem of backup flow may occur in the inlet sewer leading to sewer overflow and flooding [7, 22].
Table 2. The hydraulic characteristics of influent-effluent sewers of Dora
|
Case |
qin (m3/s) |
qin(m3/s) |
|
1- Low |
3.44 |
2.6 |
|
2- Medium |
9.832 |
8.66 |
|
3- High |
19.66 |
13.7 |
Figure 6. Influent-effluent sewage relationship in Dora SPS
The operating system of Al-Dora SPS is somewhat fixed throughout the year depending on the consumption times of the people and the quantities of sewage discharges during the day, as detailed in the Table 3 below.
Table 3. Real condition of Al-Dora SPS operation
|
Pump Cycle |
Time |
No. of Pumps |
|
First shift |
8 AM to 1 PM |
4-8 |
|
Second shift |
1-8 PM |
3-4 |
|
Third shift |
8 PM to 8 AM |
4-6 |
II. Effluent sewer
In order to balance the wet well associated with the inlet pipe entering to the sewage pump station as a real condition, it was necessary to operate the different capacities regularly and in accordance with paragraph 2.1. The sewage pump pipes consist of a three ductile iron pipes, each 1.6 m diameter, which pumps the sewage toward Al-Karkh wastewater treatment plant [23].
Table 4. Operational schedule for the outlet sewer of Dora SPS
|
Case |
Time |
No. of Operating Pumps |
Average Pump Flow $q_p$ (m3/sec) |
Sewage Velocity of Pump Pipes (m/sec) |
||
|
|
|
|
|
1 |
2 |
3 |
|
1 |
Morning (6-9) am |
4 |
5.6 m3/s
|
1.4 |
1.4 |
x |
|
2 |
Peak time (9 am -12 pm) |
8 |
10.02 m3/s
|
1.66 |
1.66 |
1.66 |
|
3 |
Night (12 pm -6 am) |
2 |
2.6 m3/s
|
1.3 |
x |
x |
For the three shifts of working, it's indicated that at the morning shift when four pumps are operated, the sewage velocity in the effluent sewer not more than (1.4 m/s), also when eight pumps are operated (Peak time), the sewage velocity in the effluent sewer equal to (1.6 m/s), and when two pumps are operated (night time), the sewage velocity in the effluent sewer less than (1.3 m/s). The results showed in Table 4 indicated that the sewage pumps velocities for the three cases ranged between (1-2) m/s and it's within allowable velocity for DWF.
7.3 Layers and coefficient of ANN model
In the artificial neural network, the data from the Dora station was used for a whole year and this data was entered into the SPSS program to know the effect of the input parameters (covariates) on the Performance Index (independent) which are listed in Table 5. Two hidden layers are gotten H (1:1) and H (1:2) with the model equation and correlation coefficient (R2) of 97.5% which can be seen in Figure 7.
Table 5. The inputs and outputs variables
|
Inputs |
Outputs |
|
Influent discharge (Qin) |
Performance Index (PI) |
|
Effluent discharge (Qout) |
|
|
Wastewater level in the wet well (WL) |
|
|
The capacity of each pump from Qp1 to Qp13 |
Figure 7. Fitting line of the ANN model with its equation
Figure 8. Importance for each input in the PI model
An evaluation of the expected PI output was conducted using various parameters to further predict the performance of the station for future uses, using (Water level (m), pump capacity for 13 pumps, influent and effluent flow (m3/s)) as inputs. Each of inputs variables have individual effect on the predicted model of PI but the importance of Qin and QP6 were the higher as details with their percentage importance in Figure 8.
Table 6 shows how the model's processing was chosen based on the inputs, which range from 77.4 percent for training, 12.9 percent for testing, and about 9.7% for holdout.
Table 6. Case processing summary
|
|
N |
Percent |
|
|
Sample |
Training |
24 |
77.4% |
|
Testing |
4 |
12.9% |
|
|
Holdout |
3 |
9.7% |
|
|
Valid Excluded Total |
31 |
100.0% |
|
|
0 |
|
||
|
31 |
|
||
Verification of the ANN model
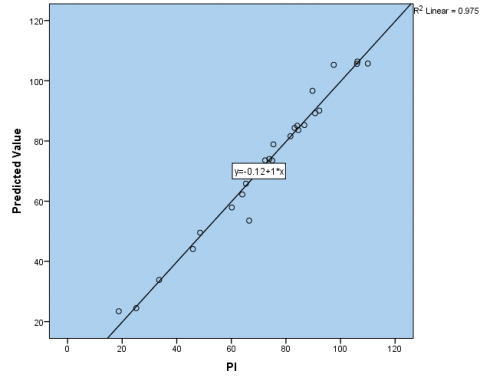
In order to verify the accuracy of the ANN model for predicting the PI at Al-Dora WWTP the recorded data (observed) form the operation conditions in the station were plotted against the predicted values (from the AAN model) [24, 25] as shown in Figure 9. The model gave good accuracy with a coefficient of determination R2=0.955 and equation: y=1.0204x - 5.9349
Figure 9. Verification of the ANN model for predicting PI at Al-Dora WWP
7.4 Pump efficiency
Table 7. Flow rate and head of Dora pumps
|
Pump |
Q (m3/s) |
H (m) |
|
1 |
1.3 |
16 |
|
2 |
1.3 |
16 |
|
3 |
0.9 |
22 |
|
4 |
0.5 |
16 |
|
5 |
0.9 |
16 |
|
6 |
1.3 |
14 |
|
7 |
1.3 |
22 |
|
8 |
9.0 |
22 |
|
9 |
0.9 |
16 |
|
10 |
1.3 |
14 |
|
11 |
1.3 |
16 |
|
12 |
0.5 |
16 |
|
13 |
1.3 |
22 |
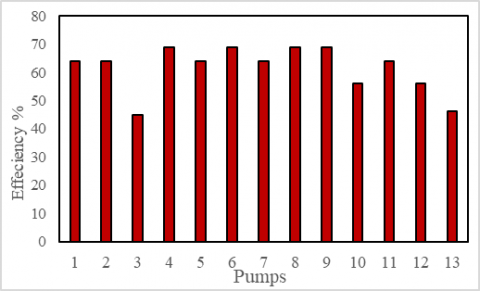
The operation of the pumps is evaluated through the efficiency of its work during the day. Table 7 describes the flow rate and head of each pump in Al-Dora SPS and results showed the overall efficiency under real conditions by applying the above Eq. (3), that the operating efficiency of the pumps (4, 6, 8, and 9) is fairly good but the pumps (3, 10, 12, and 13) are small enough and require complete and accurate maintenance or maybe they need rehabilitation according the range of overall efficiency (70-90%) as shown in Figure 10 [24].
Figure 10. Al-Dora Sewage pumps overall efficiency
We can conclude from the foregoing that most of Al-Dora pumps are do not work well, which leads to aggravating the critical situation and may prevent the station to work in the future.
A set of 13 pumps from Dora sewage pump station in Baghdad city were studied in situ at the real operating conditions. The present study shows:
|
A |
full flow sewer wetted area |
|
D |
sewer diameter for full flow condition (m) |
|
H |
whole dynamic head (m) |
|
n |
pipe roughness coefficient |
|
P |
power of the pump (kW) |
|
Q |
flow rate (m3/sec) |
|
R |
hydraulic radius which is equal to ($\frac{4}{D}$) |
|
S |
hydraulic gradient or longitudinal slope of sewer (m/m) |
|
$\gamma$ |
Specific weight of the liquid to be pumped (kN/m3) |
|
Abbreviations |
|
|
DWF |
Dry weather flow |
|
GEE |
Global energy efficiency |
|
PI |
Performance Index |
|
SCADA |
Supervisory control and data acquisition |
|
SPS |
Sewage Pump Station |
[1] Jurčević, D., Petrović, I. (2013). Automation of sewage pumping station. Tehnički Glasnik, 7(1): 8-12. https://hrcak.srce.hr/101170.
[2] Khalaf, A.F., Ali, A.B.M., Qahtan, H., Jasim, A.K. (2022). Improvement of heat transfer by using porous media, nanofluid, and fins: A review. International Journal of Heat and Technology, 40(2): 497-521. http://dx.doi.org/10.18280/ijht.400218
[3] Karassik, I.J., Messina, J.P., Cooper, P., Heald, C.C. (2008). Pump Handbook. McGraw-Hill Education.
[4] Zhang, B., Cheng, L., Xu, C., Wang, M. (2021). The influence of geometric parameters of pump installation on the hydraulic performance of a prefabricated pumping station. Energies, 14(4): 1039. http://dx.doi.org/10.3390/en14041039
[5] Al-Ani, R.R.A., Al-Obaidi, B.H.K. (2019). Hydraulic analysis and performance evaluation of combined trunk sewers: A case study of Baghdad city. Journal of Engineering, 25(3): 1-10.
[6] Al-Ani, R., Khudhair, B.H. (2019). Prediction of sediment accumulation model for trunk sewer using multiple linear regression and neural network techniques. Civil Engineering Journal, 5(1): 82-92. http://dx.doi.org/10.28991/cej-2019-03091227
[7] Salal, A.M., Khudair, B.H. (2019). Influent flow rate effect on sewage pump station performance based on organic and sediment loading. Journal of Engineering, 25(9): 1-11. https://joe.uobaghdad.edu.iq/index.php/main/article/view/j.eng.2019.09.1/653.
[8] Spellman, F.R. (2008). Handbook of water and wastewater treatment plant operations. CRC press. https://doi.org/10.1201/b15579
[9] McGhee, T.J., Steel, E.W. (1991). Water Supply and Sewerage. McGraw-Hill New York.
[10] Selim, M.M., Basem, A., Alawee, W.H., Mousa, A., Alghawli, A.S. (2022). Thermal storage unit with NEPCM involving numerical unsteady simulation. Case Studies in Thermal Engineering, 35: 102100. https://doi.org/10.1016/j.csite.2022.102100.
[11] Tchobanoglus, G., Burton, F.L., Stensel, H.D. (2003). Wastewater Engineering: Treatment and Reuse. McGraw-Hill Science/Engineering/Math.
[12] Naimpally, A., Rosselot, K.S. (2013). Water and Wastewater, in Environmental Engineering: Review for the Professional Engineering Examination, Springer. pp. 1-61. https://doi.org/10.1007/978-0-387-49930-7
[13] Spellman, F.R. (2008). Handbook of Water and Wastewater Treatment Plant Operations. CRC press. https://doi.org/10.1201/b15579
[14] Hussein, H.Q., Khalaf, A.F., Al-Tajer, A.M., Hammoodi, K.A., Basem, A. (2022). Numerical investigated to improve heat transfer in a pipe using nanofluid. Mathematical Modelling of Engineering Problems, 9(4): 1073-1078. http://dx.doi.org/10.18280/mmep.090425
[15] Kooij, C., Muhle, S., Clemens, F., Pothof, I.W.M. (2015). Performance indicators for complex wastewater pumping stations and pressure mains. In 2015 1st international conference on industrial networks and intelligent systems, IEEE. http://dx.doi.org/10.4108/icst.iniscom.2015.258385
[16] Bailey, D., Wright, E. (2003). Practical SCADA for Industry. British: Newnes Ltd.
[17] Morsi, I., El-Din, L.M. (2014). SCADA system for oil refinery control. 47: 5-13. https://doi.org/10.1016/j.measurement.2013.08.032
[18] Essa, F.A., Abdullah, A., Majdi, H.S., Basem, A., Dhahad, H.A., Omara, Z.M., Mohammed, S.A., Alawee, W.H., Ezzi, A.A., Yusaf, T. (2022). Parameters affecting the efficiency of solar stills—Recent review. Sustainability, 14(17): 10668. https://doi.org/10.3390/su141710668
[19] Kumar, S., Roshni, T., Himayoun, D. (2019). A comparison of emotional neural network (ENN) and artificial neural network (ANN) approach for rainfall-runoff modelling. Civil Engineering Journal, 5(10): 2120-2130. https://doi.org/10.28991/cej-2019-03091398
[20] Jones, G.M., Sanks, R.L., Abelin, S.M., et al. (2008). Pumps: Intake design, selection, and installation. Pumping Station Design, pp. 12.1-12.82. https://doi.org/10.1016/B978-185617513-5.50019-6
[21] Köpp, L.M., Peiter, M.X., Robaina, A.D., Girardi, L.B. (2016). Performance indices for pumping stations in irrigated rice fields. Rural Engineering, 46: 1384-1389. https://doi.org/10.1590/0103-8478cr20150849
[22] Alsaqqar, A.S., Khudair, B.H., Jbbar, R. (2018). Condition assessment and rehabilitation for trunk sewer deterioration based on semi-Markov model. Association of Arab Universities Journal of Engineering Sciences, 25(5): 14-27. https://jaaru.org/index.php/auisseng/article/view/215.
[23] Qi, Z., Majdi, A., Basem, A., Saad, H.A., Hussin, A.M., Alawee, W.H. (2022). Modeling for converting liquid NEPCM to solid phase with involving nano-powders. Case Studies in Thermal Engineering, 39: 102462. https://doi.org/10.1016/j.csite.2022.102462
[24] Basem, A., Moawed, M., Abbood, M.H., El-Maghlany, W.M. (2022). The energy and exergy analysis of a combined parabolic solar dish–steam power plant. Renewable Energy Focus, 41: 55-68. https://doi.org/10.1016/j.ref.2022.01.003
[25] Basem, A., Moawed, M., Abbood, M.H., El-Maghlany, W.M. (2022). The design of a hybrid parabolic solar dish–steam power plant: An experimental study. Energy Reports, 8: 1949-1965. https://doi.org/10.1016/j.egyr.2021.11.236