Hatice Sözer* | Hüseyin Sözen | Duygu Utkucu
© 2020 IIETA. This article is published by IIETA and is licensed under the CC BY 4.0 license (http://creativecommons.org/licenses/by/4.0/).
OPEN ACCESS
Wastes of buildings constitute a considerable amount of these concerns. Thus, management has to be started in buildings and continue throughout districts and cities level. In this study, a big scale building was investigated based on its current waste management system via LCA methodology to assess waste management strategies through the building’s lifetime. Within the developed methodology, the building’s wastes were categorized into 3 group as municipal solid waste, wastewater and demolition waste. Firstly, the capacities of all waste types were calculated which were used as input in the developed LCA model. Additionally, existing energy performance model and Building Information Model of the building as well as specifications from Turkish Statistical Institute were utilized. Two indicators were defined to show impact of wastes; cumulative energy demand (CED) and global warming potential (GWP). The energy consumption of the building was included in LCA methodology to compose a comparative scheme between the energy usage of building and energy usage of the building’s waste management. The results showed that there was an energy recovery potential from wastes due to recycling processes; nonetheless, this potential was low compared to the building’s operational energy. In addition to the CED, overall greenhouse gases release from the waste management strategies affected the environment negatively while there was a reduction potential by recycling processes.
demolition waste, liquid waste, life cycle assessment, municipal solid waste, waste capacity, waste management
Wastes and waste management policies are a common dilemma for authorities, municipalities and countries. While population of cities is increasing, defining a suitable waste management policy is getting harder and more complicated. Population of Turkey and Istanbul is still increasing. According to Turkish Statistical Institute (TUIK), Istanbul population was approximately 13 million in 2010 that currently has already reached over 15 million [1]. If wastes are dumped in unsanitary disposal area uncontrollably, they lead to environmental and health problems. Thus, they have to be handled with a management plan. Also, processes that are applied wastes to treat them cause some environmental problems and consume energy. For this reason, waste management policies have to be developed carefully. Life cycle assessment (LCA) methodology are commonly used to investigate waste management processes. Sharma et al. [2] have defined LCA as a tool to investigate product or processes based on their environmental impact and energy consumption. There are some approaches to define system boundaries of a LCA study. The most applied approach is the cradle-to-grave, which starts from raw material extraction and ends in disposal step. On the other hand, LCA studies that consider the waste management, commonly use the gate-to-grave approach. Hence, they do not consider the production phase of materials that will turn into wastes. As an example, Di Maria and Micale [3] had examined waste management system of a region in Italy by applying the gate-to-grave approach that the production phase of materials that will turn into wastes had not considered.
1.1 Standards related with LCA
LCA standards were defined for any kind of products by International Organization for Standardization (ISO) and published as ISO 14040 and ISO 14044 [4, 5]. Standards have defined a methodology to develop an LCA that has 4 major steps: 1. goal and scope definition, which the main objective of the LCA should be identified 2. inventory analysis, which all analyzing technique to develop necessary data for LCA should be decided and data should be produced 3. life cycle impact assessment, which the impact assessment of the developed data based on defined indicators should be performed and 4. Interpretation which the results should be evaluated.
Nevertheless, British Standard Institute (BSI) published a standard that is specialized for a building’s LCA is called EN 15978. The standard divides building’s lifetime into different stages as Product, construction & installation, use and end of life to defined the LCA’s boundaries [6].
1.2 Municipal solid waste management
Municipal solid waste (MSW) and their waste management systems were investigated in literature via LCA methodology. Banar et al. [7] investigated current solid waste management system based on city scale in Eskişehir and proposed new systems via LCA methodology. Their results showed the most environmental friendly system that included 15% recycling, 77% composting and 8% landfilling. Özeler et al. [8] also examined waste management in Ankara within similar scope like as Banar et al.’ study; besides, they suggested additional source reduction. Yay [9] assessed Sakarya waste management policy; moreover, their suggested system had material recovery facility (MRF), composting, incineration and landfilling. Definition of solid waste management system is related with fraction of wastes. Fraction can show variety based on economic situation of investigated districts, habit of people, culture etc. Özcan et al. [10] investigated fraction of solid wastes in Kartal District/Istanbul. List of fraction of wastes was organic 57.69%, 8,41% plastic, 8.01% combustibles, 6.13 % glass and 19.76 % the others. Yıldız et al. [11] worked on city scale in Istanbul to define fraction distribution of solid wastes; besides, their results also showed similar distribution. While the highest percentage was organic with 53.73%, the second is paper/cardboard with 16,75%, the third one is plastic with 12,88%, and the others is 16,67%. TUİK reports solid waste generation rate for cities annually. Because Istanbul is the most crowded city in Turkey, its rate is always higher than the other cities. MSW generation rate for Istanbul was 1.3 kg/cap./day in 2016 [1].
1.3 Liquid waste management
Buildings also generate liquid wastes in addition to solid waste. Based on impact and amount, the most important liquid waste type from buildings is domestic wastewater. While domestic wastewater includes various pollutants, the most important pollutants are biochemical oxygen demand (BOD), chemical oxygen demand (COD), nitrogen types, phosphorus and suspended solid [12-14]. Istanbul Water and Sewerage Administration (İSKİ) is aware pollutants that inside of wastewater; thus, the number of wastewater treatment plant are increasing year by year. There are 81 wastewater treatment plants inside of Istanbul Municipality’s borders [15]. In addition to the wastewater, the other liquid waste from buildings is rainwater. Rainwater has also high saving capacity. Rainwater collection systems have used for household or irrigation purpose for centuries [16]. Using rainwater as domestic water without treatment can be dangerous for human health because of pollutant and pathogens. Simmons et al. [17] investigated on 125 domestic rooftop rainwater systems, and their samples included Salmonella, Aeromonas and Cryptosporidium that are pathogens for people. Also, some surveys showed that rainwater can be used for garden irrigation, toilet flushing, clothes washing, even for drinking and cooking [18, 19]. According to İSKİ database, generation rate of municipal wastewater in Istanbul was 226 L/cap./day in 2016 [1]. This rate also is higher than other cities due to same reasons in municipal solid wastes.
1.4 Demolition waste management
Municipal solid wastes and liquid wastes are generated during building in use stage. After buildings life time ends, their structural materials are tear to pieces to get the demolition wastes. Fraction of demolition wastes shows differences based on building type, main purpose of buildings and main structure materials. A survey was made to analyze demolition waste fraction in UK; the results showed that the most abundant material was concrete based on the amount of materials. Concrete involved 59.28% of total amount. Also, inert materials are 20.98% and metals is 9.98% [20]. Andrea [21] investigated residential demolition waste in Turin; moreover, the result demonstrated that the most common material was concrete based on the amount. Ding and Xiao [22] assessed demolition wastes from residential and non-residential based on construction time group as before 1980, 1980-1999 and after 2000 in China. Therefore, they also investigated changes on China’s building sector. Brière et al. [23] calculated the characteristic of demolition waste based on their amount as masonry (52.8%), reinforced concrete (26.4%), mixed inert waste (9.3%) and other (11.5%).
In Turkey on the other hand, most research about the waste management were developed to investigate the current waste management policies and exploit different scenarios on the city or district scale. The wastes from buildings, districts or cities were investigated in Turkish literature separately. Also, MSW, liquid waste and demolition waste of buildings were investigated separately in existing global literature. MSW and wastewater were assessed in district or city level while demolition wastes were examined in building level. Nonetheless, Sözer and Sözen [24] investigated a building’s waste capacity that included MSW, wastewater and demolition wastes. They have suggested a waste management plan and evaluated its impact. The result showed that there was an energy recovery potential from recycling processes.
The purpose of this research is to investigate the waste potential and waste management of a building during its life time. LCA was developed based on two indicators to show impact of wastes; cumulative energy demand (CED) and global warming potential (GWP). The case study building represents the similar characteristics and conditions with residential Turkish buildings in terms of construction materials, technics and operational use. The difference between this study and the other studies is that all waste types that can be generated from a building were examined; also, the current waste management plan was assessed to manage whole waste processes.
Methodology of the study was set based on ISO 14040, 14044 and EN 15978 standards. Accordingly, the methodology has 4 main steps; goal and scope definition, inventory analysis, life cycle impact assessment and interpretation as modified and applied for this study as represented on Figure 1.
Figure 1. Applied methodology for the case study
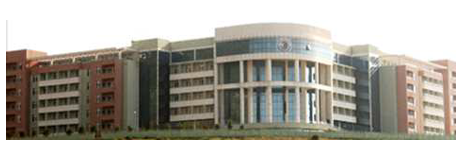
A case building was examined to evaluate the waste capacity within the current waste management system in the district via LCA methodology. It is an elderly house located in the Kartal District of Istanbul, Turkey. Image of the building is represented on Figure 2.
Figure 2. Image of the case building
2.1 Goal and scope definition of the study
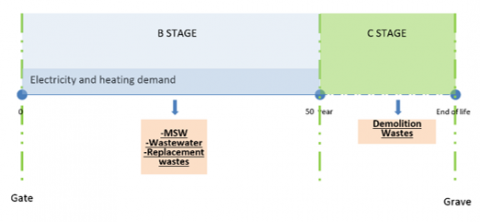
Goal of the study is to give a well-defined description of the purpose; besides, scope of the study was clarified according to this goal. The goal of the study is investigating waste potential of the case study building within current waste management policy based on global warming potential and energy flow via LCA methodology. The system boundaries were set based on gate-to-grave approach; hence, production of materials that turn into wastes were not included in the model. Only generated wastes and their end of life scenario according to current waste management system in the building were assessed. EN 15978 standard was used during definition of the system boundaries. As it was mentioned in introduction section, EN 15978 divides the building life time into product, construction & installation, use, end of life and beyond the system boundaries stages [6]. Only use (B) and end of life (C) stages were added to the model. Consequently, the question would be the energy recovery from the waste process could compensate the energy consumption of the building.
The building life time was defined as 50 years. Accordingly, the amount of MSW and wastewater along with the wastes from replacement and maintenance processes were calculated and added in the model. Additionally, demolition wastes, which will be generated after the building life time finishes were also considered. The models were developed in 5 steps. (1) Waste potentials of all MSW, waste water and demolishing waste were defined. (2) Operational energy demand of the building was obtained from energy simulation model. (3) Current waste management systems were defined based on data of municipality, ISKI and ISTAC. (5) All processes were added to the models carefully. Thus, energy recovery rate from the wastes were compared with primary energy demand of the operational energy consumption of the building during 50 years. System boundaries of the study is shown in Figure 3 in detail.
Figure 3. System boundaries based on gate-to-grave approach
2.1.1 The case study building description
The case study building is an elderly house that was designed to service 456 elderly people and100 employees. It is a big scale building, which has 8 stores with 18,108 m2 conditioned floor area. The building was constructed in 2000s; nonetheless, it had some damages from past inhabitants. Because of that, it was retrofitted between 2013 and 2018 with the aim to improve its energy efficiency according to a European Union Project’s scope, which is called R2Cities [24]. The building has started its service life after March 2018. The retrofitted activities included building envelope, Heating, Ventilation, And Air Conditioning (HVAC), and electrical systems; thus, the building lifetime was extended approximately 50 year more after 2018.
Due to elderly services, characteristic of wastes show variance from organic to electronic wastes. Besides, Building Information Modeling (BIM) and Energy Performance Model of the building were developed to get the amount of the demolition wastes and operational energy consumption. During inventory list steps, 456 elderly people were defined as residents; moreover, they live on the building 24 hours in a day. On the other hand, employees were added to the model based on their daily shift that is 8 hours in a day.
2.1.2 Current waste management in the case study buildings
The current waste management system of the building was evaluated in this study. The waste types were defined as MSW, wastewater and demolition waste. MSW are collected daily in containers by services trucks of Kartal Municipality to be transferred to the closest transfer station. There are 4 station in Anatolian part of Istanbul. The closest transfer station to the building is Aydınlı Transfer Station that is 18 km away to the building. The process that is applied to the MSW in the station is pressing to decrease volume of waste. After the transfer station, MSW are transferred to the closest sanitary landfill area. There are 2 main landfill area in Istanbul where are located in European and Anatolian parts. The MSW are sent to the Anatolian part that its name is Kömürcüoda Landfill Area. The landfill is managed by Istanbul Metropolitan Municipality Environmental Protection and Waste Materials Valuation Industry and Trade Co. The distance between Aydınlı Transfer Station and Kömürcüoda Landfill Area is approximately 49 km. The landfill has recycling, composting and landfill processes for MSW. Mechanical processes are applied to divide the wastes into two different categories for composting and recycling. Recycling materials are divided in terms of their raw material such as glass, metal. Compressed products are used in cement industry as fuel. The residual wastes are buried into landfill area. Leachate is collected with pile line to treatment; besides, biogas comes from wastes is collected to generate electricity. According to Istanbul Municipality database, 84% of municipal wastes are send to landfill area, 6% of them are recycled, and %10 of them are used for composting or bio-drying [25]
Wastewater treatment management system on the building is managed by Istanbul Metropolitan Municipality and Istanbul Water and Sewerage Administration (ISKI). Wastewater that is generated in the building is collected by pipes in plumbing system to merge with district sewerage system. All wastewater come from the district are transferred to the closest wastewater treatment plant. The closest one’s name is Tuzla Advanced Biological Wastewater Treatment Plant. The building does not have a rainwater collection system.
Due to maintenance and replacement processes during the building in use time and demolition stage, demolition wastes occur. Responsibility of the demolition wastes belongs to the building owner. After demolition wastes are generated, the building owner has to send them to the facilities of demolition wastes.
2.2 Inventory analysis
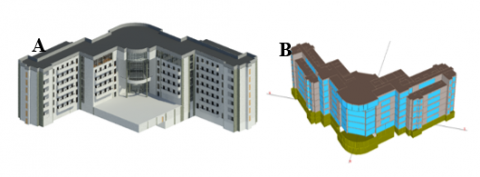
The inventory list of the system was created in this step. Three different waste types were defined in the study as municipal solid waste, domestic wastewater and demolition waste. The capacities of waste types were calculated one by one. The amount of MSW and domestic wastewater were calculated by help of TUIK database [1]. Also, fraction of MSW was obtained from the existing research. BIM of the case study building was developed by utilizing the Revit software© [26] and used to define the amount of demolition wastes. All materials types that were used in the building construction were defined in the model layer by layer; besides, material file was created for the building. In addition to the defined wastes, operational energy consumption of the building was included into the model. The energy consumption of the building was obtained from energy performance model, which was developed and analyzed by Design Builder software © [27]. Developed BIM and energy performance models are represented in Figure 4.
Figure 4. A. BIM Model - B. Energy Performance Model of the building
2.2.1 Capacity of wastes
The amount of defined waste types was calculated based on the existing research to be used as input in the developed LCA model. Firstly, total inhabitant in the building was calculated as 456 elderly people in addition to 100 employees who work for different purpose such as administrators, nurses, cleaners, cookers. Employees work only 8 hours in a day depend on their work shift, which were taken in account in the calculation. MSW generation rate was obtained from TUIK database as 1.3 kg/cap/day [1]. Capacity of the MSW was calculated as 232.2 ton/year; besides, the calculation that was made to calculate capacity of the MSW are given in Equation 1.
Capaciy of the MSW $=456x1.3+100x\frac{1.3}{3}$
$=636^{k g} / d a y$
$=232.2^{\text {ton }} /$ year (1)
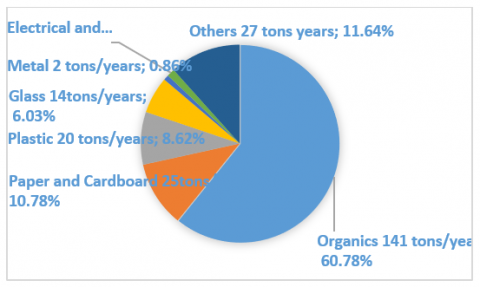
Municipal solid waste management systems are also related with fraction of the MSW; hence, requirement recycling, composting, incineration or disposal processes are added to the system based on fraction. Literature data were used to define fraction of the MSW and the amount of sub-waste from the building [9]. The fractions of MSW and their amount during 50 years from the case study building are shown on Figure 5. In LCA model, sub-categories of MSW were classified into 6 groups, as organic (organic and garden waste), paper (paper, cardboard and bulky cardboard), plastic, glass, metal (metal and electrical and electronic equipment) and others (hazardous wastes, other non-combustibles, other combustibles, other bulky combustibles and ash).
Figure 5. Fraction and amount of the MSW
The other waste type that was defined in this study was wastewater. The total amount of wastewater was calculated similar to the MSW calculation. Generation rate for wastewater in Istanbul is 226 L/cap./day [1]. Capacity of wastewater from the building is 40,515 m3/year; as the calculation is given in Equation 2.
Capaciy of the wastewaster $=456x226+$ $100 x \frac{226}{3}=110,589 ~ L / d a y=40,515^{m^{3}} /$ year (2)
The final waste type was demolition wastes. Capacity of demolition wastes was calculated via using Building Information Modeling (BIM) of the building. The fractions of demolition wastes and their amounts are given on Figure 6.
Figure 6. Amount of Demolition wastes
2.2.2 Operational energy consumption
Operational energy consumption of the building was also investigated via LCA methodology to make comparison with current waste management system. The LCA model results were included in energy performance analysis to assess the overall energy consumption of the building to achieve the nearly zero energy concept with defined waste management systems. As mentioned above operational energy consumption of the building was obtained from energy performance model into 2 groups as heating and electricity demand. The heating consumption is 138 kWh/m2.year, and electricity consumption is 81 kWh/m2.year as final-energy use.
At the end, the amount of all waste types was calculated for 50 year time period; also, the amounts are shown in Figure 7.
Figure 7. Defined processes for the all waste types during 50 year of process
2.3 Life cycle impact assessment
In this step, SimaPro© software version 8.5 and Ecoinvent database version 3.4 were utilized to develop LCI models [28]. After the inventory list was created, all input was added to the model. According to the goal of the study, results were showed based on two indicators; global warning potential (GWP) and cumulative energy demand (CED).
As mentioned, LCA model that was developed with SimaPro software [26] for three waste types; MSW, wastewater and demolition waste for the building life time. While the overall results were obtained, they were also explained in detail, based on processes such as transportation, recycling, sanitary landfill, composting and wastewater treatment. In addition, CED and GWP of MSW were investigated according to sub-categories wastes such as organic, metal. On the other hand, wastewater and demolition wastes results were given as generally.
2.4 Interpretation
CED results of the current waste management system were represented based on waste types in Table 1. Waste processes were categorized as transportation, recycling, sanitary landfill, compost, wastewater treatment and cumulative; besides, percentage of applied processes to the wastes were given in percentage column. Percentage of applied processes were obtained from Istanbul Municipality Database [29]. As it seen from the results, there is an energy recovery potential from recycling process; however, these potentials were comparatively low when operational energy consumption was taken in account. Transportation consumed energy due to fuel demand. Sanitary landfill, compost and wastewater treatment process also caused energy consumption because of sub-processes. The most effective waste type was demolition wastes; besides, only MSW management system had energy recovery potential on cumulative results.
Table 1. CED results of waste types
|
Waste Scenario |
Transportation (kWh/50year) |
Recycle (kWh/50year) |
Sanitary Landfill (kWh/50year) |
Compost (kWh/50year) |
Wastewater Treatment (kWh/50year) |
CED (kWh/50year) |
||||
|
MSW |
1,252,800 |
-9,013,950 |
6% |
1,068,050 |
84% |
113,200 |
10% |
- |
-6,466,450 |
|
|
Glass |
76,800 |
-791,650 |
22% |
60,850 |
78% |
- |
|
- |
-654,100 |
|
|
Metal |
28,200 |
-250,000 |
22% |
22,200 |
78% |
- |
|
- |
-199,700 |
|
|
Paper |
137,650 |
-3,847,250 |
22% |
109,050 |
78% |
- |
|
- |
-3,598,500 |
|
|
Plastic |
105,400 |
-4,083,350 |
22% |
83,900 |
78% |
- |
|
- |
-3,898,150 |
|
|
Organic |
761,100 |
- |
|
643,050 |
83% |
113,200 |
17% |
- |
1,516,850 |
|
|
Others |
145,700 |
- |
|
147,200 |
100% |
- |
|
- |
293,500 |
|
|
Operational Energy |
- |
- |
|
- |
|
- |
|
- |
352,940,650 |
|
|
Wastewater Treatment |
- |
Municipal Wastewater Treatment |
119,050 |
119,050 |
||||||
|
Demolition Wastes |
363,900 |
-750,000 |
24% |
1,452,800 |
76% |
- |
|
- |
1,068,600 |
|
Model of MSW showed that their current management systems recovers 6,466,450 kWh/50year energy. On the other hand, demolition waste management system causes 1,068,600 kWh/50year consumption. Overall result demonstrated that MSW, wastewater and demolition wastes management systems can recover 5,324,600 kWh/50year. The building conditioned area is 18, 108 m2; hence, the energy recovery rate from the management system of all waste type is 294 kWh/m2.50year. When the operational energy consumption was taken in account, this recovery rate can compensate only 1.5% of operational energy during 50 years.
GWP results of the current waste management systems were given in Table 2 as in Table 1’s format. While there were reducing potential via recycling processes, cumulative GWP for whole waste types released greenhouse gases to the atmosphere. Thus, overall result displays that MSW, wastewater and demolition wastes management systems caused 11,777,850 kgCO2eq./50year greenhouse gases emissions. If the building conditioned area was considered such as in CED results, 650 kgCO2eq./m2.50year greenhouse gases released to the atmosphere due to the current waste management system. The most effected waste sub-group in GWP is organic and demolition wastes due to their buried processes into sanitary landfill areas.
Table 2. GWP results of waste types
|
Waste Scenario |
Transportation (kgCO2eq./50year) |
Recycle (kgCO2eq./50year) |
Sanitary Landfill (kgCO2eq./50year) |
Compost (kgCO2eq./50year) |
Wastewater Treatment (kgCO2eq./50year) |
Cumulative GWP (kgCO2eq./50year) |
|||
|
MSW |
302,500 |
-840,000 |
6% |
6,100,000 |
84% |
241,500 |
10% |
- |
5,853,400 |
|
Glass |
18,800 |
-199,000 |
22% |
350,000 |
78% |
- |
|
- |
169,800 |
|
Metal |
6,900 |
-95,500 |
22% |
128,000 |
78% |
- |
|
- |
39.,350 |
|
Paper |
33,250 |
-129,250 |
22% |
625,000 |
78% |
- |
|
- |
498,250 |
|
Plastic |
25,750 |
-384,500 |
22% |
480,500 |
78% |
- |
|
- |
122,050 |
|
Organic |
186,000 |
- |
|
3,685,000 |
83% |
241,500 |
17% |
- |
4,111,800 |
|
Others |
35,650 |
- |
|
845,000 |
100% |
- |
|
- |
881,450 |
|
Operational Energy |
- |
- |
|
- |
|
- |
|
- |
83,572,700 |
|
Wastewater Treatment |
- |
Municipal Wastewater Treatment |
33,150 |
33,150 |
|||||
|
Demolition Wastes |
74,200 |
-2,501,900 |
24% |
8,320,500 |
76% |
- |
|
- |
5,892,800 |
Capacity of wastes from a case study building were calculated; also, the current waste management system was assessed via LCA methodology in this study. The wastes were categorized into 3 groups as MSW, wastewater and demolition waste. The system boundary of the study was set gate-to-grave; thus, production of materials that turned to the wastes did not investigate based on scope of the study. In addition, functional unit was defined as 50years.
When the primary energy consumption of operational energy and the current waste management systems were investigated, there was an energy recovery potential from current waste management system. However, this potential can cover only 1.5% of operational energy consumption. Recovery rate potential came from paper and plastic wastes mainly.
The current waste management system was developed to avoid environmental pollution; nonetheless, the current system also released greenhouse gases to the atmosphere due to sub-processing. While there was reduction by helps with recycling, overall GWP results were positive for all waste types. The reason for that was sanitary landfill processes. In current systems, landfill percentage is higher than the other processes; besides, this situation affects released greenhouse gases from the whole system. While the reduction rate from recycling was 3,341,900 kgCO2eq./50 years, cumulative released greenhouse gases to the system was 11,746,200 kgCO2eq./50 years.
The CED results of investigated waste types and operational energy consumption are given on Figure 8. The red color represents the energy consumption while the green color represents the energy recovery potential. As it seen there is an energy recovery potential from MSW; nonetheless, its rate was comparatively low. Recycling rate is 6% in current MSW management system. If this rate increase, energy recovery potential can also increase directly.
Figure 8. CED results of all inputs during 1 year
The results of the study showed importance of recycling processes to increase energy recovery rate and to decreased released greenhouse gases to the atmosphere; besides, the results would be valuable for municipalities or authorities to develop new waste management system.
[1] Turkish Statistical Institute (TUIK) Database, http://www.tuik.gov.tr/, accessed on Aug. 25, 2018.
[2] Sharma, A., Saxena, A., Sethi, M., Shree, V. (2011). Life cycle assessment of buildings: A review. Renewable and Sustainable Energy Reviews, 15(1): 871-875. https://doi.org/10.1016/j.rser.2010.09.008
[3] Di Maria, F., Micale, C. (2014). A holistic life cycle analysis of waste management scenarios at increasing source segregation intensity: The case of an Italian urban area. Waste Manag., 34(11): 2382-2392. https://doi.org/10.1016/j.wasman.2014.06.007
[4] ISO 14040. (2006). Environmental management: Life cycle assessment. Principles and guidelines. International organization for standardization, Geneva.
[5] ISO 14044. (2006). Environmental Management - Life Cycle Assessment – Requirements and Guidelines. International organization for standardization, Geneva.
[6] EN 15978. (2011). Sustainability of construction works – Assessment of environmental performance of buildings – Calculation method. British Standard Institute, London.
[7] Banar, M., Cokaygil, Z., Ozkan, A. (2009). Life cycle assessment of solid waste management options for Eskisehir, Turkey. Waste Manag., 29(1): 54-62. https://doi.org/10.1016/j.wasman.2007.12.006
[8] Özeler, D., Yetiş, Ü., Demirer, G.N. (2006). Life cycle assesment of municipal solid waste management methods: Ankara case study. Environ. Int., 32(3): 405-411. https://doi.org/10.1016/j.envint.2005.10.002
[9] Erses Yay, A.S. (2015). Application of life cycle assessment (LCA) for municipal solid waste management: A case study of Sakarya. J. Clean. Prod., 94(1): 284-293. https://doi.org/10.1016/j.jclepro.2015.01.089
[10] Ozcan, H.K., Guvenc, S.Y., Guvenc, L., Demir, G. (2016). Municipal solid waste characterization according to different income levels: A case study. Sustain., 8(10): 1044. https://doi.org/10.3390/su8101044
[11] Yıldız, Ş., Yaman, C., Demir, G., Ozcan, Kurtulus, H., Çoban, A., Ökten, H.E., Sezer, K., Gören, S. (2014). Characterization of Municipal Solid Waste in Istanbul, Turkey, Environmental Progress & Sustainable Energy, 32(3): 734-739. https://doi.org/10.1002/ep.11640
[12] Orhon, D., Ateş, E., Sözen, S., Çokgör, E.U. (1997). Characterization and COD fractionation of domestic wastewaters. Environ. Pollut., 95(2): 191-204. https://doi.org/10.1016/S0269-7491(96)00111-X
[13] Aziz, S.Q., Ali, S.M. (2017). Characterization of municipal and dairy wastewaters with 30 quality parameters and potential wastewater treatment by biological trickling filters. Int. J. Green Energy, 14(13): 1156-1162. https://doi.org/10.1080/15435075.2017.1370594
[14] Sari, S., Ozdemir, G., Yangin-Gomec, C., Zengin, G.E., Topuz, E., Aydin, E., Pehlivanoglu-Mantas, E., Okutman Tas, D. (2014). Seasonal variation of diclofenac concentration and its relation with wastewater characteristics at two municipal wastewater treatment plants in Turkey. J. Hazard. Mater., 272: 155-164. https://doi.org/10.1016/j.jhazmat.2014.03.015
[15] Istanbul Water and Sewerage Administration Database, https://www.iski.istanbul/web/tr-TR/kurumsal/iski-hakkinda1/aritma-tesisleri6/atiksu-aritma-tesisleri2, accessed on Jan. 10, 2018
[16] Pandey, D.N., Gupta, A.K., Anderson, D.M. (2003). Rainwater harvesting as an adaptation to climate change. Curr. Sci., 85(1): 46-59.
[17] Simmons, G., Hope, V., Lewis, G., Whitmore, J., Gao, W. (2001). Contamination of potable roof-collected rainwater in Auckland, New Zealand. Water Res., 35(6): 1518-1524. https://doi.org/10.1016/S0043-1354(00)00420-6
[18] Heyworth, J.S., Glonek, G., Maynard, E.J., Baghurst, P.A., Finlay-Jones, J. (2006). Consumption of untreated tank rainwater and gastroenteritis among young children in South Australia. Int. J. Epidemiol., 35(4): 1051-1058. https://doi.org/10.1093/ije/dyl105
[19] Hollander, R., Bullermann, M., Gross, C., Hartung, H., Konig, K., Lucke, F.K. (1996) Microbiological and hygienic aspects of the use of rainwater as process water for toilet flushing, garden irrigation and laundering. Das Gesundheitswes.,58(288): 93.
[20] Zakar, S. (2009). Overview of Demolition Waste in the UK. Construction resources & waste platform.
[21] Andrea, G. (2009). Life cycle of buildings, demolition and recycling potential: A case study in Turin, Italy. Building and Environment, 44(2): 319-330. https://doi.org/10.1016/j.buildenv.2008.03.007
[22] Ding, T., Xiao, J. (2014). Estimation of building-related construction and demolition waste in Shanghai. Waste Manag., 34(11): 2327-2334. https://doi.org/10.1016/j.wasman.2014.07.029
[23] Brière, R.; Feraille, A., Tardivel, Y., Baverel, O. (2014). Environmental approach of the end-of-life of buildings. In AvniR Conference.
[24] Sözer, H., Sözen, H. (2018). Investigation of the capacity and saving potential of building wastes with life cycle assessment (LCA) methodology. 9th International Conference on Waste Management and the Environment, Seville.
[25] Istanbul Municipality Database, https://www.ibb.istanbul/, accessed on May 5, 2016.
[26] BIM-Autodesk Inc., 2018. Revit | BIM Software | Autodesk.” [Online]. https://www.autodesk.com/products/revit/overview, accessed on Sept. 1, 2018.
[27] DesignBuilder Software Ltd. DesignBuilder (v5.3.0.008), https://www.designbuilder.co.uk/, accessed Sep. 3, 2018
[28] Pre Sustainability, SimaPro 8.5.0.0. https://simapro.com/, accessed on Aug. 8, 2018
[29] 7th Framework EU Project. (2018). Residential renovation towards nearly zero energy cities (R2Cities). Project no: 314473.