Ali Abbas Salman* | Audai Hussein Al-Abbas![]() | Hani Mizhir Majid
| Hani Mizhir Majid![]()
© 2025 The authors. This article is published by IIETA and is licensed under the CC BY 4.0 license (http://creativecommons.org/licenses/by/4.0/).
OPEN ACCESS
In rural regions of Iraq, water scarcity has become a pressing challenge. Solar desalination techniques, which rely heavily on solar energy, present a viable solution for mitigating this issue. Among these techniques, solar stills were commonly utilized, though they were typically associated with low productivity. This study explores the enhancement of water production in solar stills by introducing two pyramid-shaped solar stills, which are fabricated and evaluated under identical operational conditions. This research concentrated on altering the glass cover to enhance the efficiency of solar stills. An M-shaped glass cover is examined through numerical models and experimental techniques. The research entailed the fabrication and evaluation of two solar stills, each with 1 m² basin absorber plates. The initial solar still utilised a traditional pyramid configuration, whilst the subsequent one featured an inverted pyramid form with an M-shaped octahedral glass canopy. The experimental and numerical findings demonstrated a significant enhancement in water distillation, with the modified solar still attaining a 22% increase in distilled water output relative to the traditional pyramid design, including a regular glass cover.
absorber plate, desalination, M-shape glass cover, pyramid solar still, productivity of solar still, solar still
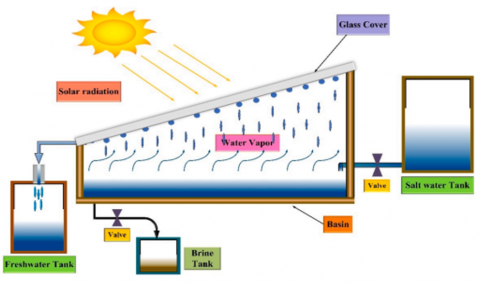
The expanding global population and economy are transforming societies and exacerbating issues, particularly in water-scarce areas. Ensuring sustainable access to water is essential due to rising demand [1]. Despite the abundance of water on Earth, merely 2.5% is freshwater, and a scant 0.03% is readily accessible. Contaminated water leads to illnesses; therefore, potable water is crucial for optimal health [2]. Life is contingent upon water, and its scarcity poses significant challenges, especially as the population increases [3]. Freshwater scarcity is escalating, and conventional solutions are inadequate. Innovative solutions are required for access to clean water. Reverse osmosis may be beneficial; nonetheless, it necessitates substantial energy consumption and incurs high costs [4]. Solar energy is the primary kind of renewable energy utilised for heating and electricity generation. The International Energy Agency (IEA) anticipates that it will fulfil less than 46% of global energy requirements by 2050 [5]. The significance of solar energy in reducing carbon emissions is increasingly recognised; projections indicate that by 2030, it might fulfil approximately one-third of global energy requirements, predominantly from urban areas [6]. Solar stills are straightforward and economical for sun desalination; nevertheless, they yield minimal daily distillate. This has prompted investigations into enhancing their thermal efficiency and examining novel designs [7, 8]. Solar energy serves as a valuable and cost-effective renewable resource, especially in thermal systems utilised for desalination processes that produce distilled water by evaporation and condensation [9, 10]. The system can efficiently desalinate saltwater for a week without a decline in effectiveness, with possible efficiency enhancements reaching up to 90% [11]. Solar desalination runs at optimal efficiency during peak radiation levels. Features an average of 333 clear days and a peak solar intensity of 1250 W/m² [12, 13]. Solar stills utilise solar energy to convert contaminated water into potable water by eliminating pollutants via evaporation and condensation. They operate by heating salt or brackish water, resulting in evaporation and the deposition of salt. The vapour subsequently condenses on a cool surface, accumulating as pure water. The method utilises variations in temperature and salinity to generate air convection currents [14-16]. Solar stills are categorised into two types: passive and active. Active stills utilise additional energy sources and incur higher costs, whilst passive stills depend solely on solar energy and are more economical [17, 18]. The initial phase involved constructing a basic, traditional solar still. A transparent plastic or glass vessel surrounded by a simple basin filled with saline water constitutes the essential element of a solar still. The sun's energy heats water until it evaporates. After distillation on the inner surface of the cool cover, the purified water is collected in troughs as seen in Figure 1 [19, 20]. Solar still production is influenced by salinity, wind speed, material coatings, water depth, glass cover thickness, cover angle, ambient temperature, and solar radiation. Water depth affects yields; therefore, inclined designs are more economical and efficient. Solar radiation is essential, whereas wind speed and salinity diminish productivity. Seasonal variations in glass cover orientation augment solar absorption [21, 22]. A compact unit, approximately one square metre, can supply sufficient potable water for an individual at minimal expense, potentially alleviating water scarcity [23].
Figure 1. Diagram of a conventional solar still [23]
The problem with distillation devices is the low production efficiency. Through reviewing research and reading the literature, ideas were generated to improve and increase the production efficiency of the desalination system using solar energy. This is achieved by modifying the restrictive pyramidal shape of the glass cover. The aim of the current study is to enhance the performance of a solar still. using the design, construction, and experimental testing of a new M-shape solar still. This innovative design includes a series of savvy changes to the top glass platform, minimizing in particular the vertical gap of said platform. cover. The surface and inner glass surface are so designed as to improve condensation efficiency. The ultimate objective of this study is to maximise distillate production by improving both evaporation and condensation. In comparison with the conventional pyramid solar still, the proposed M-shaped type of device offers more heat input area and less thermal loss through strengthened insulation effect and specific structural design. To achieve this, several performance-improving features have been introduced, such as the use of selective coating materials applied in the absorber surface, inclusion of thermal insulation to minimize energy dissipations, and the modification of the glass inclination to optimise sun incident angles. The experimental apparatus was fabricated from food-grade aluminium for the basin, 4 mm transparent glass for the cover, and fibreglass insulation for thermal retention. A collection of sensors and data capture devices was implemented to monitor temperature distributions, solar intensity, and distillate yield. This study is founded on a comprehensive experimental analysis performed in authentic outdoor circumstances, facilitating precise evaluation of thermal performance and water production efficiency.
2.1 Designing an experimental device
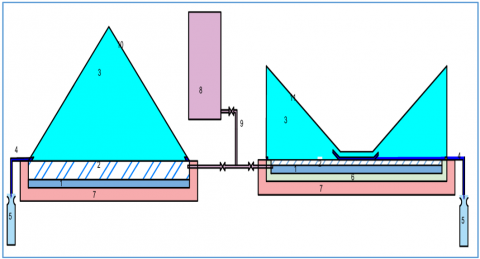
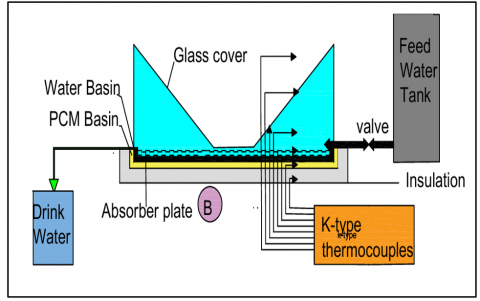
The experimental study was conducted in Iraq, Holy Karbala (Latitude 32.5° N, Longitude 44° E) during April 2025. Solar irradiance levels ranged from 800 to 950 W/m², with ambient temperatures varying between 35℃ and 45℃. Two distinct solar still designs were fabricated for this study: A conventional pyramid-shaped model and an M-shaped IPND-SS model. Both models utilized 1 m² food-grade aluminum basins, equipped with a 4 mm thick glass cover and 5 cm of polyurethane foam insulation to minimize heat loss, as illustrated in Figure 2. The experiments involved the use of 3 cm of saline water in each solar still, with hourly measurements recorded for 11 hours from 7 AM to 6 PM under clear sky conditions. To collect the distilled water, a half-open channel was positioned at the base of the inner glass wall, with a horizontally cut 2.5 cm diameter stainless steel pipe used for water collection.
Figure 2. A diagram showing the traditional pyramid shape and IPND-SS
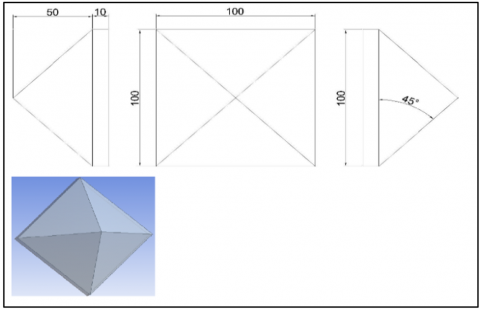
Figure 3. Diagram of TSS with dimensions
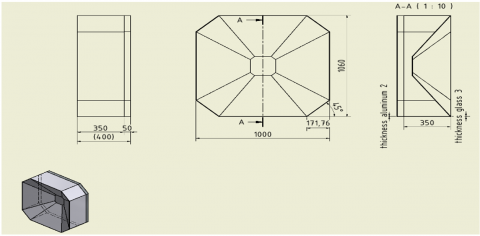
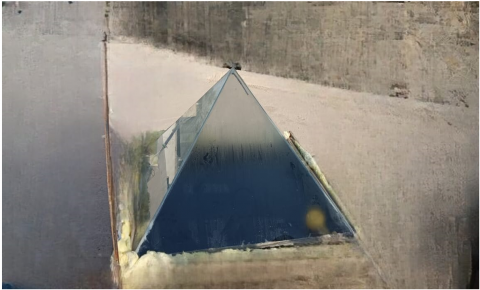
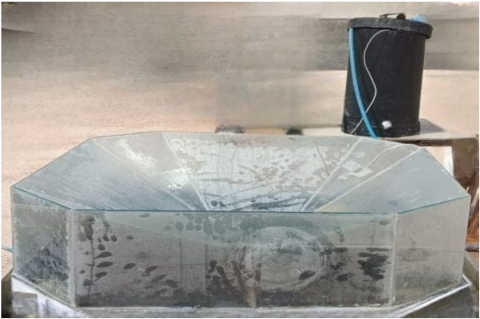
The glass cover for the solar stills was constructed from eight individual pieces, each 4 mm thick. The top cover components were inclined at a 35° angle relative to the ground, with the exception of a square piece (18 cm per side), which was positioned horizontally. These components together created an inverted pyramid structure, which was specifically designed to optimize the capture of solar radiation. The key innovation of this design lies in the modification of the conventional pyramid shape into an inverted pyramid configuration. This alteration was intended to preserve a consistent condensation area while reducing the gap between the water surface and the inner glass cover. The inverted pyramid design aims to improve thermal efficiency by maximizing the condensation area and minimizing the distance for vapor transport. The study involved a comparative analysis between the traditional pyramid-type solar still, as shown in Figure 3, and the newly developed inverted pyramid (M-shaped) still IPND-SS, as shown in Figure 4. Hourly data were collected throughout the experiment, including measurements of ambient temperature, solar radiation, glass surface temperature, basin water temperature, absorber plate temperature, and hourly distilled water output. The results of the comparison are illustrated in Figures 5 and 6, which depict the configurations of the conventional pyramid and M-shaped solar stills, respectively.
Figure 4. Diagram of IPND-SS with dimensions
Figure 5. Experimental traditional pyramid
Figure 6. An inverted pyramid, M-shape
A comprehensive figure, produced with AutoCAD, depicts the strategic positioning of heat thermocouples at essential locations within both distillation apparatuses. Figure 7 illustrates the distribution of thermocouples in the inverted pyramid (M-shaped) solar still, which are employed to monitor temperatures at the water basin, within the water, in the gap between the inner glass and the water surface, on the inner glass, on the outer glass, and in the ambient environment. This advanced instrumentation enables accurate measurement and analysis of heat distribution throughout solar still systems.
Figure 7. Schematic diagram of IPND-SS, M-shape solar still with thermocouples
2.2 Experimental procedure
1. The experimental procedure commenced by filling each solar still with a fixed depth of saline water (3 cm) in the basin.
2. Both the traditional pyramid and the newly developed inverted pyramid (M-shape) stills were positioned side by side under identical outdoor weather conditions to ensure reliable comparison.
3. Temperature sensors (K-type thermocouples) are strategically placed at various key locations—including the water surface, basin plate, inner glass cover, and ambient air—to continuously monitor thermal behavior throughout the day.
4. Measurements of solar radiation are recorded while the hourly distillate yield is collected and measured using graduated cylinders.
5. Data are recorded at 60-minute intervals from 7:00 AM to 6:00 PM to analyse the thermal performance and water productivity of each design.
6. Principal observations encompassed the initiation of evaporation, emergence of vapour, creation of droplets, saline water level, and the cumulative volume of distilled water gathered over time.
7. Temperature and sun radiation data are consistently documented. The experiment concluded in the afternoon when solar intensity diminished.
2.3 Measurement devices
2.3.1 Meter for solar power
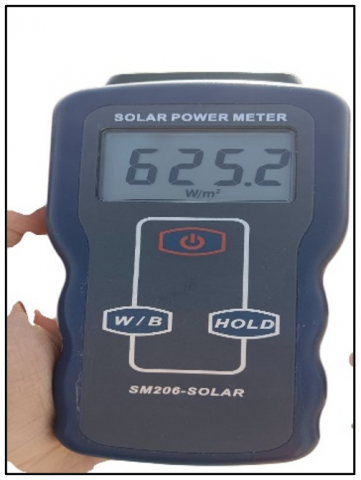
The total solar irradiance in the plane where the absorber plate is located was measured using a digital reading of the solar power meter type SM206-SOLAR, as shown in Figure 8, in Iraq, Karbala.
Figure 8. Solar power meter
2.3.2 Flow meter
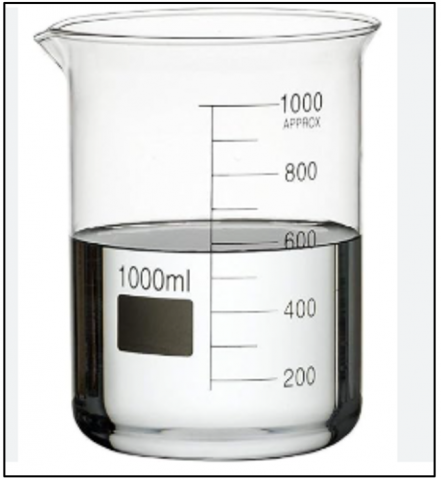
The volume of water produced per day and per hour was measured using a beaker with graduations from 200 ml to 1000, as shown in Figure 9.
Figure 9. Glass beaker
2.3.3 Temperature meters and thermocouples
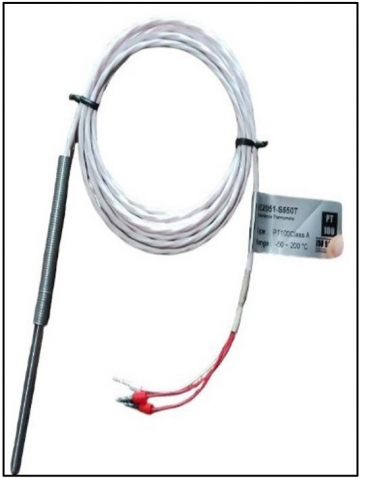
The temperature is recorded by a PLC Program and stored on the C-drive using a temperature recorder (type DVP-14SS2 & DVP-04PT), which has 8 channels, as shown in Figures 10 and 11.
Figure 10. Units of PLC program
Figure 11. Thermocouple
3.1 Geometry of test section
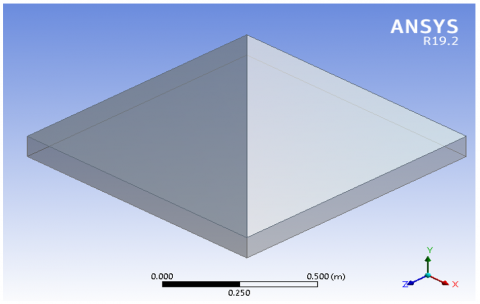
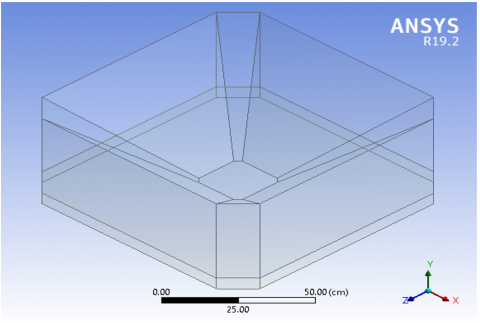
The numerical analysis of the solar distillation system was conducted using ANSYS Workbench version 19.2, employing the Design Modeler for the development of both simple and advanced engineering forms. The software was utilized to calculate the daily performance of water distillation and to solve the governing equations for mass, momentum, and energy conservation. The three-dimensional model of the solar distillation system was developed with geometric specifications consistent with the experimental setup. Figure 12 illustrates the initial pyramid-shaped solar still model, while Figure 13 displays the updated design for the solar still's top cover.
Figure 12. Pyramid solar still (TSS)
Figure 13. 3D new design solar still (IPND-SS)
3.2 Mesh generation
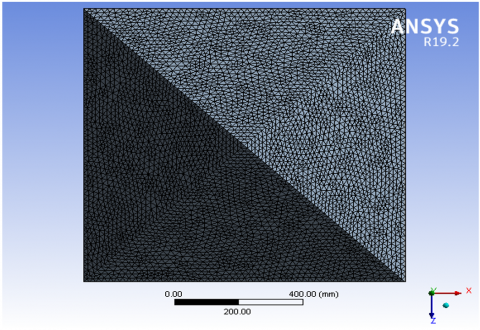
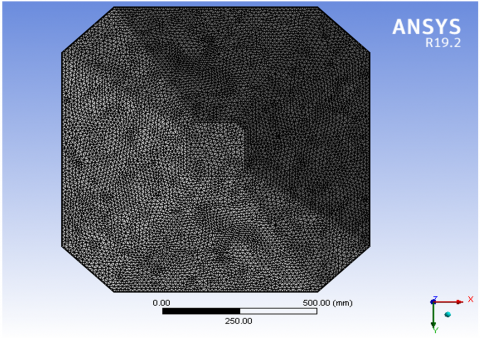
The computational domain for the solar stills was discretized into fundamental components through mesh generation. The selection of an appropriate mesh type was based on several factors, including geometry and the flow characteristics within the system. An unstructured mesh was generated with a minimum element size of 3 mm, which was determined after performing several tests with various grid sizes and types under identical boundary conditions, as shown in Table 1. Figures 14 and 15 depict the mesh for both solar still configurations. In the present study, the mesh quality was evaluated using the element quality metric. The number of nodes and elements used in the simulation is provided in Table 2. Two mesh types were considered: structured and unstructured. Structured meshes are suitable for regular geometric shapes, such as squares and rectangles. However, due to the complex and irregular shapes of the solar stills, structured meshes were deemed unsuitable. As a result, an unstructured mesh, consisting of a combination of squares and triangles, was employed to effectively cover all parts of the geometry. This approach ensures an accurate representation of the system's physical characteristics and flow behavior.
Table 1. The tested mesh number of the numerical computations
|
No. |
Element No. |
Base Temperature ℃ |
Vapour Temperature ℃ |
Best Selection |
|
1 |
150350 |
68.3 |
71.2 |
No |
|
2 |
160460 |
69.6 |
71.9 |
No |
|
3 |
170635 |
70.1 |
72.6 |
Yes |
|
4 |
175250 |
69.7 |
72.3 |
No |
|
5 |
181400 |
69.4 |
71.8 |
No |
Table 2. Number of nodes and elements in meshing
|
Type |
TSS |
IPND-SS |
|
Nodes |
39490 |
42206 |
|
Elements |
136123 |
170635 |
Figure 14. Mesh generation for TSS
Figure 15. Mesh generation for IPND-SS
3.3 Assumptions and governing equations
The following lists the main assumptions that were taken into account when modelling the hybrid still [24]:
1. Kept the level of saline water in the basin constant.
2. The insulation, glass, and absorbed materials' heat capabilities are not considered.
3. The distiller's vapour leak is disregarded.
4. Incompressible.
5. The tests are conducted under circumstances of atmospheric pressure.
6. Insulating materials' temperature fluctuations are disregarded.
In this study, the numerical simulation is conducted using ANSYS Fluent 19.2, based on the finite volume method (FVM).
Continuity equations:
$\frac{\partial \rho}{\partial \mathrm{t}}+\mathrm{u} \frac{\partial \rho}{\partial \mathrm{x}}+\mathrm{V} \frac{\partial \rho}{\partial \mathrm{y}}+\mathrm{W} \frac{\partial \rho}{\partial \mathrm{z}}=0$ (1)
Momentum conservation equations:
In x-direction momentum equation:
$\begin{gathered}\frac{\partial \rho}{\partial \mathrm{t}}+\mathrm{u} \frac{\partial \rho}{\partial \mathrm{x}}+\mathrm{V} \frac{\partial \rho}{\partial \mathrm{y}}+\mathrm{W} \frac{\partial \rho}{\partial \mathrm{z}}=\mathrm{g}_{\mathrm{x}}-\frac{1}{\rho} \frac{\partial \mathrm{p}}{\partial \mathrm{x}}+v\left(\frac{\partial^2 \mathrm{u}}{\partial \mathrm{x}^2}+\right. \left.\frac{\partial^2 \mathrm{u}}{\partial \mathrm{y}^2}+\frac{\partial^2 \mathrm{u}}{\partial \mathrm{w}^2}\right)\end{gathered}$ (2)
In y-direction momentum equation:
$\begin{gathered}\frac{\partial \rho}{\partial \mathrm{t}}+\mathrm{u} \frac{\partial \rho}{\partial \mathrm{x}}+\mathrm{V} \frac{\partial \rho}{\partial \mathrm{y}}+\mathrm{W} \frac{\partial \rho}{\partial \mathrm{z}}=\mathrm{g}_{\mathrm{x}}-\frac{1}{\rho} \frac{\partial \mathrm{p}}{\partial \mathrm{y}}+v\left(\frac{\partial^2 \mathrm{u}}{\partial \mathrm{x}^2}+\frac{\partial^2 \mathrm{u}}{\partial \mathrm{y}^2}+\right. \left.\frac{\partial^2 \mathrm{u}}{\partial \mathrm{w}^2}\right)+\mathrm{F}\end{gathered}$ (3)
$F=g\left[\left(\frac{1}{T_i+273}\right)\left(T-T_i\right)+(0.513)\left(c-c_o\right)\right]$ (4)
In z-direction momentum equation:
$\begin{gathered}\frac{\partial \mathrm{w}}{\partial \mathrm{t}}+\mathrm{u} \frac{\partial \mathrm{w}}{\partial \mathrm{x}}+\mathrm{V} \frac{\partial \mathrm{w}}{\partial \mathrm{y}}+\mathrm{w} \frac{\partial \mathrm{w}}{\partial \mathrm{z}}=\mathrm{g}_{\mathrm{z}}-\frac{1}{\rho} \frac{\partial \mathrm{p}}{\partial \mathrm{y}}+v\left(\frac{\partial^2 \mathrm{w}}{\partial \mathrm{x}^2}+\right. \left.\frac{\partial^2 \mathrm{w}}{\partial \mathrm{y}^2}+\frac{\partial^2 \mathrm{w}}{\partial \mathrm{w}^2}\right)\end{gathered}$ (5)
Energy conservation equation:
$\frac{\partial \mathrm{T}}{\partial \mathrm{t}}+\mathrm{u} \frac{\partial \mathrm{T}}{\partial \mathrm{x}}+\mathrm{V} \frac{\partial \mathrm{T}}{\partial \mathrm{y}}+\mathrm{w} \frac{\partial \mathrm{T}}{\partial \mathrm{z}}=\alpha\left(\frac{\partial^2 \mathrm{~T}}{\partial \mathrm{x}^2}+\frac{\partial^2 \mathrm{~T}}{\partial \mathrm{y}^2}+\frac{\partial^2 \mathrm{~T}}{\partial \mathrm{w}^2}\right)$ (6)
The energy balances for the various solar still components are given by the equations [24, 25].
The exterior surface of the glass lid's energy balance is:
$\frac{\mathrm{K}_{\mathrm{g}}}{\mathrm{Lg}}\left(\mathrm{T}_{\mathrm{gin}}-\mathrm{T}_{\mathrm{go}}\right)=\mathrm{h}_2\left(\mathrm{~T}_{\mathrm{go}}-\mathrm{T}_{\mathrm{a}}\right)$ (7)
The glass cover's interior surface has the following energy balance:
$\mathrm{h}_1\left(\mathrm{~T}_{\mathrm{w}}-\mathrm{T}_{\mathrm{gin}}\right)=\frac{\mathrm{K}_{\mathrm{g}}}{\mathrm{L}_{\mathrm{g}}}\left(\mathrm{T}_{\mathrm{gin}}-\mathrm{T}_{\mathrm{go}}\right)$ (8)
The water mass's energy balance is as follows:
$\mathrm{h}_3\left(\mathrm{~T}_{\mathrm{b}}-\mathrm{T}_{\mathrm{w}}\right)=\mathrm{M}_{\mathrm{w}} \mathrm{C}_{\mathrm{w}} \frac{\mathrm{dT} \mathrm{w}}{\mathrm{dt}}+\mathrm{h}_1\left(\mathrm{~T}_{\mathrm{w}}-\mathrm{T}_{\mathrm{gin}}\right)$ (9)
The basin's liner's energy balance is as follows:
$\alpha_b I(t)=h_3\left(T_b-T_w\right)+h_b\left(T_b-T_a\right)$ (10)
mewh=hew $(T w-T$ gin $) \gamma$ (11)
mewd $=\sum 24 h r^*$ mewh (12)
Solar still efficiency is:
$\eta_{\mathrm{i}}=\frac{\mathrm{h}_{\mathrm{ew}}\left(\mathrm{T}_{\mathrm{w}}-\mathrm{T}_{\mathrm{gin}}\right)}{\mathrm{I}(\mathrm{t})} \times 100 \%$ (13)
The following parameters in equations are explained in detail:
$h_1=h_{c w}+h_{e w}+h_{r w}$ (14)
$\mathrm{h}_{\mathrm{cw}}=\mathrm{C} \frac{\mathrm{k}_{\mathrm{f}}}{\mathrm{d}} \mathrm{Ra}_{\mathrm{f}} \mathrm{n}$ (15)
$\operatorname{Ra}_{\mathrm{f}}=\operatorname{Gr}_{\mathrm{f}} \operatorname{Pr}_{\mathrm{f}}, \operatorname{Gr}_{\mathrm{f}}=\frac{\mathrm{d}^3 \rho^2{ }_{\mathrm{fg}} \beta \Delta \hat{T}}{\mu^2{ }_{\mathrm{f}}}, \operatorname{Pr}_{\mathrm{f}}=\frac{\mu_{\mathrm{f}} \mathrm{C}_{\mathrm{f}}}{\mathrm{K}_{\mathrm{f}}}$ (16)
$\Delta^{\prime} \mathrm{T}=\left[\left(\mathrm{T}_{\mathrm{w}}-\mathrm{T}_{\mathrm{gin}}\right)+\frac{\left(\mathrm{P}_{\mathrm{w}}-\mathrm{P}_{\mathrm{g}}\right)\left(\mathrm{T}_{\mathrm{w}}+237.15\right)}{26800-\mathrm{P}_{\mathrm{w}}}\right]$ (17)
$P_W=e^{\left(25.317-\frac{5144}{T_W+237.15}\right)}$ (18)
$P_{g i n}=e^{\left(25.31-\frac{5144}{T_{g i n}+237.15}\right)}$ (19)
$h_{e w}=16.273 * 10^{-3}\left[h_{c w}\left(P_w-P_g\right) /\left(T_w-T_{g i n}\right)\right]$ (20)
$h_2=h_{c a}+h_{r a}=5.7+3.8 \mathrm{v}$ (21)
where,
$\mathrm{v}=2 \mathrm{~m} / \mathrm{s}$ (22)
3.4 Boundary conditions
Top surface (glass cover): Convective and radiative heat transfer to the ambient
Establishing accurate boundary conditions is a critical step in ensuring the precision of numerical simulations. The boundary conditions for this study were derived from experimental data, which included the initial temperature of the feed water, the ambient air temperature, and the incident solar radiation. Given the computational limitations and the large number of time steps required, the CFD simulation is run over an extended duration of nearly 10 hours. To optimize the computation process, the average temperature was assigned as a boundary condition for each hourly interval in subsequent simulations. The outlet boundary condition for the water was specified as a pressure-outlet condition, while the sidewalls were treated as adiabatic walls, meaning that no heat transfer occurred through these boundaries. Additionally, the impact of solar radiation on the system was included in the simulation using a solar load model. The radiation model employed for this study was the Roseland model, which used solar loading and ray tracing to accurately simulate the interaction of solar radiation with the distillation system. In this simulation, water vapor is treated as.
The secondary phase is with liquid water as the primary phase. The external temperature and pressure conditions were applied as the boundary parameters for the solar distiller. This setup allowed for a comprehensive analysis of the thermal and hydrodynamic behavior within the system, which facilitated a detailed understanding of the distillation process under varying operational conditions.
4.1 Numerical part results
4.1.1 Contour of temperature
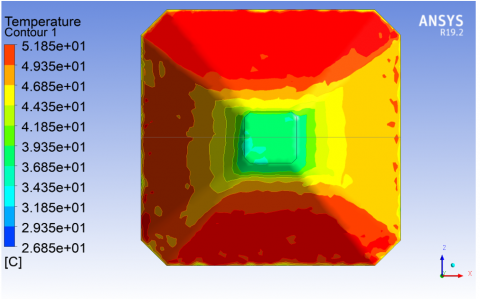
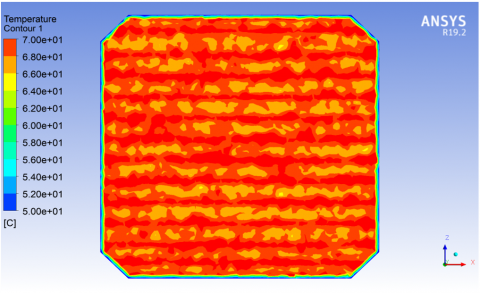
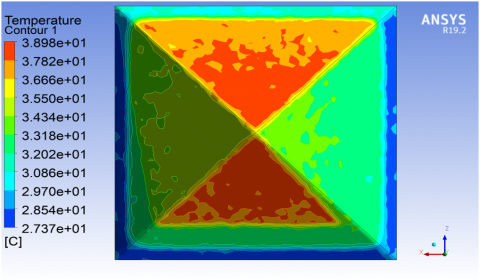
At 01:00 PM, a solar still test is conducted to determine the temperature contours for two-phase flow, as illustrated in Figures 16-18. The temperature distributions for the distillation systems equipped with the traditional pyramid-shaped still (TSS) and the inverted pyramid (IPND-SS) cover were analyzed. The results clearly demonstrate that the distiller with the updated design (IPND-SS) exhibits higher temperatures with 52℃ values compared to the conventional system (TSS) with 38℃. In addition, the water basin temperature reached 70℃; this disparity can be attributed to the reduced gap between the water surface and the inner glass cover, as well as the modification in the overall system design. which further underscores the enhanced thermal performance of the sophisticated distillation system. The superiority of the inverted pyramid (IPND-SS) design over the traditional still was confirmed through numerical simulations performed in ANSYS, which consistently indicated improved thermal efficiency and higher operational temperatures for the updated system.
Figure 16. Contour of temperature for IPND-SS at 13:00 P.M.
Figure 17. Contour of base temperature for IPND-SS at 13:00 P.M.
Figure 18. Contour of temperature for TSS at 13:00 P.M.
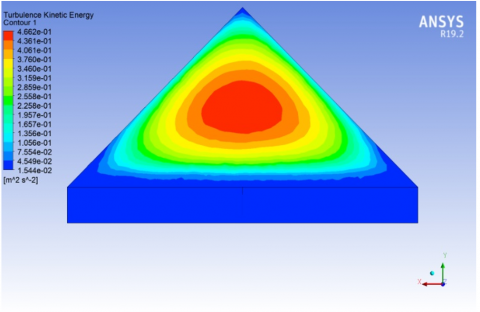
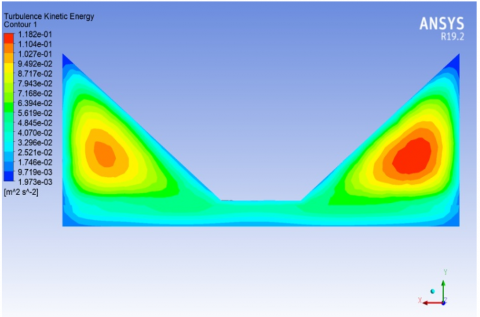
4.1.2 Turbulence Kinetic Energy
Turbulence Kinetic Energy (TKE) is important in multiphase flows, like those in refrigeration and clouds, affecting evaporation and condensation. In Computational Fluid Dynamics (CFD) simulations, TKE helps model bubble and droplet behavior at the phase interface and improves interfacial turbulence representation. Results in Figures 19 and 20 show TKE's impact on interface dynamics and phase changes. A modified design showed lower kinetic energy but higher productivity and thermal efficiency, highlighting that energy optimization depends on overall design efficiency, not just flow intensity.
Figure 19. The TKE for TSS at 13:00 P.M.
Figure 20. The TKE for IPND-SS at 13:00 P.M.
4.2 Experimental results
The solar desalination system developed in this study, featuring the inverted pyramid and M-shaped (IPND-SS) design, outperformed the traditional pyramid-shaped still in terms of both efficiency and productivity. Unlike conventional designs that rely solely on slanted glass surfaces for condensation, the proposed system incorporates both inclined and vertical glass walls. This innovative approach significantly enhanced the condensation of water vapor and increased freshwater production. The incorporation of vertical surfaces, in particular, expanded the available condensation area, thereby improving the overall system efficiency. Furthermore, the reduced distance between the condensing glass and the water surface facilitated faster condensation and minimized heat loss, contributing to the enhanced performance of the modified system. These design optimizations led to a quantifiable increase in the productivity of the system, clearly demonstrating the superior effectiveness of the modified IPND-SS design over traditional configurations.
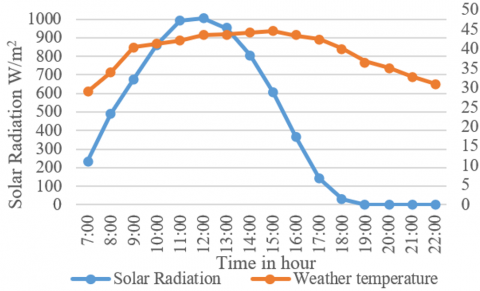
Figure 21 presents the variation of solar radiation and ambient temperatures throughout the day. The graph illustrates a typical diurnal pattern, with both the ambient temperature and solar radiation peaking around midday before gradually declining in the afternoon.
Figure 21. The ambient temperatures and solar radiation on the test day
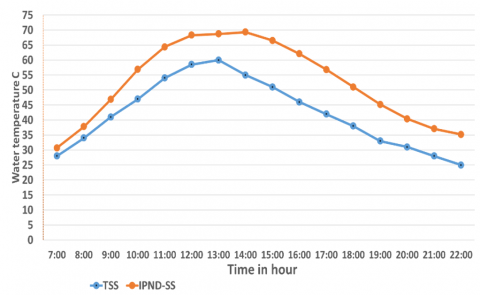
The water temperature in the basin is displayed in Figure 22. The highest water temperatures in the basin at 1:00 P.M. for the TSS & IPND-SS are 60℃ and 68℃, respectively.
Figure 22. Water temperature for TSS & IPND-SS
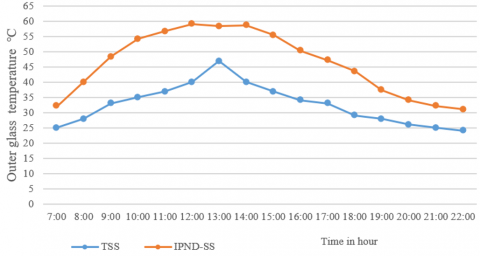
The glass temperature is displayed in Figure 23. The highest glass temperatures at 1:00 P.M. for the TSS & IPND-SS are 47℃ and 59℃, respectively.
Figure 23. Outer glass temperature for TSS & IPND-SS
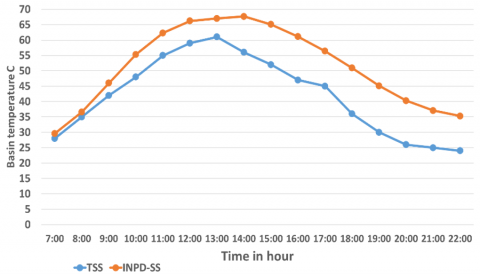
Basin temperature for TSS & IPND-SS are 62℃ and 67℃, respectively, in Figure 24.
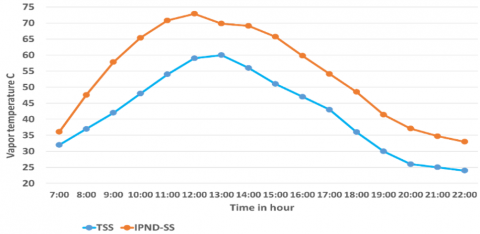
And because there is less space between the water and upper cover on the test day, the vapour temperatures are 60℃ and 73℃, respectively, for TSS & IPND-SS in Figure 25.
Figure 24. Basin Temperature for TSS & IPND-SS
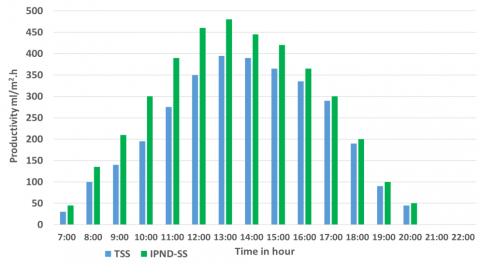
The flow of distilled water increases gradually until it reaches a peak around 13:00 P.M., as shown in Figure 26.
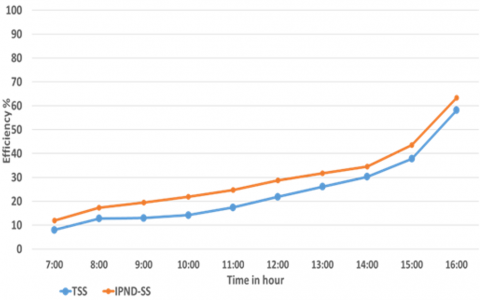
Evaporation and condensation processes are significantly influenced by the temperature differential between the water in the basin and the outer surface of the glass cover. The solar distiller with the inverted pyramid and M-shaped design (IPND-SS) demonstrated superior productivity compared to the traditional pyramid-shaped still (TSS). The new design achieved a productivity rate of 3.9 L·m⁻²·d⁻¹, which, under optimal conditions, could be higher; however, a reduction in solar radiation affected the overall output. In contrast, the traditional distiller (TSS) exhibited a productivity of 3.2 L·m⁻²·d⁻¹. Figure 27 illustrates the thermal efficiency of both the TSS and IPND-SS systems. The constructed distiller exhibited outstanding performance in terms of productivity, temperature regulation, and overall efficiency. These results provide strong evidence that the experimental findings align with the theoretical expectations, further validating the effectiveness of the modified solar still design.
Figure 25. Vapour temperature for TSS & IPND-SS
Figure 26. Hourly Productivity for TSS & IPND-SS
Figure 27. Hurly thermal efficiency for TSS & IPND-SS
4.3 Comparison with previous work
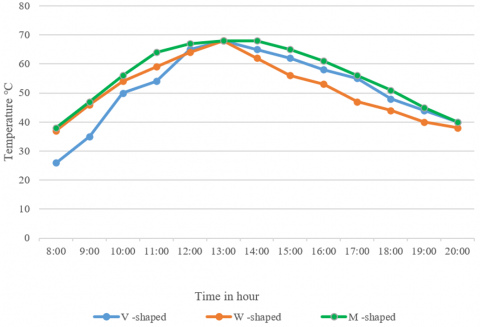
The current work was compared with the work of previous researchers [12, 20] regarding the water temperature, as shown in Figure 28, where the variation in the water temperature in the morning and at the beginning of the examination is due to the intensity of solar radiation at the first appearance of the sun.
Figure 28. Comparison of water temperature for V-shaped, W-shaped and M-shaped (IPND-SS)
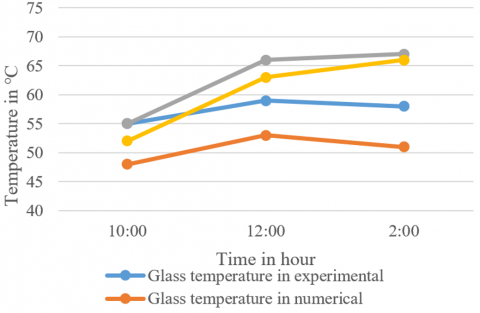
Figure 29. Comparison of base and glass temperature in numerical and experimental for IPND-SS
4.4 Comparison: Numerical and experimental work
The glass temperature in both experimental and numerical findings exhibits a comparable trend, reaching its zenith at 12:00 PM. Nevertheless, the experimental results marginally exceed the numerical ones. Conversely, the base temperature escalates more significantly, with experimental data indicating somewhat elevated values compared to the calculated results, as shown in Figure 29. Both methodologies corroborate a uniform heat pattern, hence confirming the numerical model.
Both experimental and numerical modelling approaches were employed to evaluate the performance of the traditional pyramid-shaped solar still (TSS) and the newly designed inverted pyramid with M-shaped cover (IPND-SS). A comparative analysis demonstrated a clear efficiency improvement with the new design. Upon comparison with the traditional TSS, the enhanced efficiency of the IPND-SS system is evident. The M-shaped solar still exhibited a freshwater production rate of 3.9 L/m²/day, surpassing the 3.2 L/m²/day produced by the TSS. This performance represents a 22% increase in productivity, which can be attributed to the optimized design elements of the new system, including its enhanced solar energy absorption and increased condensation surface area.
At 1:00 PM, the water temperature IPND-SS M-shaped reached 68℃, compared to 60℃ in TSS. The outer glass cover temperature was 59℃ in IPND-SS, while it was only 47℃ in TSS. Similarly, the water basin (absorber plate) temperature recorded 67℃ in IPND-SS, surpassing the 62℃ measured in TSS. The vapour temperature of IPND-SS reached 73℃, whereas the TSS recorded 60℃. These results clearly indicate enhanced thermal performance in the modified configuration.
The design of the M-shaped solar still is versatile and can be adapted for use in any geographical region by adjusting the angle of the glass cover to align with the local latitude. This adaptability makes the technology applicable in a wide range of environmental contexts, particularly in areas where freshwater access is limited. Solar stills, particularly the M-shaped design, offer a practical and environmentally friendly solution to provide drinking water in areas suffering from water scarcity. The study's findings underscore the potential of solar stills to address freshwater shortages, especially in arid or remote regions, including many developing countries. By leveraging straightforward geometric modifications, significant improvements in solar desalination efficiency are achievable. This highlights the M-shaped solar still as a sustainable and cost-effective solution for improving freshwater availability in water-stressed regions.
1. Adding internal Reflectors to boost solar radiation concentration.
2. Using efficient chemical solutions as phase change materials.
3. Select shatter-resistant materials instead of glass.
4. Highlights the need for a self-cleaning system to reduce dust.
5. Preheating water.
6. Studying the effects of different fin designs on performance.
|
TSS |
traditional solar still |
|
IPND-SS |
inverted pyramid - new design |
|
CFD |
computational fluid dynamics |
|
TKE |
turbulent kinetic energy |
|
A |
area, m2 |
|
Cp |
specific heat, J Kg-1 |
|
dt |
time interval, s |
|
h |
heat transfer coefficient, W/m2°C-1 |
|
hb |
back loss coefficient, W/m2°C-1 |
|
h1 |
total heat transfer coefficient from water to glass cover |
|
h2 |
convective heat transfer coefficient from glass to ambient |
|
mew |
productivity of distillate water, ml/m2h- |
|
mw |
fluid viscosity |
|
mewh |
productivity in one hour |
|
mewd |
productivity in one day |
|
P |
partial pressure, N/m2 |
|
T |
Temperature, ℃ |
|
Ta |
ambient temperature, ℃ |
|
Tw |
water temperature, ℃ |
|
Tgin |
The temperature of the glass inside, ℃ |
|
Tgout |
outside glass temperature, ℃ |
|
Two |
water temperatures at time zero, ℃ |
|
Cp |
specific heat capacity, J/($\operatorname{kg} c^o$) |
|
D |
cylinder diameter, m |
|
g |
gravitational constant, m/s2 |
|
h |
heat transfer coefficient, W/($\mathrm{m}^2 c^o$) |
|
Q |
input heat, W |
|
Rth |
thermal resistance, $C^o / \mathrm{W}$ |
|
Greek symbols |
|
|
$\alpha$ |
thermal diffusivity, m2/s |
|
$\beta$ |
expansion coefficient, 1/K |
|
$\mu$ |
dynamic viscosity, kg/ (m s) |
|
$v$ |
kinematic viscosity, m2/s |
|
$\rho$ |
density, kg/m3 |
|
$\varepsilon$ |
emissivity |
|
$\mathrm{\eta i}$ |
instantaneous efficiency (%) |
|
$\Delta \mathrm{T}$ |
effective temperature difference °C |
|
$\gamma$ |
latent heat of vaporization J kg-1 |
|
$\sigma$ |
Stefan - Boltzmann constant (5.6697*10–8) W m-2 °C -4 |
|
Subscripts |
|
|
a |
ambient |
|
b |
base |
|
w |
water |
|
th |
thermal |
|
gin |
inside glass |
|
gout |
outside glass |
|
$h$ |
hour |
|
$d$ |
day |
|
Dimensionless parameters |
|
|
Pr |
Prandtl Number |
|
Nu |
Nusselt number |
|
Ra |
Rayleigh number |
[1] He, W., Huang, G., Markides, C.N. (2023). Synergies and potential of hybrid solar photovoltaic-thermal desalination technologies. Desalination, 552: 116424. https://doi.org/10.1016/j.desal.2023.116424
[2] Isah, A.S., Takaijudin, H.B., Mahinder Singh, B.S., Yusof, K.W., Abimbola, T.O., Jagaba, A.H. (2024). Evaluation of distillate quality produced by using a hybrid solar desalination system. Ain Shams Engineering Journal, 15(7): 102879. https://doi.org/10.1016/j.asej.2024.102879
[3] Arunkumar, T., Velraj, R., Prado, G.O., Denkenberger, D.C., Mahian, O., Sathyamurthy, R., Vinothkumar, K., Ahsan, A. (2017). Effects of concentrator type and encapsulated phase change material on the performance of different solar stills: An experimental approach. Desalination and Water Treatment, 87: 1-13. https://doi.org/10.5004/dwt.2017.21268
[4] Reda, S.A. (2024). Numerical analysis of evaporation process in the heating column of a solar water desalination plant under various geometries, ambient conditions, solar radiations, and time steps. Results in Engineering, 23: 102775. https://doi.org/10.1016/j.rineng.2024.102775
[5] Mahdi, N.S., Eidan, A.A., Abada, H.H., Al-Fahham, M. (2023). Recent review of using nanofluid based composite PCM for various evacuated tube solar collector types. Australian Journal of Mechanical Engineering, 21(5): 1591-1603. https://doi.org/10.1080/14484846.2021.2023348
[6] Gholami, H. (2024). Technical potential of solar energy in buildings across Norway: Capacity and demand. Sol. Energy, 278: 112758. https://doi.org/10.1016/j.solener.2024.112758
[7] Ghazy, A. (2023). Numerical and experimental investigation of a hybrid solar still-solar air heater. Desalination and Water Treatment, 285: 11-19. https://doi.org/10.5004/dwt.2023.29310
[8] Mouhsin, N., Bouzaid, M., Taha-Janan, M. (2022). Experimental analysis of an improved cascade solar desalination still with modified absorber plate. E3S Web of Conferences, 336: 00023. https://doi.org/10.1051/e3sconf/202233600023
[9] Reda, S.A. (2023). Numerical analysis of vapor condensation process in a condensation dome of a patent-based solar-vacuum desalination plant. Results in Engineering, 20: 101626. https://doi.org/10.1016/j.rineng.2023.101626
[10] Bahramei, R., Samimi-Akhijahani, H., Salami, P., Khazaei, N.B. (2024). Thermo-economic evaluation of a solar desalination equipped with phase change material and spraying unit. Desalination, 574: 117197. https://doi.org/10.1016/j.desal.2023.117197
[11] Babb, P.I., Farzad Ahmadi, S., Brent, F., Gans, R. et al. (2023). Salt-rejecting continuous passive solar thermal desalination via convective flow and thin-film condensation. Cell Reports Physical Science, 4(12): 101682. https://doi.org/10.1016/j.xcrp.2023.101682
[12] Sivakumar, C.K., Robinson, Y., Joe Patrick Gnanaraj, S., Jithendra, K.B. (2024). Analysis of the performance of V-type solar stills coupled with flat plate collectors and the potential use of artificial intelligence. Desalination and Water Treatment, 318: 100365. https://doi.org/10.1016/j.dwt.2024.100365
[13] Hammoodi, K.A., Dhahad, H.A., Alawee, W.H., Omara, Z.M., Essa, F.A., Abdullah, A.S. (2023). Improving the performance of a pyramid solar still using different wick materials and reflectors in Iraq. Desalination and Water Treatment, 285: 1-10. https://doi.org/10.5004/dwt.2023.29226
[14] Sarkar, A. (2021). Study of solar distillation. https://doi.org/10.13140/RG.2.2.28632.71683
[15] Jain, P., Pandey, D.S. (2023). A review of study and analysis of a solar still distillation system with different parameter using the CATIA and ANSYS software. International Journal of Research Publication and Reviews, 4(1): 1332-1336.
[16] Shaik, F., Bhanu Teja, V.K., Subbarao, K., Dilip Kumar, B. (2024). A comprehensive review on advancements in solar still desalination. Journal of Chemical Health Risks, 14(2). https://doi.org/10.52783/jchr.v14.i2.3433
[17] Parsa, S.M., Rahbar, A., Koleini, M.H., Davoud Javadi, Y., Afrand, M., Rostami, S., Amidpour, M. (2020). First approach on nanofluid-based solar still in high altitude for water desalination and solar water disinfection (SODIS). Desalination, 491: 114592. https://doi.org/10.1016/j.desal.2020.114592
[18] Jamil, F., Hassan, F., Shoeibi, S., Khiadani, M. (2023). Application of advanced energy storage materials in direct solar desalination: A state of art review. Renewable and Sustainable Energy Reviews, 186: 113663. https://doi.org/10.1016/j.rser.2023.113663
[19] Ranjbaran, A., Norozi, M. (2019). Design and fabrication of a novel hybrid solar distillation system with the ability to brine recycling. International Journal of Heat and Technology, 37(3): 751-760. https://doi.org/10.18280/ijht.370311
[20] Shareef, A.S., Kurji, H.J., Hamzah, A.H. (2024). Modifying performance of solar still, by using slices absorber plate and new design of glass cover, experimental and numerical study. Heliyon, 10(1): e24021. https://doi.org/10.1016/j.heliyon.2024.e24021
[21] Al Shabibi, A.M., Tahat, M. (2015). Thermal performance of a single slope solar water still with enhanced solar heating system. Renewable Energy and Power Quality Journal, 13(5): 585-587. https://doi.org/10.24084/repqj13.417
[22] Mouhoumed, E.I., Abdillahi Mohamed, M.A., Ibrahim Igueh, A. (2022). Study of different parameters affecting the productivity of solar still for seawater desalination under Djiboutian climate. Energy and Power Engineering, 14(6): 201-216. https://doi.org/10.4236/epe.2022.146011
[23] Essa, M.E.S.M., El-sayed, H.S., El-kholy, E.E., Amer, M., Elsisi, M., Sajjad, U., Hamid, K., Awad, H.E. (2025). Developments in solar-driven desalination: Technologies, photovoltaic integration, and processes. Energy Conversion and Management: X, 25: 100861. https://doi.org/10.1016/j.ecmx.2024.100861
[24] Reddy, K.S., Sharon, H. (2016). Performance investigation of combined solar desalination and hot water system. In Proceedings of the ISES Solar World Congress 2015, Daegu, Korea: International Solar Energy Society, pp. 1-12. https://doi.org/10.18086/swc.2015.10.47
[25] Alwan, A.O. (2022). Investigation of the solar still performance by adding magnetic treatment unit with phase change material and solar collector. Karbala University, Iraq Babylon.