Jing Yuan![]() | Ruoyu Chen | Mingjing Yang | Jianheng Sun*
| Ruoyu Chen | Mingjing Yang | Jianheng Sun*![]()
© 2025 The authors. This article is published by IIETA and is licensed under the CC BY 4.0 license (http://creativecommons.org/licenses/by/4.0/).
OPEN ACCESS
To investigate the influence of iron tailings powder as an admixture on the development of hydration heat in mass concrete, two concrete cube specimens with a side length of 1.1 m were prepared—one incorporating iron tailings powder and the other fly ash as the admixture. Experimental and numerical simulation studies on the hydration heat of the iron tailings powder concrete (ITPC) were conducted. The results indicate that the overall temperature, the maximum temperature at the center, the peak temperature rise, and the maximum core-to-surface temperature difference of the ITPC specimen were lower than those of the fly ash concrete (FAC) specimen. Finite element numerical simulations revealed that when the specimen size was increased from 1.5 m to 3.0 m, the peak temperature rise, the cooling rate at the middle layer, and the maximum core-to-surface temperature difference of the ITPC specimen were lower than those of the FAC specimen. In particular, the maximum core-to-surface temperature difference was reduced by 6.9% compared to that of the FAC specimen. As the size of the concrete structure increased, the comprehensive cooling effect of iron tailings powder became more advantageous compared to fly ash. The use of iron tailings powder as a substitute for fly ash not only reduced the hydration heat of mass concrete but also lowered costs and mitigated the adverse environmental impacts of tailings. For C40-grade ITPC with a 30% admixture content and a water-to-binder ratio of 0.42, when the specimen size exceeded 1.78 m, the peak temperature rise at the center and the core-to-surface temperature difference reached the specified control limits of 50℃ and 25℃, respectively. Under these conditions, cooling measures should be implemented in practical engineering applications to reduce the peak temperature rise and core-to-surface temperature difference, thereby minimizing the risk of cracking.
ITPC, hydration heat, characteristic temperature, numerical simulation, cross-sectional size
China, being the world's largest steel producer, has concomitantly accumulated vast quantities of iron tailings. To date, the accumulated volume of iron tailings in China is estimated to be approximately 20 billion tons, yet the comprehensive utilization rate remains merely 30.13%. The extensive stockpiling of tailings not only occupies significant land resources but also poses risks of soil and water contamination due to heavy metal leaching [1, 2]. Consequently, the utilization of iron tailings in building materials is considered a promising strategy not only to enhance the efficient consumption of tailings but also to promote the green and sustainable development of concrete. Han et al. [3] examined the effects of iron tailings powder and fly ash as admixtures on concrete strength and durability, reporting that iron tailings powder can improve early-age strength, albeit at the expense of reduced long-term strength, while also enhancing carbonation and frost resistance. Some studies [4, 5] have indicated that iron tailings powder contributes to increased concrete strength, with a more pronounced effect observed at lower water-to-binder ratios; they have also explored the properties of concrete incorporating blended iron tailings powder and slag powder. Some studies [6-8] have examined the cementitious activity of iron tailings powder and its application in bricks and concrete. Researches [9-11] has demonstrated that iron tailings concrete exhibits satisfactory workability. Yang et al. [12] investigated the pozzolanic activity of iron tailings powder as a concrete admixture, finding that the optimal activity was achieved at a specific surface area of 450–550 m²·kg⁻¹, with a recommended maximum replacement level not exceeding 30%. Chen et al. [13] experimentally studied the relationship between the fractal characteristics and dynamic compressive properties of ultra-high performance concrete (UHPC) prepared with varying replacement ratios of iron tailings powder substituting for silica fume. The results revealed that a 50% replacement rate of iron tailings powder yielded a quasi-static compressive strength of 131.9 MPa for UHPC. Collectively, these studies confirm the viability of utilizing iron tailings powder as a concrete admixture. However, research concerning its specific impact on the hydration heat of mass concrete remains notably scarce.
Mass concrete structures are widely employed in marine engineering, bridge engineering, and hydraulic engineering [14-17]. Consequently, significant attention has been directed toward the associated issue of hydration heat in mass concrete [18-21]. Hydration heat is recognized as a primary factor leading to cracking in mass concrete, with such cracks posing serious threats to structural integrity. Therefore, temperature control and crack prevention are considered critically important for mass concrete structures. A common practice involves the incorporation of fly ash into concrete to mitigate hydration heat, thereby reducing the risk of cracking [22-24]. However, the price of fly ash has been rising due to its increasingly limited availability, necessitating the identification of alternative admixtures. Investigating the influence of iron tailings powder on the hydration heat in mass concrete could facilitate its broader application in this context.
In this study, iron tailings powder and fly ash sourced from Tangshan, China, were utilized as concrete admixtures. Two mass concrete cube specimens, each with a side length of 1100 mm, were fabricated. The development of hydration heat in these specimens was experimentally investigated. Furthermore, the temperature fields of the ITPC and FAC specimens were numerically analyzed using the ANSYS finite element software. The objective was to examine the effect of iron tailings powder on the hydration heat of mass concrete. The numerical results were compared with experimental data to provide a theoretical basis and practical reference for the temperature control design and construction of mass ITPC in engineering applications.
2.1 Materials
The hydration heat test for mass concrete was conducted using Jinglan P·O 42.5 cement with a specific surface area of 349.6 m²/kg. Iron tailings powder, obtained from Qian'an, Tangshan City, was employed; after grinding, its specific surface area was measured to be 466 m²/kg with an activity index of 74.65%. In accordance with the Chinese standard GB/T 2847-2005 [25], the iron tailings powder was determined to possess no pozzolanic activity. Grade II fly ash was utilized, exhibiting a specific surface area of 418 m²/kg. The chemical compositions of these materials are presented in Table 1. Natural river sand, with a fineness modulus of 2.70, was selected as the fine aggregate. Crushed stone, with a continuous gradation ranging from 5 to 25 mm, was used as the coarse aggregate. A polycarboxylate-based high-performance water-reducing admixture, providing a water reduction rate of 30%, was incorporated. Tap water was used for both mixing and curing purposes. Both concrete mixtures were designed for a target strength grade of C40. To facilitate a comparison of the heat of hydration between the two specimen types, an identical water-to-binder ratio and cement content were maintained. The admixtures—iron tailings powder and fly ash—were incorporated at a fixed replacement level of 30% by mass of cement. The dosages of the water-reducing admixture were 0.2% and 0.45% for ITPC and FAC, respectively. The detailed mix proportions are provided in Table 2.
Table 1. Chemical composition
|
Material |
Mass Fraction (%) |
|||||
|
CaO |
SiO2 |
Al2O3 |
Fe2O3 |
MgO |
Others |
|
|
P·O 42.5 |
60.12 |
20.72 |
7.75 |
3.19 |
2.99 |
2.6 |
|
Iron tailings powder |
4.8 |
68.2 |
5.1 |
12.5 |
6.8 |
2.6 |
|
Fly ash |
14.6 |
34.5 |
26.4 |
5.7 |
2.7 |
16.1 |
Table 2. Concrete mix proportions
|
Material |
Amount (Kg·m⁻³) |
|||||||
|
Water-to-Binder Ratio |
Water |
Cement |
Iron Tailings Powder |
Fly Ash |
River Sand |
Crushed Stone |
Water Reducer |
|
|
ITPC |
0.42 |
170 |
283.3 |
121.4 |
- |
821.4 |
1003.9 |
0.994 |
|
FAC |
0.42 |
170 |
283.3 |
- |
121.4 |
821.4 |
1003.9 |
1.87 |
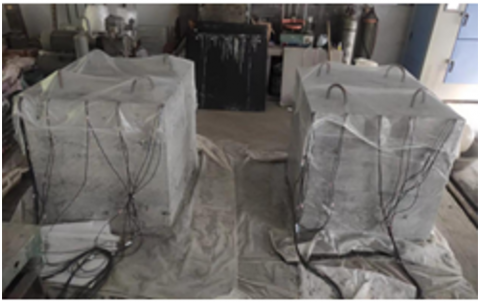
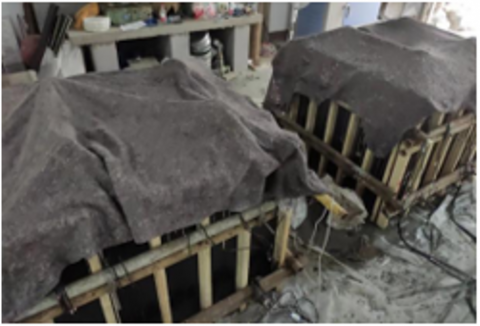
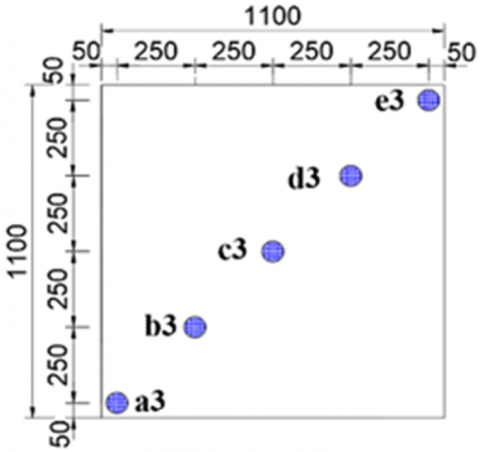
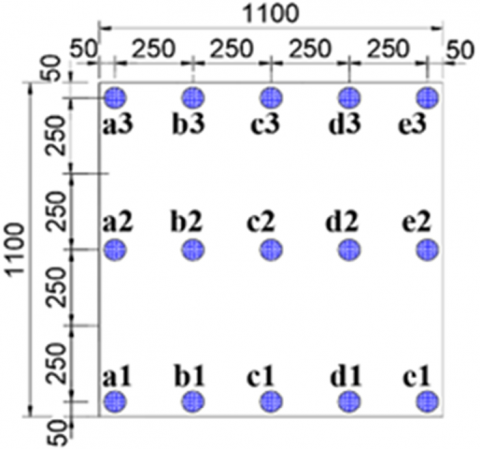
Two concrete cube specimens, one incorporating ITPC and the other containing FAC, each with a side length of 1100 mm, were cast. The external surfaces of both specimens were enclosed with wooden formwork having a thickness of 0.12 cm. Photographs of the actual specimens are shown in Figure 1. Each specimen was instrumented with a total of 15 temperature measurement points. These points were distributed across three layers—bottom, middle, and top—with five points arranged diagonally within each layer (designated as a1 through e3). The detailed layout of the temperature measurement points is illustrated in Figure 2. Temperature data acquisition was performed using an HD-HNTC mass concrete temperature tester. 18B20 digital temperature sensors were employed for temperature measurement. Data were recorded at 30-minute intervals over a continuous monitoring period of 1440 hours.
Figure 1. Mass concrete specimens
Figure 2. Layout of temperature measurement points
3.1 Initial and boundary conditions
The initial temperature of the concrete specimen and the underlying base concrete was set as the recorded temperature of mixture placing to mold and the measured temperature of the base concrete, respectively. The surface of the concrete specimen was exposed to air, and type III boundary condition [26] was applied. This condition is expressed by the following equation:
$q=-\lambda \frac{\partial T}{\partial \mathrm{n}}=\beta\left(T-T_a\right)$ (1)
where, λ is the thermal conductivity of concrete (kJ/(m·h·℃)), and β is the surface heat transfer coefficient (kJ/(m²·h·℃)) of solid. A modified value of 37.73 kJ/(m²·h·℃) was adopted for β due to the presence of a thin film or insulating material on the concrete surface during the experiment. In addition, T and Ta represent the concrete surface temperature and the ambient temperature (℃), respectively; and n denotes the outward normal direction to the concrete surface.
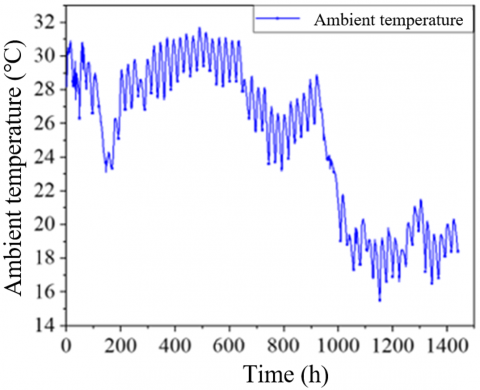
The thermophysical properties of the concrete mixtures are presented in Table 3. The ambient temperature profile used in the simulation was the measured values over the 1440-hour period, as shown in Figure 3.
Table 3. Thermophysical properties of the model materials
|
Parameter Type |
Specific Heat Capacity [kJ/(kg·℃)] |
Thermal Conductivity [kJ/(m·h·℃)] |
Density (kg/m³) |
||||||
|
Specimen type |
ITPC |
FAC |
Foundation |
ITPC |
FAC |
Foundation |
ITPC |
FAC |
Foundation |
|
Parameter value |
0.938 |
0.957 |
0.97 |
9.122 |
8.880 |
10.2 |
2400 |
2400 |
2450 |
Figure 3. Ambient temperature
3.2 Finite element model development
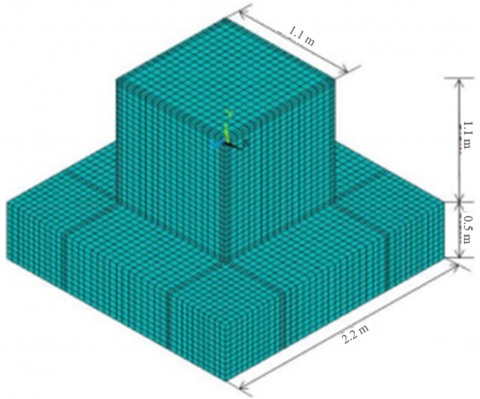
A numerical model consistent with the experimental specimen dimensions was developed using the ANSYS APDL finite element software. The foundation thickness was set to 0.5 m. The SOLID70 thermal element was selected for the heat transfer analysis. The finalized model consisted of 29,075 nodes and 25,600 elements. The geometric configuration and mesh discretization of the model are illustrated in Figure 4. The heat generation rate of the concrete was applied to the concrete model elements as a volumetric load to simulate the hydration heat production.
Figure 4. Mass concrete model
3.3 Calculation of concrete hydration heat
The heat release from cement hydration is primarily calculated using the following three formula types [27].
(a) Exponential formula
$Q(t)=Q_0\left(1-e^{-m t}\right)$ (2)
where, t is the concrete age (d); Q(t) is the cumulative heat of hydration (kJ/kg) at time t; Q0 is the ultimate heat of hydration (kJ/kg) as t approaches infinity; and m is the constant related to the cement type and temperature of mixture placing to mold.
(b) Hyperbolic formula
$Q(t)=\frac{Q_0 \mathrm{t}}{\mathrm{n}+t}$ (3)
where, n is a constant. At t=0, Q(t)=0; at t=∞, Q(t)=Q0; and at t=n, Q(t)=Q0/2.
(c) Compound exponential formula
$Q(t)=Q_0\left(1-e^{-a t^t}\right)$ (4)
The values for Q0 and the parameters m, n, a, and b in the above formulae can be found in the study [28].
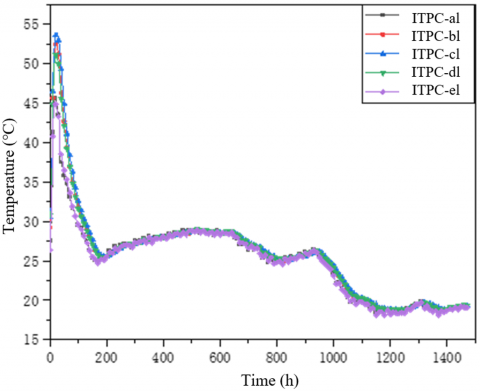
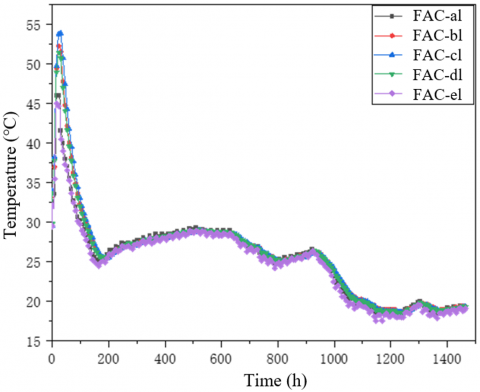
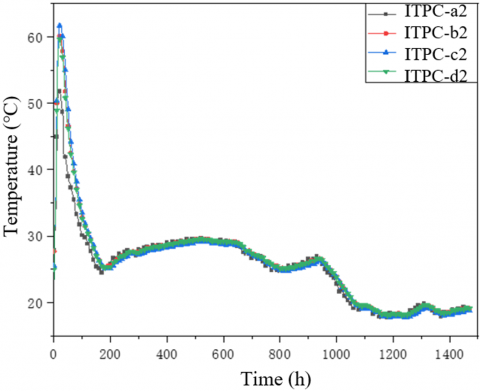
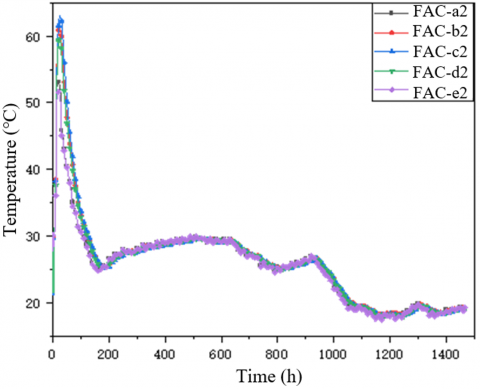
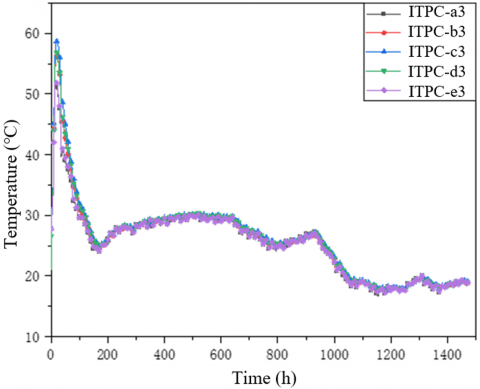
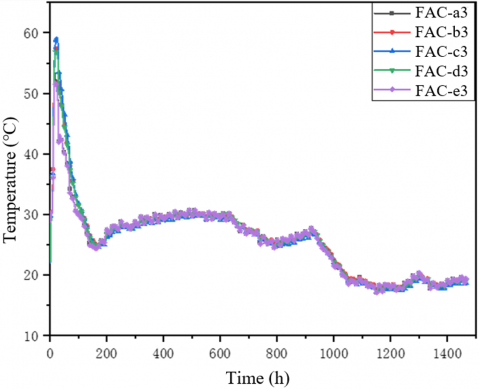
4.1 Temperature curves of measurement points
The temperatures at the 15 internal measurement points within the mass ITPC and FAC specimens were monitored continuously for 1440 hours. The temperature-time curves for the measurement points across different layers of the ITPC and FAC specimens are presented in Figure 5. It should be noted that the temperature sensor at point e2 in the ITPC specimen was damaged during the casting process, resulting in a lack of temperature data for this location. The hydration heat release process for both the mass ITPC and FAC concrete specimens was observed to consist of three distinct stages:
The heating stage: During this initial phase, the cement hydration reaction was vigorous, releasing a substantial amount of heat.
The cooling stage: This subsequent phase was characterized by a gradual deceleration of the hydration heat release until it eventually stabilized. The temperature discontinuity observed in the cooling stage for the surface measurement points is attributed to the removal of the wooden formwork.
The relative stabilization stage: In the final phase, the internal temperature of the specimens stabilized. The temperature at the measurement points then fluctuated in response to changes in the ambient temperature, exhibiting a certain degree of thermal lag.
As shown in Figure 5, the temperature field of the mass concrete exhibited excellent symmetry. The time-temperature curves of symmetric measurement points (a-e and b-d) demonstrated good agreement. Furthermore, on any given horizontal plane, the temperature was observed to decrease gradually from the center towards the periphery. For instance, at 24 hours after casting, the temperatures at points a2, b2, and c2 on the middle layer were recorded as 50.8℃, 59.8℃, and 61.8℃, respectively, for the ITPC specimen (c2 > b2 > a2). Corresponding temperatures for the FAC specimen at the same points and time were 52.3℃, 61.3℃, and 63.0℃, respectively (c2 > b2 > a2). This thermal gradient is attributed to the primary heat dissipation mechanism in mass concrete, which occurs through convective heat transfer at the surface to the surrounding air. Consequently, points located farther from the surface experience reduced cooling efficiency, resulting in higher temperatures, higher peak temperatures, and a delayed occurrence of the temperature peak. In contrast, points on the top and side surfaces, due to their proximity to the external environment, are significantly influenced by ambient conditions. Once their temperature exceeds the ambient temperature, heat is transferred to the surroundings, leading to a reduction in the magnitude of the temperature rise.
(a) Bottom layer - ITPC specimen
(b) Bottom layer - FAC specimen
(c) Middle layer - ITPC specimen
(d) Middle layer - FAC specimen
(e) Top layer - ITPC specimen
(f) Top layer - FAC specimen
Figure 5. Temperature-time curves for measurement points across different layers of the ITPC and FAC specimens
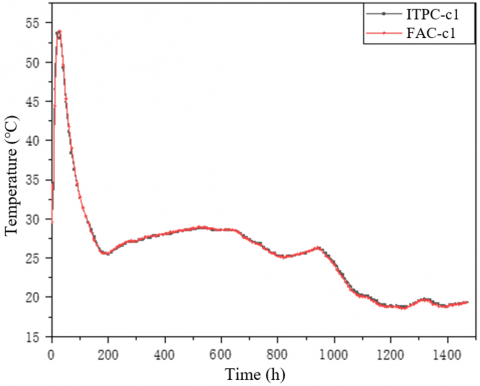
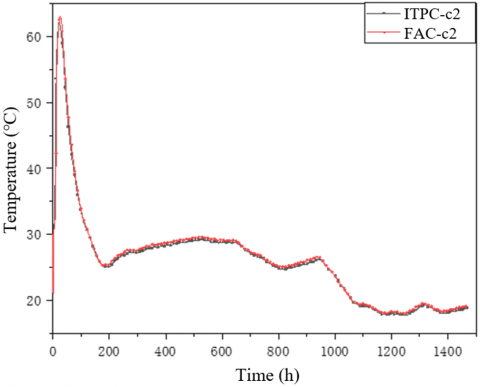
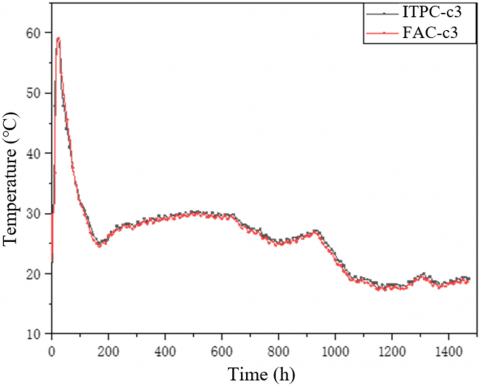
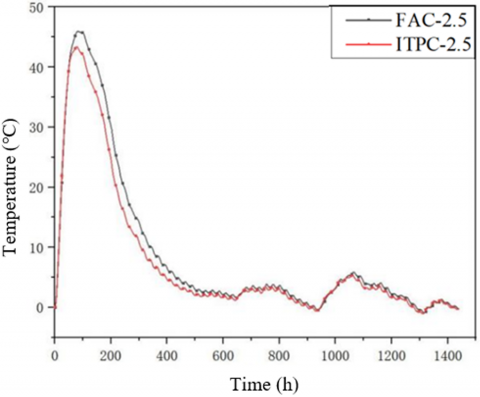
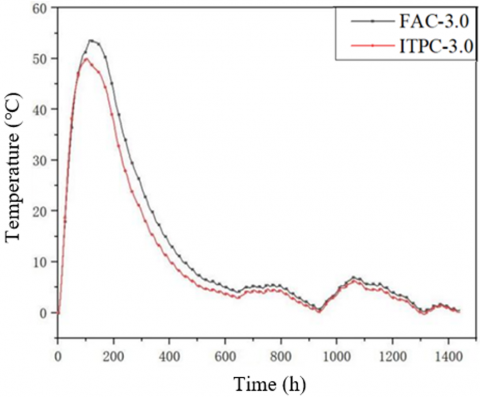
To compare the development and evolution of hydration heat between the ITPC and FAC specimens, the temperature curves for points c1, c2, and c3 for both materials are contrasted in Figure 6. Figure 6 indicates that the ITPC and FAC specimens exhibited similar trends in their temperature curves. The heating stage persisted for approximately 21 hours and 24 hours for the ITPC and FAC specimens, respectively. The maximum temperatures at the center point reached 61.9℃ and 63.0℃ for the ITPC and FAC specimens, respectively. The subsequent cooling stage lasted for 154 hours and 146 hours for the ITPC and FAC specimens, respectively, before entering the relative stabilization stage. These observations indicate that ITPC and FAC undergo fundamentally similar processes of heat generation and dissipation during hydration.
(a) Measurement point c1
(b) Measurement point c2
(c) Measurement point c3
Figure 6. Temperature-time curves at measurement points c1, c2, and c3 for the ITPC and FAC specimens
4.4 Analysis of characteristic values at measurement points
Table 4 presents a comparison of the maximum temperature, duration of the heating stage, and heating rate for the 15 measurement points. The heating rate was calculated as the maximum temperature minus the ambient temperature at casting, divided by the duration of the heating stage. As indicated in Table 4, the peak temperature rise in the mass ITPC specimen occurred earlier than in the mass FAC specimen during the heating stage. The heating rate of the ITPC specimen was also observed to be higher than that of the FAC specimen. This phenomenon is attributed to two primary factors. Firstly, the incorporation of iron tailings powder exerts a dispersing effect on cement particles, thereby increasing the contact area between cement and water. This enhanced contact facilitates a more thorough reaction, promoting early-age cement hydration. Secondly, iron tailings powder is an inert admixture devoid of pozzolanic activity; it does not participate in the hydration reaction. Consequently, it does not consume water, resulting in an increased amount of water available for cement hydration. This improves the hydration environment and accelerates the process, leading to an earlier occurrence of the peak temperature.
With the exception of a few points where localized lower temperatures were recorded, likely due to inherent heterogeneity in the hydration reaction within the mass concrete, the overall temperature of the FAC specimen was higher than that of the ITPC specimen. The maximum temperatures at the center point were recorded as 63.0℃ and 61.9℃ for the FAC and ITPC specimens, respectively, indicating a 1.1℃ reduction in the peak temperature rise for the ITPC specimen. The maximum core-to-surface temperature differences were 18.5℃ and 20.4℃ for the ITPC and FAC specimens, respectively. The maximum surface-to-ambient temperature differences were 30.2℃ and 30.8℃, respectively. As detailed in the earlier mix design, an identical water-to-binder ratio was employed, with equivalent contents of cement, admixture, sand, and coarse aggregate in both the ITPC and FAC specimens. Therefore, the difference in the magnitude of temperature rise between the two mass concrete mixtures is solely attributable to the type of admixture used. In contrast to iron tailings powder, fly ash possesses pozzolanic properties. Under conditions of equal replacement level and age, fly ash undergoes a slow secondary hydration reaction, releasing a small amount of additional heat and consequently elevating the temperature of the concrete specimen. From the perspectives of maximum temperature and maximum temperature difference, iron tailings powder demonstrates a slightly superior performance to fly ash in mitigating the hydration heat effect in mass concrete.
Table 4. Characteristic indicators at measurement points
|
Location |
Point |
Maximum Temperature (℃) |
Heating Duration (h) |
Heating Rate (℃·h-1) |
|||
|
ITPC |
FAC |
ITPC |
FAC |
ITPC |
FAC |
||
|
Bottom layer |
a1 |
45.9 |
46.3 |
14.5 |
16.5 |
1.42 |
1.25 |
|
b1 |
52.6 |
52.4 |
21.0 |
24.0 |
1.30 |
1.11 |
|
|
c1 |
54.0 |
54.1 |
23.5 |
24.5 |
1.22 |
1.16 |
|
|
d1 |
51.3 |
51.5 |
21.0 |
22.5 |
1.24 |
1.15 |
|
|
e1 |
45.0 |
45.0 |
17.0 |
15.0 |
1.16 |
1.33 |
|
|
Middle layer |
a2 |
52.0 |
53.5 |
16.5 |
17.5 |
1.62 |
1.59 |
|
b2 |
60.2 |
61.4 |
21.0 |
22.5 |
1.66 |
1.59 |
|
|
c2 |
61.9 |
63.0 |
21.0 |
24.0 |
1.74 |
1.55 |
|
|
d2 |
59.6 |
59.8 |
21.0 |
22.5 |
1.63 |
1.52 |
|
|
e2 |
- |
52.0 |
- |
16.5 |
- |
1.59 |
|
|
Top layer |
a3 |
51.5 |
53.3 |
16.0 |
17.0 |
1.69 |
1.67 |
|
b3 |
56.3 |
57.5 |
18.0 |
20.5 |
1.72 |
1.55 |
|
|
c3 |
58.7 |
59.2 |
20.0 |
22.5 |
1.67 |
1.49 |
|
|
d3 |
56.8 |
56.9 |
18.5 |
20.5 |
1.71 |
1.52 |
|
|
e3 |
52.3 |
52.0 |
15.5 |
16.0 |
1.74 |
1.64 |
|
5.1 Temperature field distribution and characteristic temperature comparison
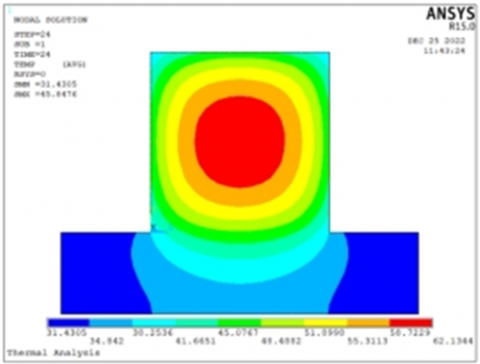
A vertical cross-section through the center of the mass concrete specimen, located 0.55 m from the boundary, was defined. The peak temperature rise contour plot on this cross-section, calculated based on the compound exponential hydration heat model, is presented in Figure 7. As shown in the figure, the maximum internal temperature was consistently located in the geometric center region of the concrete, which is the point farthest from all boundaries. This distribution is attributed to the primary heat dissipation mechanism, where heat generated internally is lost primarily through the concrete surfaces exposed to air. Due to the substantial thickness of the mass concrete section and its consequently relatively small surface-area-to-volume ratio, the heat released during cement hydration accumulates in the central interior region and is not easily dissipated. This results in a temperature field characterized by the highest temperatures at the center, decreasing towards the periphery.
(a) ITPC specimen
(b) FAC specimen
Figure 7. Temperature contour plots at the time of peak temperature rise
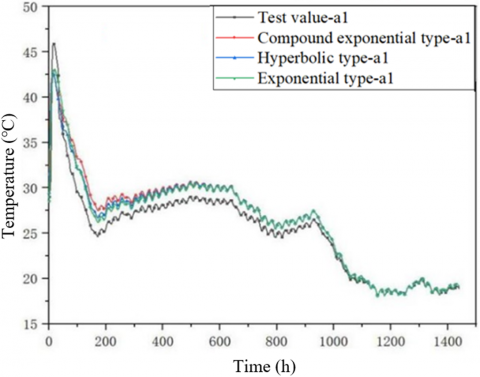
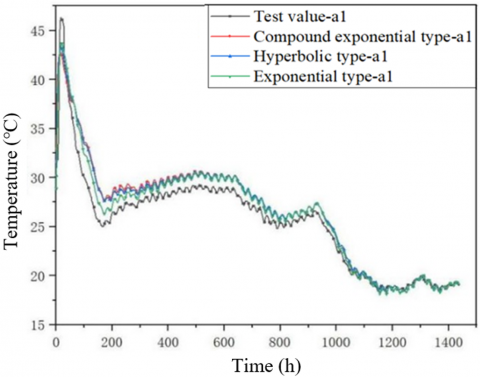
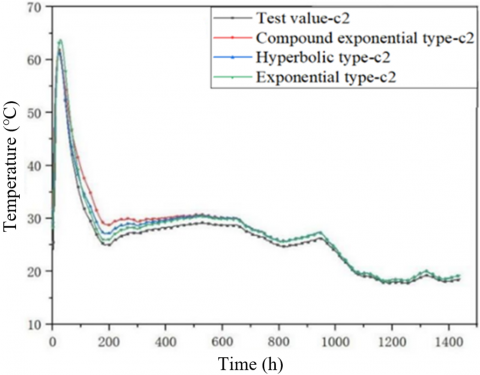
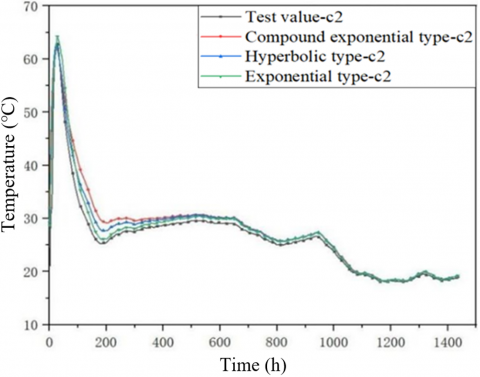
A comparative analysis was conducted between the numerical simulation results—generated using the exponential, hyperbolic, and compound exponential hydration heat models—and the measured experimental data for both the ITPC and FAC specimens. The characteristic temperature indicators for selected points are summarized in Table 5. A comparison of the temperature-time history curves for points a1 and c2 is provided in Figure 8.
(a) ITPC - measurement point a1
(b) FAC - measurement point a1
(c) ITPC - measurement point c2
(d) FAC - measurement point c2
Figure 8. Temperature-time curves from simulation and experimental results
As evidenced by the data in Table 5 and Figure 8, the numerically simulated peak temperatures for the ITPC specimen were consistently slightly lower than those for the FAC specimen. Furthermore, the occurrence of the temperature peak was predicted to be earlier for the ITPC specimen, which is in agreement with the experimental observations. A strong agreement was observed between the measured and simulated values at the center point, c2. For the ITPC specimen, the peak temperatures calculated using the exponential, hyperbolic, and compound exponential models were 63.8℃, 61.2℃, and 61.5℃, with relative errors of 3.07%, 1.13%, and 0.65%, respectively. The simulated time of peak occurrence was delayed by 5 hours, 2 hours, and 0 hours compared to the experimental data, respectively. For the FAC specimen, the peak temperatures simulated by the same three models were 0.4℃, 1.4℃, and 0.6℃ higher than those for the ITPC specimen, with corresponding relative errors of 1.90%, 0.63%, and 1.43% against experimental measurements. The time of peak occurrence was delayed by 3 hours, 0 hours, and 0 hours, respectively. Among the models, the compound exponential hydration heat formula yielded the most accurate results for the ITPC specimen, demonstrating a relative error of 0.65% in peak temperature and no delay in predicting the time of peak occurrence.
Table 5. Comparison of characteristic indicators of various measurement points across models
|
Point |
Model Type |
Peak Temp. (℃) |
Time of Peak (h) |
Relative Error in Peak Temp. (%) |
Difference in Time of Peak (h) |
||||
|
ITPC |
FAC |
ITPC |
FAC |
ITPC |
FAC |
ITPC |
FAC |
||
|
a1 |
Exponential |
43.1 |
43.7 |
20 |
20 |
6.10 |
5.62 |
+5.5 |
+3.5 |
|
Hyperbolic |
42.4 |
43.3 |
16 |
18 |
7.63 |
6.48 |
+1.5 |
+1.5 |
|
|
Compound exponential |
42.5 |
42.8 |
16 |
16 |
7.41 |
8.64 |
+1.5 |
-0.5 |
|
|
b1 |
Exponential |
50.5 |
51.5 |
25 |
26 |
3.99 |
1.72 |
+4 |
+2 |
|
Hyperbolic |
49.0 |
50.8 |
19 |
23 |
6.84 |
3.05 |
-2 |
-1 |
|
|
Compound exponential |
49.1 |
49.5 |
22 |
23 |
6.65 |
5.53 |
+1 |
-1 |
|
|
c1 |
Exponential |
54.7 |
55.5 |
28 |
29 |
1.30 |
2.59 |
+4.5 |
+4.5 |
|
Hyperbolic |
52.3 |
54.7 |
23 |
26 |
3.15 |
1.11 |
-0.5 |
+1.5 |
|
|
Compound exponential |
52.6 |
53.0 |
23 |
26 |
2.59 |
2.03 |
-0.5 |
+1.5 |
|
|
a2 |
Exponential |
49.8 |
50.7 |
17 |
22 |
5.96 |
5.23 |
+0.5 |
+4.5 |
|
Hyperbolic |
48.8 |
49.4 |
18 |
16 |
6.15 |
7.66 |
+1.5 |
+1.5 |
|
|
Compound exponential |
48.9 |
51.1 |
17 |
18 |
5.96 |
4.49 |
-0.5 |
+0.5 |
|
|
b2 |
Exponential |
58.5 |
60.0 |
25 |
26 |
2.82 |
2.28 |
+4 |
+3.5 |
|
Hyperbolic |
56.5 |
57.7 |
20 |
22 |
6.15 |
6.03 |
-1 |
-0.5 |
|
|
Compound exponential |
56.8 |
57.8 |
20 |
21 |
5.65 |
5.86 |
-1 |
-1.5 |
|
|
c2 |
Exponential |
63.8 |
64.2 |
26 |
27 |
3.07 |
1.90 |
+5 |
+3.0 |
|
Hyperbolic |
61.2 |
62.6 |
23 |
24 |
1.13 |
0.63 |
+2 |
0 |
|
|
Compound exponential |
61.5 |
62.1 |
21 |
24 |
0.65 |
1.43 |
0 |
0 |
|
|
a3 |
Exponential |
49.1 |
50.4 |
20 |
21 |
4.66 |
5.44 |
+4 |
+4.0 |
|
Hyperbolic |
48.1 |
49.9 |
16 |
17 |
6.60 |
6.38 |
0 |
0 |
|
|
Compound exponential |
48.2 |
49.9 |
15 |
17 |
6.41 |
6.38 |
-1 |
0 |
|
|
b3 |
Exponential |
54.1 |
55.3 |
23 |
23 |
3.91 |
3.83 |
+5 |
+2.5 |
|
Hyperbolic |
52.7 |
54.0 |
19 |
19 |
6.40 |
6.09 |
+1 |
-1.5 |
|
|
Compound exponential |
52.8 |
54.8 |
18 |
20 |
6.22 |
4.07 |
0 |
-0.5 |
|
|
c3 |
Exponential |
58.1 |
60.0 |
25 |
26 |
1.02 |
1.35 |
+5 |
+3.5 |
|
Hyperbolic |
56.1 |
57.5 |
21 |
21 |
4.43 |
2.87 |
+1 |
-1.5 |
|
|
Compound exponential |
56.4 |
56.8 |
20 |
22 |
3.92 |
4.05 |
0 |
-0.5 |
|
Note a: Relative error is calculated as |(Measured - Simulated)| / Measured × 100%. b: A positive value (+) indicates a delayed peak occurrence; a negative value (-) indicates an early peak occurrence.
Larger relative errors were identified between the measured and simulated peak temperatures at the bottom and top layers. The maximum relative error was observed at the bottom corner point, a1. For the ITPC specimen, the maximum relative errors for the exponential, hyperbolic, and compound exponential models were 6.10%, 7.63%, and 7.41%, respectively. The corresponding maximum errors for the FAC specimen were 5.62%, 6.48%, and 8.64%. These elevated discrepancies are primarily attributed to the simplification of the actual boundary conditions to a Type III boundary condition in the numerical model. In reality, the boundary conditions are more complex, and this simplification introduced a deviation between the simulated and actual conditions, consequently affecting the accuracy of the simulated heat transfer process.
6.1 Specimen size scenarios
Finite element modeling and analysis of the ITPC and FAC specimens were conducted using the compound exponential hydration heat formula. Four cubic specimen sizes were considered for both material types: 1.5 m × 1.5 m × 1.5 m, 2.0 m × 2.0 m × 2.0 m, 2.5 m × 2.5 m × 2.5 m, and 3.0 m × 3.0 m × 3.0 m. These are subsequently referred to as the 1.5 m, 2.0 m, 2.5 m, and 3.0 m specimen sizes.
6.2 Analysis of numerical simulation results
The numerical results for the bottom corner point (e1), the middle layer center point (c2), and the top corner point (a3) on each specimen were selected for analysis. The resulting temperature rise and temperature control indicators for the various specimen sizes are presented in Tables 6, 7, and 8, as well as in Figures 9 and 10.
Table 6. Temperature rise indicators at characteristic points for the ITPC specimen
|
Specimen Size |
Peak Temperature (℃) |
Heating Duration (h) |
Heating Rate (℃/h) |
||||||
|
e1 |
c2 |
a3 |
e1 |
c2 |
a3 |
e1 |
c2 |
a3 |
|
|
1.5 m |
43.9 |
70.1 |
49.3 |
18 |
32 |
17 |
1.033 |
1.400 |
1.412 |
|
2.0 m |
46.0 |
79.1 |
51.4 |
20 |
46 |
18 |
1.035 |
1.170 |
1.444 |
|
2.5 m |
48.7 |
86.6 |
52.7 |
21 |
63 |
19 |
1.114 |
0.973 |
1.447 |
|
3.0 m |
51.3 |
92.9 |
55.7 |
22 |
80 |
21 |
1.182 |
0.845 |
1.448 |
Table 7. Temperature rise indicators at characteristic points for the FAC specimen
|
Specimen Size |
Peak Temperature (℃) |
Heating Duration (h) |
Heating Rate (℃/h) |
||||||
|
e1 |
c2 |
a3 |
e1 |
c2 |
a3 |
e1 |
c2 |
a3 |
|
|
1.5 m |
45.1 |
72.8 |
51.4 |
18 |
35 |
18 |
1.100 |
1.357 |
1.450 |
|
2.0 m |
46.9 |
82.1 |
52.7 |
19 |
51 |
18 |
1.137 |
1.114 |
1.522 |
|
2.5 m |
49.6 |
89.8 |
54.3 |
20 |
69 |
19 |
1.215 |
0.935 |
1.526 |
|
3.0 m |
52.8 |
96.3 |
56.9 |
22 |
88 |
20 |
1.250 |
0.807 |
1.580 |
Table 8. Peak temperature rise and temperature control indicators at characteristic points
|
Specimen Size |
Peak Temp. Rise (℃) |
Internal Cooling Rate (℃/d) |
Maximum Core-to-surface temp. Difference (℃) |
|||||||
|
e1 |
c2 |
a3 |
||||||||
|
ITPC |
FAC |
ITPC |
FAC |
ITPC |
FAC |
ITPC |
FAC |
ITPC |
FAC |
|
|
1.5 m |
18.6 |
19.8 |
44.8 |
47.5 |
24.0 |
25.3 |
5.84 |
5.85 |
25.1 |
26.6 |
|
2.0 m |
20.7 |
21.6 |
53.8 |
56.8 |
26.1 |
27.4 |
4.01 |
4.22 |
35 |
36.9 |
|
2.5 m |
23.4 |
24.3 |
61.3 |
64.5 |
27.5 |
29 |
3.71 |
3.79 |
43.3 |
45.9 |
|
3.0 m |
26.0 |
27.5 |
67.6 |
70.9 |
30.4 |
31.6 |
3.53 |
3.59 |
49.9 |
53.6 |
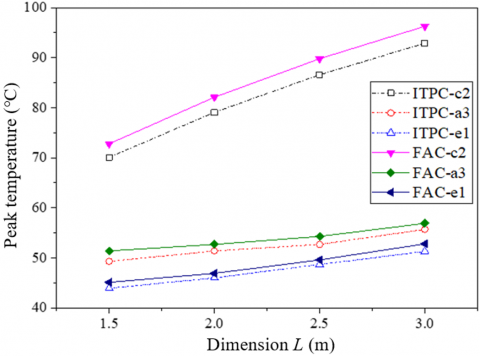
Figure 9. Peak temperature at characteristic points for different specimen sizes
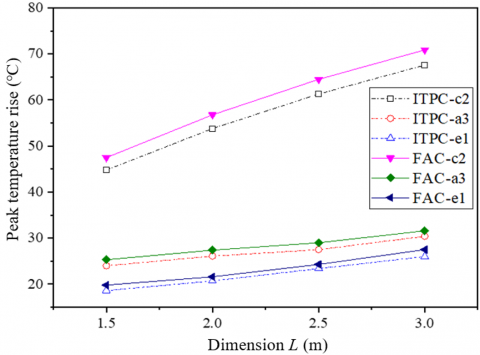
Figure 10. Peak temperature rise at characteristic points for different specimen sizes
As can be observed from Tables 6-8 and Figures 9-10, the peak temperature, peak temperature rise, heating duration, and maximum core-to-surface temperature difference at the three characteristic points of both the mass ITPC and FAC specimens were found to increase with increasing specimen size. In contrast, the heating rate at point c2 and the internal cooling rate on the middle layer were observed to decrease as the specimen size increased. The specific variations in these temperature rise and control indicators, as the specimen size was increased from 1.5 m to 3.0 m, are detailed below.
According to the data presented in Tables 6 and 7, the peak temperature at the center point (c2) was increased by 22.8℃ and 23.5℃ for the ITPC and FAC specimens, respectively, representing increases of 32.5% and 32.3%. These increases were significantly higher than those observed at points a3 and e1. The smallest increase in peak temperature was recorded at the bottom corner point (a3), with the ITPC and FAC specimens showing increases of 6.4℃ and 5.5℃, equivalent to percentage increases of 13.0% and 10.7%, respectively. Figures 9 and 10 demonstrate that the curves for the ITPC specimen consistently lie below those of the FAC specimen. This indicates that, for an equivalent specimen size, both the peak temperature and the peak temperature rise of the ITPC specimen are lower than those of the FAC specimen. Specifically, at points c2, a3, and e1, the peak temperatures of the ITPC specimen were measured to be 2.7℃–3.4℃, 1.2℃–2.1℃, and 0.9℃–1.5℃ lower, respectively, than those of the FAC specimen.
At the center point (c2), the time to reach peak temperature rise was increased by 48 hours and 53 hours for the ITPC and FAC specimens, respectively. This increase was significantly greater than the corresponding increases observed at points a3 and e1, which did not exceed 4 hours. For specimens of identical size, the heating duration of the ITPC specimen was consistently shorter than that of the FAC specimen, with a difference ranging from 3 to 8 hours. The heating rate was reduced by 0.56℃/h and 0.55℃/h for the ITPC and FAC specimens, respectively. However, for a given specimen size, the heating rate of the ITPC specimen remained higher than that of the FAC specimen, with a maximum observed difference of 0.056℃/h. As indicated in Table 8, for a specimen size of 2.0 m, the peak temperature rise at the center point was 53.8℃ and 56.8℃ for the ITPC and FAC specimens, respectively. The value for the ITPC specimen was 3.0℃ lower than that of the FAC specimen. Both values exceeded the limit specified in the code [29], which states that the temperature rise should not exceed 50℃ above the temperature of mixture placing to mold. Based on the inverse calculation using the relational model for the Specimen size vs. peak temp. rise at c2, the corresponding specimen sizes for which the peak temperature rise reaches 50℃ were determined to be 1.78 m and 1.64 m for the ITPC and FAC specimens, respectively. In practical engineering applications, when the placement thickness of ITPC exceeds 1.78 m, temperature control measures must be promptly implemented. This critical thickness for ITPC is 0.14 m greater than that for FAC. The internal maximum temperature rise can be mitigated by reducing the temperature of concrete mixture placing to mold.
As indicated in Table 8, the internal cooling rate was reduced by 2.31℃/d and 2.26℃/d for the ITPC and FAC specimens, respectively. For specimens of identical size, the cooling rate of the ITPC specimen was lower than that of the FAC specimen, with a maximum observed difference of 4.98%. The cooling rate of the ITPC specimen was found to exceed the temperature control limit of 2℃/d specified in the code [29], indicating a relatively high risk of cracking in the structure. Therefore, for practical engineering applications, it is recommended that measures such as embedding cooling pipes within the concrete or increasing the thickness of the insulation layer on the concrete surface be implemented to effectively reduce the cooling rate and mitigate the risk of cracking.
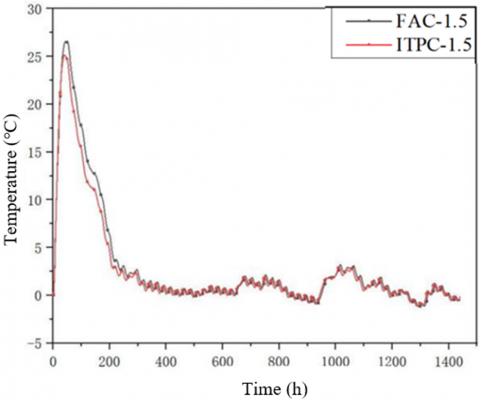
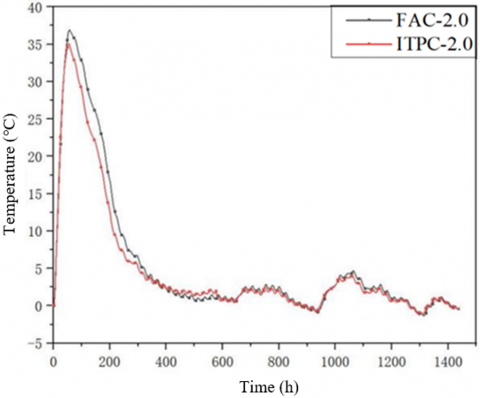
According to the data presented in Table 8 and Figure 11, the maximum core-to-surface temperature difference was increased by 24.8℃ and 27.0℃ for the ITPC and FAC specimens, respectively, representing percentage increases of 98.80% and 101.50%. The core-to-surface temperature difference for all specimens exceeded the specified control limit of 25℃ [29]. For a given cross-sectional size, the core-to-surface temperature difference of the ITPC specimen was consistently lower than that of the FAC specimen, with the difference between the two ranging from 1.5℃ to 3.7℃. Since the core-to-surface temperature difference is a primary factor leading to cracking in mass concrete, it is concluded that the risk of surface cracking in FAC structures is higher than that in ITPC structures in actual mass concrete engineering projects.
(a) 1.5 m dimension
(b) 2.0 m dimension
(c) 2.5 m dimension
(d) 3.0 m dimension
Figure 11. Core-to-surface temperature difference versus time for different specimen dimensions
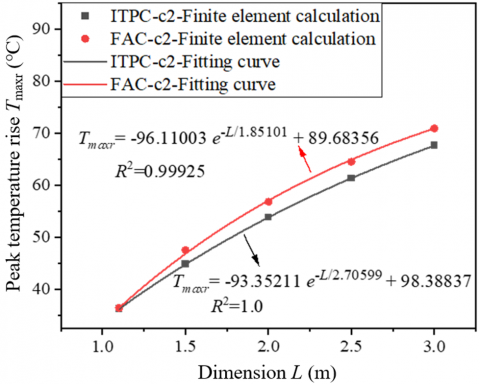
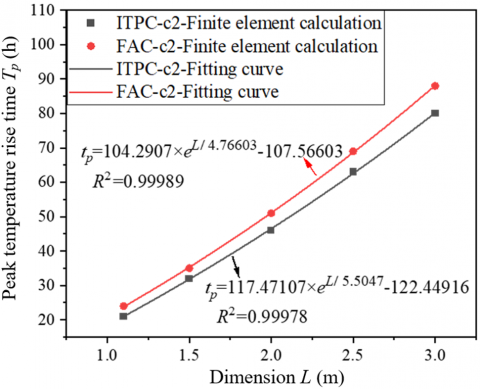
6.3 Relationship models between specimen size and temperature indicators
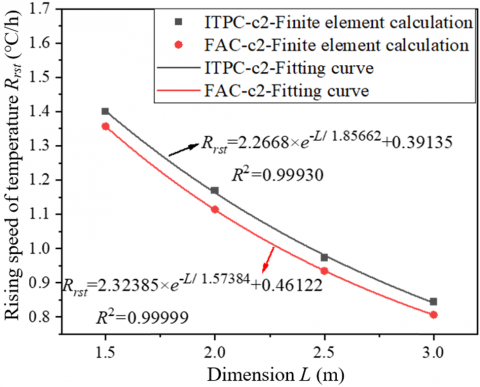
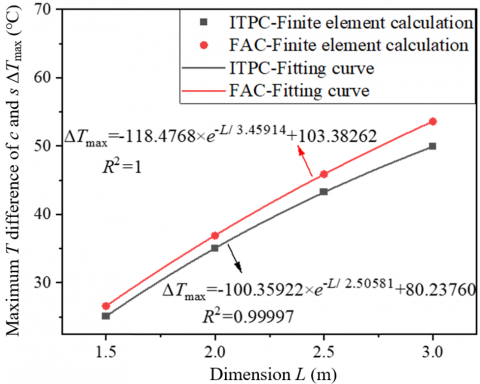
The size L of the mass ITPC and FAC specimens (L being the side length of the cube, in meters) was defined as the abscissa. The peak temperature rise Tmaxr (℃), the time to peak temperature rise tp (h), the heating rate Rrst (℃/h), and the maximum core-to-surface temperature difference ΔTmax (℃) at characteristic point c2 were respectively defined as the ordinates. Relationship models between the specimen size and the aforementioned temperature rise and control indicators were fitted for both ITPC and FAC specimens. The results are presented in Figure 12. As shown in Figure 12, a distinct exponential relationship was observed between the specimen size and each temperature indicator as the size of the mass ITPC and FAC specimens varied within the range of 1.1 m to 3.0 m.
The coefficient of determination (R²) for each fitted curve was found to range between 0.99925 and 1.0. This indicates that the finite element calculation results exhibit an exceptionally high degree of agreement with the fitted models, demonstrating that these models can be reliably applied to guide the construction practice of mass ITPC in actual engineering projects.
(a) Specimen size vs. peak temp. rise at c2
(b) Specimen size vs. time to peak at c2
(c) Specimen size vs. heating rate at c2
(d) Specimen size vs. max core-surface ΔT
Figure 12. Relationship model curves between specimen size and characteristic indicators
The experimental and numerical analysis yielded several key conclusions regarding the thermal properties and performance of ITPC compared to FAC:
(a) The peak temperature rise in the mass ITPC specimen was observed to occur earlier than in the mass FAC specimen. The heating rate of the ITPC specimen was also slightly higher. However, the overall temperature, the maximum temperature at the center point, the peak temperature rise, and the maximum core-to-surface temperature difference of the ITPC specimen were all lower than the corresponding values for the FAC specimen. Consequently, iron tailings powder demonstrates a slightly superior performance to fly ash in mitigating the hydration heat effect in mass concrete.
(b) Among the three hydration heat calculation formulas investigated—exponential, hyperbolic, and compound exponential—the compound exponential formula provided the highest simulation accuracy for the ITPC concrete specimen.
(c) Finite element numerical simulations revealed that as the specimen size increased from 1.5 m to 3.0 m, the peak temperature, heating duration, and maximum core-to-surface temperature difference of the ITPC specimen also increased. For specimens of identical size, the peak temperature rise, the middle-layer cooling rate, and the maximum core-to-surface temperature difference of the ITPC specimen were lower than those of the FAC specimen. Notably, the maximum core-to-surface temperature difference was reduced by 6.9% compared to that of the FAC specimen. The comprehensive cooling effect of iron tailings powder becomes increasingly advantageous over fly ash as the size of the concrete structure increases. The utilization of iron tailings powder as a substitute for fly ash not only reduces the hydration heat of mass concrete but also lowers costs and mitigates the adverse environmental impacts associated with tailings disposal.
(d) For a mix design with a 30% replacement rate and a water-to-binder ratio of 0.42, the peak temperature rise at the center of the C40-grade ITPC specimen exceeded the code-specified control limit of 50℃, and the core-to-surface temperature difference exceeded the limit of 25℃ when the specimen size exceeded 1.78 m. Under these conditions, it is imperative that cooling measures be implemented in practical engineering applications to reduce the peak temperature rise and the core-to-surface temperature difference, thereby minimizing the risk of cracking.
This work was supported by the Hebei Provincial Key Research and Development Program (No. 19211502D), and the 2024 Graduate Student Internship Subsidy Program for Universities in Hebei Province (No. 45).
[1] Han, X., Wang, F., Zhao, Y., Meng, J., Tian, G., Wang, L., Liang, J. (2023). Recycling of iron ore tailings into magnetic nanoparticles and nanoporous materials for the remediation of water, air and soil: A review. Environmental Chemistry Letters, 21(2): 1005-1028. https://doi.org/10.1007/s10311-022-01541-7
[2] Fei, L, Zou, W., Zhou, M., Wang, Y., Li, Q. (2025). Current status of tailings resource utilization and research progress on ecological utilization. Energy Environmental Protection, 39(4): 48-60.
[3] Han, F., Zhang, H., Liu, J., Song, S. (2022). Influence of iron tailing powder on properties of concrete with fly ash. Powder Technology, 398: 117132. https://doi.org/10.1016/j.powtec.2022.117132
[4] Wu, R., Zhang, Y., Zhang, G., An, S. (2022). Enhancement effect and mechanism of iron tailings powder on concrete strength. Journal of Building Engineering, 57: 104954. https://doi.org/10.1016/j.jobe.2022.104954
[5] Wu, R., Shen, Y., Liu, J., Cheng, L., Zhang, G., Zhang, Y. (2021). Effect of iron tailings and slag powders on workability and mechanical properties of concrete. Frontiers in Materials, 8: 723119. https://doi.org/10.3389/fmats.2021.723119
[6] Zhang, N., Tang, B., Liu, X. (2021). Cementitious activity of iron ore tailing and its utilization in cementitious materials, bricks and concrete. Construction and Building Materials, 288: 123022. https://doi.org/10.1016/j.conbuildmat.2021.123022
[7] Ma, B.G., Cai, L.X., Li, X.G., Jian, S.W. (2016). Utilization of iron tailings as substitute in autoclaved aerated concrete: physico-mechanical and microstructure of hydration products. Journal of Cleaner Production, 127: 162-171. https://doi.org/10.1016/j.jclepro.2016.03.172
[8] Vilela, A.P., Eugênio, T.M.C., de Oliveira, F.F., Mendes, J.F., Ribeiro, A.G.C., Brandão, L.E.V.D.S., Mendes, R.F. (2020). Technological properties of soil-cement bricks produced with iron ore mining waste. Construction and Building Materials, 262: 120883. https://doi.org/10.1016/j.conbuildmat.2020.120883
[9] Zhao, J., Ni, K., Su, Y., Shi, Y. (2021). An evaluation of iron ore tailings characteristics and iron ore tailings concrete properties. Construction and Building Materials, 286: 122968. https://doi.org/10.1016/j.conbuildmat.2021.122968
[10] Li, C., Zhang, S., Liu, P., Lin, S., Li, H.N., Tian, Y., Chen, W. (2024). Effect of tailing powder content on dynamic behavior of iron tailing porous concrete: an experimental study. Case Studies in Construction Materials, 21: e03635. https://doi.org/10.1016/j.cscm.2024.e03635
[11] Li, C., Zhang, S., Liu, P., Li, H., et al. (2024). Influence of key design variables on dynamic material properties of iron tailing porous concrete under impact loading. Developments in the Built Environment, 18: 100401. https://doi.org/10.1016/j.dibe.2024.100401
[12] Yang, M., Sun, J., Dun, C., Duan, Y., Meng, Z. (2020). Cementitious activity optimization studies of iron tailings powder as a concrete admixture. Construction and Building Materials, 265: 120760. https://doi.org/10.1016/j.conbuildmat.2020.120760
[13] Chen, M., Yu, H., Zhang, T., Gao, P. (2025). Elucidating the role of siliceous iron tailing powder on dynamic compressive properties and fractal characteristics of ultra-high performance concrete. Powder Technology, 464: 121221. https://doi.org/10.1016/j.powtec.2025.121221
[14] Pang, C., Mao, Y., Zhang, C., Song, X. (2024). Effect and mechanism of phase change lightweight aggregate on temperature control and crack resistance in high-strength mass concrete. Journal of Building Engineering, 97: 110498. https://doi.org/10.1016/j.jobe.2024.110498
[15] Zheng, X., Hu, Y., Wang, Y., Chen, X., Chen, X. (2025). Heat of hydration, durability and cracking resistance of mass marine engineering concrete designed with low-heat Portland cement. Concrete, (6): 219-223. https://doi.org/10.3969/j.issn.1002-3550.2025.06.039
[16] Geng, M., Lin, E., Lü, J., Fu, B. (2021). Hydration heat analysis and temperature control of mass concrete pile cap. Concrete, (9): 50-55. https://doi.org/10.3969/j.issn.1002-3550.2021.09.010
[17] Huang, Y., Liu, G., Huang, S., Rao, R., Hu, C. (2018). Experimental and finite element investigations on the temperature field of a massive bridge pier caused by the hydration heat of concrete. Construction and Building Materials, 192: 240-252. https://doi.org/10.1016/j.conbuildmat.2018.10.128
[18] Zhang, Z., Sun, F., Chen, B. (2020). Thermo–mechanical coupled analysis for tunnel lining with circular openings. Tunnelling and Underground Space Technology, 102: 103409. https://doi.org/10.1016/j.tust.2020.103409
[19] Wang, Y.S., Mo, L.H., Xie, S.X., Wang, C.Y., Yu, X.B., Zhou, H. (2023). Early-age cracking in mass concrete: Modeling and case study of an extra-large exhibition pool. Journal of Building Engineering, 80: 108118. https://doi.org/10.1016/j.jobe.2023.108118
[20] Zhu, J., Wang, Z. (2024). Experimental modeling and quantitative evaluation of mitigating cracks in early-age mass concrete by regulating heat transfer. Journal of Building Engineering, 96: 110641. https://doi.org/10.1016/j.jobe.2024.110641
[21] Xu, W., Qiang, S., Hu, Z., Ding, B., Yang, B. (2020). Effect of hydration heat inhibitor on thermal stress of hydraulic structures with different thicknesses. Advances in Civil Engineering, 2020(1): 5029865. https://doi.org/10.1155/2020/5029865
[22] Galan, I., Lontschar, K., Perez, G., Mittermayr, F. (2025). Optimizing VO2 integration in cements for the development of thermochromic building materials. Case Studies in Construction Materials, 22: e04678. https://doi.org/10.1016/j.cscm.2025.e04678
[23] de Matos, P.R., Junckes, R., Graeff, E., Prudencio Jr, L.R. (2020). Effectiveness of fly ash in reducing the hydration heat release of mass concrete. Journal of Building Engineering, 28: 101063. https://doi.org/10.1016/j.jobe.2019.101063
[24] Schindler, A.K., Keith, K.P. (2014). Behavior of high-volume fly ash concrete in mass concrete applications. In Construction Materials and Structures, pp. 268-275. https://doi.org/10.3233/978-1-61499-466-4-268
[25] GB/T 2847-2005. (2006). General administration of quality supervision, inspection and quarantine of the People's Republic of China. Pozzolanic materials used for cement production. Beijing: Standards Press of China.
[26] Wang, Q., Chen, C., Hu, Z., Li, Y, Wu, J. (2020). Engineering measurement and numerical simulation of hydration heat temperature field of mass concrete for beam bearing platform. Concrete, (9): 139-143, 147. https://doi.org/10.3969/j.issn.1002-3550.2020.09.033
[27] Li, R., Pai, L., Wu, H., Liu, J., Li, K., Cao P. (2021). Research and simulation of hydration heat of special-shaped mass concrete. Science Technology and Engineering, 21(24): 10452-10460
[28] Chen. R. (2023). Experimental study and numerical simulation of hydration heat of large volume iron tailings powder concrete, M.A. thesis, Hebei Agricultural University.
[29] GB 50496-2018. (2018). Ministry of housing and urban-rural development of the People's Republic of China. Standard for construction of mass concrete. Beijing: China Architecture & Building Press.