Ismail Ibrahim Marhoon*![]() | Samir Ali Amin
| Samir Ali Amin![]() | Ahmed Hashim Kareem
| Ahmed Hashim Kareem![]() | Abdulghafor Mohammed Hashim
| Abdulghafor Mohammed Hashim![]() | Hasan Shakir Majdi
| Hasan Shakir Majdi![]() | Laith Jaafer Habeeb
| Laith Jaafer Habeeb![]()
© 2025 The authors. This article is published by IIETA and is licensed under the CC BY 4.0 license (http://creativecommons.org/licenses/by/4.0/).
OPEN ACCESS
This study aimed to experimentally and numerically discuss the effect of the interpass temperature on the stainless steel multipass shielded metal arc welding (SMAW) joints and HAZ microstructure and mechanical properties of 316L stainless steel. In this investigation, E308 electrode metal employed in welding three weldments: first without any interpass temperature, the second with 100℃ interpass temperature, and the third with 150℃ interpass temperature. Microstructures and hardness of weldments investigated using optical microscopy, scanning electron microscopy (SEM), energy dispersive spectroscopy (EDS), X-ray diffraction analysis (XRD), and Vickers microhardness (HV). Ferrite scope was also used in non-destructive evaluation to observe ferrite content in weldments. SOLDWOKS and ANSYS software’s used in designed and analyses three welding joints models, to investigated the interpass temperature effects on heat effected zone (HAZ) width, deformation, and stress of the all joints. Results indicated that fusion zone microstructure exhibited dendritic structure containing lathy and skeletal δ-ferrite in γ matrix. XRD, SEM, and Eds results proved that δ-ferrite amount inversely proportional to the interpass temperature. δ-ferrite contents in welding zone increased by increasing cooling rate. The HAZ microstructure illustrated coarse grain size in this zone due to the effects of interpass temperature in decreasing the cooling rate. Therefore, the hardness decreased as the interpass temperature increased due to the lack of δ-ferrite formation in the structure. The stacking fault energy (SFE) calculations show that all three joints had (SFE) values of more than (9 MJ/m2); therefore, no Martensite will form in the welding joint with any interpass temperature. The numerical results illustrated direct proportional between the interpass temperature and the HAZ width.
interpass temperature, lathy and skeletal δ-ferrite, HAZ, stacking fault energy (SFE), welding dilution
In recent years, numerous finite element models [1] have been developed to forecast temperature distributions, deformation, and residual stresses in multi-pass butt-welded steel. Hamdey et al. [2] present detailed findings from testing and numerical assessment on how thin and thick steel alloy plates behave during V-joint welding, when with or without the use of a backing plate. The study found out that using a backing plate on a joint reduced deformation by more than one-sixth compared to what happened without a backing plate using the ANSYS and Solidworks models. Mohammed et al. [3] used ANSYS simulation software to look at how copper backing plates influence welding distortion, heat distribution and residual stresses on stainless steel. It shows that welding on a copper backing plate cuts down on welding distortion through heat absorption and eliminates much of the unwanted stress left over. The research points out that ANSYS is a key tool for examining the temporary thermal and mechanical changes in the welded joints. In Deng and Murakawa [4] paper, a numerical analysis is carried out using ANSYS for Stainless Steel SUS304 plumbing pipes with multiple weld passes. The authors set up models in 3D and axisymmetric form to predict thermal cycles and analyze the resulting stresses. We were able to confirm the temperature gradients and stress fields from our 3D model by comparing them with the results from our experiments. By contrast, the 2D axisymmetric model provided less information but allowed for a huge decrease in the time needed to calculate results with good accuracy. Manai [5] studied the distribution of residual stresses following welding and cutting processes was analyzed using ANSYS simulations. The research found that residual stresses in welded structures exhibit significant variations based on the welding method and cutting techniques. ANSYS finite element analysis was employed to simulate the temperature distribution and mechanical behavior during the processes, providing a detailed insight into stress evolution. The results emphasized that controlling thermal cycles and cutting methods could reduce detrimental residual stresses, improving the structural integrity of welded components. Mochizuki et al. [6] employed intrinsic strain and thermal elastic-plastic analyses to forecast residual stress in carbon steel tubing. They validated their numerical models employing neutron diffraction measurement. Perić et al. [7] used a two-dimensional axisymmetric finite element (FE) model to replicate the process of three-pass pipe girth welding with a wall thickness of 19 mm. Sattari-Far and Javadi [8] study, explored the influence of welding sequence on welding distortions in pipes, using ANSYS for finite element simulations. Their results showed that the welding sequence significantly affects the distribution of thermal strains and distortions, with certain sequences leading to reduced distortion and better alignment. The ANSYS simulations provided a detailed analysis of the thermal cycle and its relationship with the resulting stresses and distortions in the welded pipe. Alkhafaji et al. [9] studied how electrode types influence the welding of copper to 304 stainless steels by checking heat spread, structure and strength of the welded pieces. ANSYS software was used to model how heating occurred during welding which led the authors to discover that the HAZ and thermal changes varied significantly depending on which electrode was employed. The investigation revealed that the type of electrode being used impacts the formation of microstructure, affecting important mechanical properties such as tensile strength and hardness. The results stress that picking suitable electrodes can improve the welding process of copper-stainless steel joints. Jiang and Yahiaoui [10] recently employed a three-dimensional finite element (FE) model to forecast temperature distributions in a multi-pass welded pipe branch junction. Nevertheless, their investigation did not include the examination of welding residual stresses.
Power generation, chemical and petrochemical engineering, biomedical and dairy industries, and automotive engineering are just a few of many industrial sectors that can benefit from this technology [11]. AISI 304L st.st widely used in industry because of its exceptional toughness in low temperature conditions and good corrosion resistance among the 300 series austenitic stainless steel grade. The annual usage of the 304 and 304L austenitic stainless steels is projected above 20,000 tons [12]. Welding is highly used method for constructing stainless steel buildings. Welding techniques have been employed in several applications, including pipelines, vehicle exhaust gas systems, and repairs of chemical industrial equipment [13, 14]. Nevertheless, welding frequently impacts the microstructure significantly, substantially impacting the welded samples' mechanical and corrosion properties. The main issues that might arise during fusion welding processes are microsegregation, secondary phase precipitation, porosity creation, cracking, and material loss from vaporization [15, 16]. Microstructure of austenitic stainless steel predominantly composed of austenite during equilibrium solidification. Nevertheless, elevated cooling rate will lead to an incomplete δ transformation in non-equilibrium rapid solidification conditions, such as welding. Consequently, small quantities of δ-ferrite will unavoidably persist in weld microstructure at room temperature. δ-ferrite, when retained, can inhibit solidification and hot cracking and enhance flexibility, toughness, and corrosion resistance. However, reports indicate that excessive δ-ferrite (often above 10% by volume) can hurt hot workability [17]. Hence, regulating the d-ferrite level in the weldments is crucial when welding austenitic stainless steels.
The primary characteristic that distinguishes stainless steel and justifies its presence and extensive utilization is its exceptional corrosion resistance. The ability of stainless steel to resist corrosion is determined by the chemical composition, structure, and uniformity of its passive film [18]. The welding procedures will likely significantly impact passivity due to temperature cycle and compositional change during welding. Extensive research has been conducted on the corrosion of stainless steel weldments. Intergranular corrosion resulting from sensitization is a prevalent issue observed in weldments made of stainless steel. This effect is widely recognized and is attributed to the formation of carbides and other intermetallic phases at the borders between grains when the material is heated within the sensitization temperature range, typically between 600 and 850 degrees Celsius. Fusion welding methods can induce localized alterations in the composition of welded material, leading to changes in stability of passive layer and its corrosion characteristics [19]. Shielded metal arc welding (SMAW) is considered most dependable technique in stainless steels welding due to its notable benefits, such as its availability, ability to weld complex shapes of varying sizes, and the wide range of materials it can work with. Additionally, this technology is low cost, effective and economical alternative in metals joining due to it utilization of low priced equipment [20]. However, limited evidence is available regarding the impact of interpass temperature effects in multipass welding on the microstructure of stainless steel SMAW joints. This experiment examines microstructure and mechanical properties characteristics of multipass 316L stainless steel weldment employing E308 electrode metal. Furthermore, examination of microstructural elements is also conducted.
This work investigates the microstructural and mechanical property characterization of multipass welds in 316L austenitic stainless steel joints, with variations in interpass temperature. The research focuses on determining the effects of interpass temperatures on parameters such as microstructure, particularly ferrite content, and mechanical qualities including hardness and deformation. The current study examines the experimental and computational analysis of the impact of several interpass temperatures specifically, no interpass, 100℃, and 150℃ on the microstructure and characteristics of multi-pass welded joints. To ascertain the impact of these temperatures on the development of δ-ferrite, hardness, and mechanical stresses in both the weldment and the heat-affected zone (HAZ). This study will be conducted exclusively to compare the efficacy of finite element modeling (FEM) with ANSYS in forecasting temperature distribution, stress, and deformation patterns during the welding process. Consequently, prior research enhanced finite element models to forecast temperature distribution, deformation, and stresses in multipass welding. Additional research employed an axisymmetric model to mimic a multi-pass welding procedure in stainless steel pipes, as demonstrated in the study by Perić et al. [7] employed a finite element model to simulate girth welding processes, demonstrated residual stress formation at the welded connection, and highlighted the need for experimental validation. This is founded on the understanding that the temperature increase between passes affects the cooling rate, which subsequently impacts the microstructure (particularly the δ-ferrite content) and the mechanical properties of the weld joints. This work contributes by combining experimental procedures with numerical simulations to provide deeper insights into how interpass temperatures affect stainless steel weldments' microstructure and mechanical properties.
2.1 Experiment materials
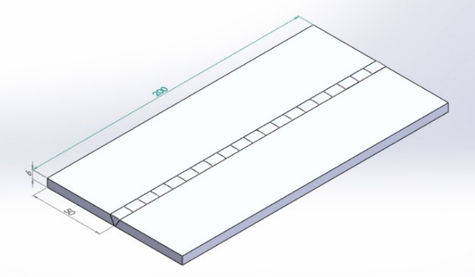
Current study utilized AISI 316 stainless steel (316L SS) plates cut from a rolled sheet of 200 mm × 100 mm × 6 mm as its primary material. Welding electrode with a 2.4 mm diameter solid electrode made of E308 stainless steel for the filler metal. Table 1 displays chemical compositions of base metal and welding electrodes.
Table 1. Base metal and welding electrode chemical compositions (wt%)
|
Material |
E308 |
AISI 316L |
|
Fe |
balance |
balance |
|
C |
0.06 |
0.028 |
|
Si |
1.2 |
0.72 |
|
Mn |
1.52 |
1.8 |
|
Cr |
18.2 |
17.4 |
|
Ni |
9.7 |
13.2 |
|
Mo |
---- |
2.7 |
|
S |
0.03 |
0.02 |
|
P |
0.043 |
0.041 |
2.2 Welding procedure
The current study involved joining AISI 316L st.st plates utilizing E308 st.st electrode in three distinct interpass temperature situations through SMAW technique. Figure 1 depicts schematic diagram of weldment specimen. Three weldment samples were welded, the first without 150℃ inter temperature pass, the second with 100℃ inter temperature pass, and the last without any inter pass temperature. Before welding, the plates underwent mechanical and chemical cleaning using acetone to eliminate impurities such as rust, dust, oil, etc. Welding joints without interpass temperature and 100℃ and 150℃ were conducted on samples according to specified circumstances outlined in Table 2. Interpass temperature was maintained during second and third passes. Welding specimens were not subjected to preheat or post heat treatment. Visual inspection was conducted on the joints during and after welding to assess their quality. All weld beads were carefully inspected to ensure they had consistent geometrical properties and there were no defects, such as surface porosity or blow holes. Furthermore, welding process employs minimum welding current based on electrode's technical production data to minimize heat input and regulate distortion.
2.3 Microstructural examination
Test specimens' cross-sections mounted and mechanically processed using 1200 SiC paper size grid. Afterward, they polished on cloth using solution of alumina powder. 33:1 Hydrochloric acid and sodium hydroxide used to etch welding specimens. An optical microscope and an energy-dispersive spectroscopy (EDS) detector on scanning electron microscopy (SEM) Model XL30 were used to examine the weldments' microstructure. The Philips X Pert-MPD System was used in conjunction with Cu Ka radiation, 40 kV, and 30 mA operational conditions for X-ray diffraction analysis (XRD) to do the phase analysis. Microhardness of the welds along their longitudinal centerline was measured using Vickers microhardness tester with pyramid indenter. For ten seconds, microhardness tester indenter was subjected to using 500 g load. For clarity, specimens marked with numbers 1, 2, and 3 represent the three types of welds: without interpass temperature, 100℃ interpass temperature, and 150℃ interpass temperature. Ferrite scope (MP30E-Fischer) was used in non-destructive evaluation to observe ferrite content on weldments regarding ferrite number. According to various cooling rates in different regions of weld zone and thus affected ferrite contents, all these tests done at center of welding joint.
Table 2. Experimental welding parameters
|
Electrode |
E308 |
|
Dia. (mm) |
2.5 |
|
Current (A) |
90 |
|
Voltage (V) |
35 |
|
Speed (mm/min) |
150 |
Figure 1. Weldment specimen schematic
During the nondestructive examination, ferrite scope (MP30E-Fischer) utilized to evaluate ferrite content on welding joints as measured by ferrite number. These tests conducted in middle of welding joint since ferrite contents might affected by variable cooling rates in different parts of weld zone.
2.4 Dilution calculation and Cr-Ni equivalents
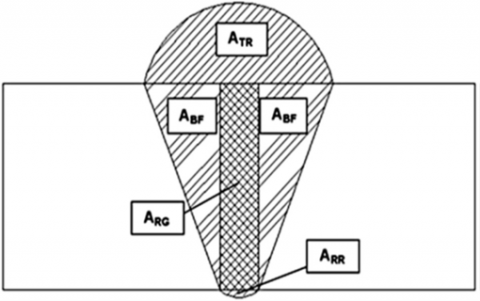
Using the geometrical features of the weld joints and the dilution percentage (DL%) between the electrode and the base metals used in welded samples were assessed, as seen schematically in Figure 2. Areas of weld reinforcement (ATR), root reinforcement (ARR), base metal fusion (ABF), and root gap (ARG) are some of these features. The percentages of AWD, ABF, and DL were obtained using the following formulae [21]:
$A W D=A R G+A T R+A B F+A R R$ (1)
$D L \%=(A B F / A W D) \times 100 \%$ (2)
Figure 2. Weldment joint sample dilution calculation schematic
Formulas for the welding metal's composition that were calculated from the dilution calculations utilized in the Creq and Nieq computations using the following equations [22]:
$Creq = Cr \%+ Mo \%+0.7 \mathrm{Nb} \%$ (3)
$N i e q=N i \%+35 C \%+20 N \%+0.25 C u \%$ (4)
with A3 representing the pure iron phase transition temperature from γ to α and Aε standing for the fictitious phase transition temperature from γ to ε, about 390 K [23]. The following is the formula that Rhodes and Thompson used to compute SFE [24]:
$S F E(m J / m 2)=1.2+1.4 \% N i+0.6 \% C r+7.7 \% M n-44.7 \% S i$ (5)
The transient thermal ANSYS analysis was utilized to conduct welding simulations. It was assumed that manual arc welding was being used in this instance. The SOLIDWORKS program generated three models illustrating welding joints with varying interpass temperatures: one without an interpass temperature, one with a temperature of 100℃, and one with a temperature of 150℃. Using these three models, we successfully predicted the variations in heat distribution, distortion, and residual stresses of the welded samples based on the interpass temperature. Each model was subjected to FEM simulation using the ANSYS software. The ANSYS program was used to build the model mesh for all three models, which consists of 438515 elements and 1910009 nodes using (the multi zone method for all model parts with 0.5 mm elements size and hard behavior mesh). The simulation employed AISI 316 stainless steel as the material. The thermal energy released by the electrical arc was replicated in ANSYS with the application of a mobile heat source mechanism. Despite numerous tries to select "killed," the ANSYS application persistently failed to remove the item that had previously been deleted. It renders them entirely immobile by markedly diminishing their rigidity. Nonetheless, these welding procedures neglect the specifications of the welding joint design. Envision a heat source that expands in a non-linear fashion or one that deviates from the ellipsoidal Gaussian normal distribution. Therefore, to incorporate this heat source into ANSYS, it is essential to create and integrate a new subroutine [25].
An electric arc welding process is initiated by utilizing an electrical source to generate a voltage difference (U) between the electrode and the base metal. Electrodes and weldments disperse radiation and convective heat during the process. Given that material melting only utilizes a small portion of the energy, it is necessary to consider power efficiency, denoted by the symbol ŋ, as a variable. The welding heat input is determined by the quantity of welding current, given by symbol I, as there is a direct correlation between the two. Hence, the precise representation of the weld heat input q can be expressed by the following formula:
$q=\eta \cdot U \cdot I$ (6)
Eq. (7) describes the heat model utilized in this study. This model can be used to measure the temperature gradient within the three-dimensional object. We employed the energy balance on the control volume in our investigation within the chosen study area. The item exhibits non-linear heat conduction, as stated in reference [26]. The primary cause for this phenomenon is the strong link between temperature and the thermophysical characteristics of the materials.
$\rho \rho(T) c(T) \frac{\partial T}{\partial t}=Q+\frac{\partial}{\partial x}\left[K_x(T) \frac{\partial T}{\partial x}\right]+\frac{\partial}{\partial y}\left[K_y(T) \frac{\partial T}{\partial y}\right]+\frac{\partial}{\partial z}\left[K_z(T) \frac{\partial T}{\partial z}\right]$ (7)
Eq. (7) provides the values for the densities (ρ), specific heats (C), and heat inputs (Q). The quantities Kx, Ky, and Kz represent the coefficients of three-dimensional conductivity. Various factors influence the temperature T. The time-dependent change of heat loss due to convection (qc) and radiation (qr) can be expressed mathematically.
$q_c=h_f\left(T-T_{\infty}\right)$ (8)
$q_r=\varepsilon \sigma\left(T^4-T_{\infty}^4\right)$ (9)
The convective coefficient is denoted by hf, while the ambient temperature is represented as T∞. The notions of emissivity (ε) and the Stefan-Boltzmann constant (σ) are interconnected when discussing the properties of a surface. If a phase transition occurs during the process, the coefficient of latent heat, which is dependent on the enthalpy H, can be expressed as:
$H=\int \rho c d T$ (10)
A precise representation of the heat source is an essential element of the FEM analysis as outlined by Goldak. This equation was derived after extensive investigation and modeling of the distributed heat source associated with arc welding. Hence, as a consequence of these factors and other ones, the outcome was the calculated distribution of temperature. The ANSYS model employs a boundary condition for thermal analysis where the temperature of the stainless steel welding zone is set at 1800℃. In order to determine the length of the HAZ for each joint design, Adams' equation, as depicted in Eq. (11), is employed. This task entails determining the maximum temperature at a specific distance (Y) from the fusion line within the welding zone. To determine the size of the phase transition region when temperatures fall below 723℃, it is necessary to compute this distance, as no change in phase happens at temperatures below that threshold.
$\frac{1}{t p-t o}=\frac{5.44 \pi k \alpha v}{Q v}\left[2+\left(\frac{v y}{2 \alpha}\right)^2\right]+\frac{1}{t m-t o}$ (11)
The equation incorporates the initial temperature of the metal (to) and a particular distance (y) referred to as the peak temperature ($t p$). The welding speed is represented by the variable $V$ and is measured in millimeters per second. The workpiece's thermal conductivity is represented by the symbol $k$, whereas $Q$ represents the amount of heat input during welding. The thermal diffusivity ($\alpha$) of the workpiece is determined by multiplying the density ($\rho$) of the material layer by the specific heat ($C$ ), and then adding the constant $K$ to the product. Finally, the precise melting point of 316 stainless steel was discovered to be 1540℃.
During the thermal analysis, the mechanical analysis takes into account the temperature histories of the nodes in the finite element mesh and saves them. Structural analysis utilizes temperature histories as thermal loading to determine the residual stress field. Thermomechanical stresses and strains can be computed at every time increment. The thermal elastoplastic material model is based on the isotropic strain hardening rule and the Von Mises yield criteria. The mechanical study utilizes the same mesh as the thermal studies and incorporates the heat results obtained from the trainset. Welding stainless steel does not induce a solid-state phase change in either the base or weld metal. Hence, the overall rate of deformation can be represented as:
$\varepsilon$ total $=\varepsilon_e+\varepsilon_p+\varepsilon_{t h}$ (12)
The relationship between elastic strain (εe), plastic strain (εp), and thermal strain (εth) is demonstrated by the above equation. The elastic strain is determined by using a combination of the temperature-dependent Young's modulus and Poisson's ratio, as described in isotropic Hooke's law [18]. The coefficient of thermal expansion is a method used to quantify thermal strain, and it is temperature-dependent. In order to quantify plastic deformation, a strain-dependent plastic model is employed, which encompasses a linear kinematic hardening model and mechanical properties that are temperature-dependent. Considering the stress and unloading that material points undergo during welding; it is essential to take into consideration the effects of kinematic hardening.
6.1 Microstructure evolution
Weld metal dilution percentages (ATR, ARR, ABF, and ARG) are shown in Figure 2 based on the geometrical features of the weld joints. Based on Eqs. (1) and (2), the AWD and DL% calculations are as follows. According to Eqs. (3) and (4), the nickel equivalent (Nieq) and chromium equivalent (Creq) values were estimated using the composition of the diluted welding metal area. Then, the Creq/Nieq ratios were determined. Based on the Creq/Nieq ratios, the solidification mode for the three weld metals may be predicted. The weld samples had Creq/Nieq ratios of 1.75, 1.71, and 1.7, respectively. We can classify the solidification mode according to these values and recent research [27, 28]:
FA mode: L → L + δ →L + δ + γ → γ + δ 1:48< Creq ̸ Nieq < 1:95
Austenite, ferrite, and liquid three-phase reaction at terminal solidification stage plus primary ferrite precipitation and continuing of δ → γ transformation below solidus line, all deeply affected by the solidification FA mode of welding joints [29]. δ-ferrite volume fraction presentation in welding metal tested by employing an MP30 magnetic induction device, which was expected to be comparable to each of the three welded samples after welding metal solidification because of the inadequate difference in Creq/Nieq ratios and Creq, Nieq, among the weld. Three weld metal δ ferrite measurements indicated less than 3% variation between them. Also, the Creq/Nieq ratio calculation reveals that weld metal without interpass temperature has the lowest value but the highest δ-ferrite content among the three joints; this is due to welding zone austenite and δ-ferrite phases contained. δ-ferrite solidifies in fusion zone as the cooling progresses, and the subsequent δ transition follows. Rapid cooling rate in SMAW process did not provide enough time to complete δ transformation since it is diffusion controlled process. Consequently, the weld zone is where the main δ ferrite is kept [30]. Quick solidification of the welding metal occurred when the SMAW welding current quickly redirected the heat source from its original location to the FA mode. The cooling rate significantly impacts the quantity of δ ferrite and how quickly it forms. As the cooling rate increases, the amount of δ ferrite also increases. As a result, the amount of weld δ ferrite will increase (since some of the δ ferrite will be retained), and the transition will go from δ to γ, but only partially. The significance of δ ferrite in the weld metal composition stems from the fact that it is crucial in preventing the development sequence of hot cracks and improving the resistance of joints to hot cracks. 5-10% δ-ferrite concentration is necessary for the material to resist heat and solidification cracking during the cooling process [31]. Figure 3 shows a backscatter high-magnification SEM image of dendritic structure in welding zone. SEM image reveals two distinct regions in microstructure denoted by A and B. Region A belongs to dendrite phase, while region B belongs to interdendritic phase.
Table 3. EDS analysis of welding zone microstructure (wt%)
|
Region |
Fe |
Ni |
Cr |
|
A |
58.32 |
11.31 |
23.37 |
|
B |
62.31 |
16.11 |
19.18 |
The results of the EDS analyses for two areas are presented in Table 3. Qualitative processing of microstructural areas EDS data illuminates’ variation in metallic element concentrations across phases. In area B, the dendrite phase, the data is shown as austenite enriched with nickel. In region A, the interdendritic phase, the data is displayed as δ-ferrite, enriched with chromium. The SEM picture mode also indicates that the dendrite phase has a lower chromium concentration than the brighter interdendritic phase. This is because, when looking at scanning electron microscopy pictures captured in backscatter mode, chemical composition differences between phases may see according to atomic numbers of main elements in each phase. This means that phase with higher nuclear number will seem brighter.
Figure 3. Weld zone dendritic arms with interdendritic structure backscatter SEM micrograph
6.2 Welding zone XRD analyses
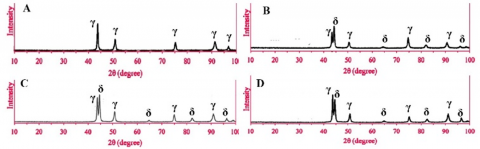
XRD patterns of 316L st.st base metal and three different welds shown in Figure 4 (A, B, C, and D). As can see, only austenite peaks observed in base metal. However, XRD not capable of detecting phases under 5% wt. Thus, very small amount of δ-ferrite may present in structure that cannot be detected with XRD analysis.
The XRD analyses above demonstrated the effects of input heat on the final welding zone microstructure. Figure 4(A) shows the base metal XRD, illustrating the full γ microstructure before the welding. Figure 4(B) shows the welding joint without any interpass temperature XRD, which means the welding is done with the fastest cooling rate; this procedure will not offer enough time for the δ to transform to γ, which produces γ structure with maximum retained δ peaks, this microstructure is very favourable due the ability of the δ in resistance the microcracks in welding zone microstructure. Figure 4(C) illustrates the welding zone with 100℃ interpass temperature; the interpass temperature will act as preheating, which will reduce the cooling rate and give more time for δ to transform to γ and produce welding zone microstructure with less retained δ; this microstructure will reduce the joint resistance to the cracking due to the lacking in delta δ percentage; also, the high γ percentage may transform to martensite if the cooling rate is fast enough. Figure 4(D) illustrates the XRD for the 150℃ interpass welding joint; the result shows the highest welding joints γ peak with the lowest δ peaks, which produce the highest cracking susceptibility structure.
Figure 4. X-ray diffraction patterns for (A) base metal (B) without interpass temp. welds (C) with 100℃ inter pass temp. welds (D) with 150℃ inter pass temp. welds
6.3 Fusion zone δ-ferrite morphology
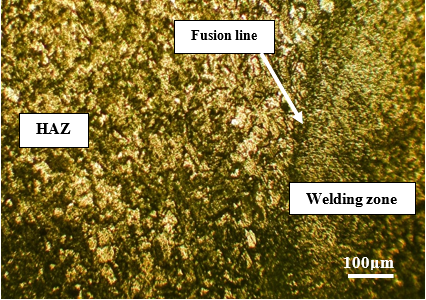
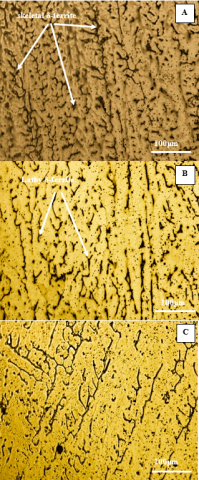
Figure 5 illustrates the changes in the morphology of δ-ferrite in fusion zone. Two distinct δ-ferrites types produced inside austenite matrix, namely lathy δ-ferrite and skeletal δ-ferrite. Fusion zone of all specimens exhibited similar δ-ferrite morphologies. This phenomenon ascribed to diverse heat cycle and rate of cooling in welding zone. Varying cooling rates due to interpass temperature of multipass welding have resulted in distinct ferrite transformation patterns and altered ferrite morphology within welding joint. Skeletal δ-ferrite morphology was produced in regions with modest cooling rates. This results from progression of austenite devouring ferrite until ferrite has significant number of ferrite-promoting elements, such as chromium, and lacks austenite promoting components, such as nickel. This stable state occurs at lower temperatures when diffusion is restricted. However, lathy δ ferrite morphology has developed in regions with rapid cooling rate. Lathy morphology has evolved due to limited diffusion from ferrite to austenite. Reducing distance across which diffusion occurs enhances efficiency of transformation process and hence reduces occurrence of spaced laths [31].
The interpass temperature, as mentioned above, affects the δ to γ transformation inside the welding zone microstructure. Figure 6(A) illustrates the welding zone without interpass temperature microstructure, both lathy δ-ferrite and skeletal δ-ferrite types seen in the structure inside γ matrix. The amount of this δ-ferrite inside the structure will depend on the molten welding metal solidification rate; this fact is proved in Figure 6(B), which shows the microstructure of the welding zone with 100℃ interpass temperature; much more γ matrix can be noted in this morphology due to the effects of the interpass temperature in reducing the cooling rate, Figure 6(C) demonstrated the structure of γ matrix with lathy δ-ferrite type, this type formed in moderate cooling rate region, the formation of this type reflected the effects of the 150℃ interpass temperature in this welding sample.
Figure 5. Welding fusion line, HAZ, and welding zone
Figure 6. Welding joint microstructure morphology (A) without interpass temperature (B) with 100℃ interpass temp. welds (C) with 150℃ inter pass temp. welds
6.4 Fusion line and HAZ morphology
Optical microscope examination displays HAZ, fusion boundary, and weld zone microstructures micrographs. The data from the previous figures and this figure indicate that a drop in interpass temperature increases the dendritic arm spacing and the size of the HAZ particles. This phenomenon may be attributed to thermal cycle alteration, whereas recrystallization occurred due to elevated interpass temperature during multipass welding process [32]. Every specimen experienced epitaxial growth, as seen in Figure 5. This growth benefits welds by seamlessly blending the weld zone with base metal grains. Weld zone HAZ contact will not experience stress concentration due to this. An important characteristic of this expansion is the extent to which the base metal and the weld zone have similar chemical and crystal structures [33].
The presence of ferrite content significantly influences the occurrence of hot cracking and the properties of joints, making the accurate assessment of ferrite content a critical issue. The welds without interpass temperature, with an interpass temperature of 100℃, and with a temperature of 150℃ had ferrite numbers of 9.1, 8.2, and 7.3, respectively. As the number of passes grows, the cooling and thermal cycling rates change, resulting in this escalation. The phase transition cannot occur at large cooling rates due to the diffusion-limited nature of the process. Therefore, the higher amount of δ-ferrite present in the weld zone results from the accelerated cooling rates. Using 5-10% concentration of δ-ferrite can improve ductility, toughness, and corrosion resistance while preventing solidification and hot cracking. All specimens considered to be within safe range with respect to these issues, according to ferrite number of various weld zones.
6.5 Stacking fault energy effects
The occurrence of dislocation motion and grain boundary migration during plastic deformation leads to a phenomenon known as stacking fault energy (SFE), which is strongly influenced by the microstructural characteristics of welded metals. The SFE has an impact on both grain boundary migration and dislocation motion. Therefore, the SFE played an equally important role in developing the grain structure. The energy required to create a single stacking fault per unit area in a perfect crystal is quantified by the SFE [34]. It influences both the migration of grain boundaries and the motion of dislocations. Full dislocations in crystal materials typically undergo a process called extended dislocations, where they decay into stacking faults and two or more partial dislocations. This process results in a more stable and lower energy state. The width of enlarged dislocations significantly influences their ability to cross-slip and climb. Firstly, dislocation climb and cross slip can't occur until the stretched dislocations break apart. Furthermore, broadening prolonged dislocations exacerbates the challenge of compressing them into complete dislocations.
SFE is strongly connected to the strain hardening effect and phase transformation of material; the SFE values for the three welded samples were calculated using Rhodes and Thompson's developed equation, Eq. (5). Early research [34, 35] shown that the martensite transformation γ → Ɛ → α’ is favored by SFE value less than (9 mJ/m2). Therefore, in this study with (15.63,15.15 and 15.09) SFE values for the three welded joints, which are much higher than AISI 316 base metal SFE value.
6.6 Microhardness test
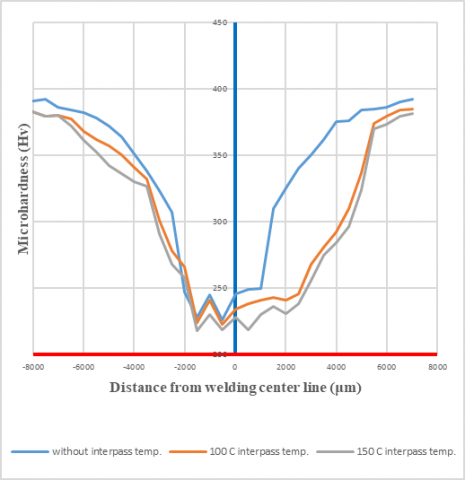
The microhardness data were acquired in a direction perpendicular to the surface of the base plate, namely in the longitudinal direction. Figure 7 demonstrates that the hardness of all weldment specimens consistently increases in the sequence of welding zone, HAZ, and base metal despite occasional fluctuations in the recorded values. The weld zone and Heat Affected Zone (HAZ) exhibited the maximum hardness values in the sample that did not have an interpass temperature. Subsequently, these values decreased to 100 and 150℃, respectively. The factors responsible for these phenomena are a larger amount of δ-ferrite in the weld zone and a smaller grain size in the hot axis zone (HAZ). Raising the interpass temperature decelerates the pace at which the weld cools, resulting in an increase in γ inside welding zone and larger grain size in HAZ. It widely recognized that presence of δ-ferrite can enhance welding joint strength [36].
Figure 7. Weldments in different zones of microhardness profile
Furthermore, the region where the weld was formed in each sample was examined to determine its minimum hardness. Annealing and recovery, caused by the heat between passes, decrease the hardness of the weld area. Nevertheless, the grain structures in the vicinity of the weld exhibited dissimilarities. Subsequently, the hardness measurements gradually increased within the HAZ while moving away from the fusion line towards the base metal. The hardness trend in the Heat Affected Zone (HAZ) is influenced by the slower cooling rate near the fusion line, which promotes the formation of grains in that region. Conversely, a detailed microstructure was seen around the main metal, which cooled faster due to sharper temperature differences [37]. Base metal displayed highest hardness values due to its superior chemical and microstructural homogeneity.
6.7 Welding joint thermal field analysis
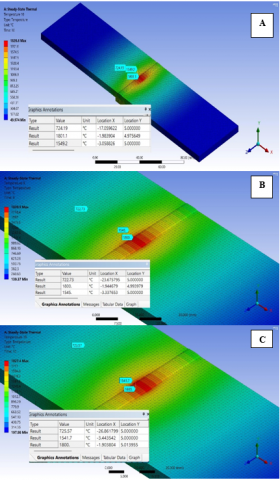
ANSYS performs calculations on the center of welding joint to determine the maximum temperature distribution, which is then recorded for the three models. These measurements were carried out to ascertain the temperature distributions, HAZ dimensions, fusion zone dimensions, and penetration depth for each of the three models. During welding without and with interpass temperature, welding temperature profile, HAZ, fusion boundary, and pentation depth are displayed in Figures 8, 9, and 10 respectively. These measurements were taken at the center of the welding joint. Based on the findings presented below, it is evident that there is a direct correlation between the interpass temperature and the HAZ width, fusion zone dimension, and welding penetration.
Figure 8. Welding joint heat distribution, HAZ, and fusion zone (FZ) (A) without interpass temperature (B) 100℃ interpass temperature (C) 150℃ interpass temperature
Figure 8(A) illustrates the heat distribution in a welding joint where no interpass temperature is used. The narrowest width of the HAZ is located 15.1 mm away from the fusion line, and there is a fusion zone measuring 1.1 mm behind the line. The ANSYS calculations determined that the HAZ width for a welding connection with an interpass temperature of 100℃ is 21.7 mm. Additionally, there is a fusion zone of 1.4 mm behind the fusion line, as shown in Figure 8(B). Figure 8(C) illustrates the measurements of the fusion zone (FZ) and the hot zone (HAZ) for a weld joint with an interpass temperature of 150℃. The diameter of the HAZ is 23.4 mm, while the FZ dimension is 1.5 mm. The Heat Affected Zone (HAZ) is determined by determining the temperature range of the base metal, which is 723℃, on both sides. This temperature range is significant since it is the range where phase transitions occur and no further changes in phases occur beyond this point.
The measurements for all the models were taken at the precise location of the welding joint, where the combined heat effects of the welding process are expected to be the most intense. The findings indicated a direct correlation between the interpass temperature and the breadth of the Heat Affected Zone (HAZ). This confirms that the HAZ is the most vulnerable region during welding and that its mechanical characteristics are influenced by the grain size and pace of cooling during welding. The delay in cooling rate due to the high interpass temperature resulted in a significant modification known as the grain growth reaction. Moreover, studies have demonstrated that austenitic steels frequently undergo a loss of their glassy state following welding or prolonged exposure to elevated temperatures [38]. Carbon carbides form at temperatures ranging from 800 to 900℃ as a result of periodic fluctuations in temperature. The most common carbides found in 304 stainless steels are Mn5C2, Mn7C3, and Mn23C6 [39]. Carbides are utilized to quantify the physical qualities of hardness and toughness in the HAZ. Nevertheless, the hardness decreases when the temperature exceeds 900℃. The emergence of grains and the decomposition of carbides are the underlying factors responsible for this phenomenon. Concerningly, Maistro [39] and Kozuh et al. [40] indicate that the persistence of alterations in the microstructure and decreases in stresses remain unresolved matters. The development and dissolution of metal complexes are influenced by the microstructure and mechanical properties of austenitic stainless steel. The microstructure is subject to continual alteration due to machine operations, welding, and heat treatment. This difficulty arises in fully austenitic metals when recrystallization and grain growth result in the formation of large grains. The existence of this substance raises the probability of liquidation cracking, which is influenced by the distribution of welding temperatures and the width of the HAZ [41].
For more validation of the simulation results the authors compared the ANSYS heat distribution model results with the experimental results to indicate the HAZ width, the HAZ width in the experimental measured by tracking the microstructure changing range, the comparing results illustrated in Table 4.
The authors explain the differences in results between the ANSYS and the experimental results to the real welding conditions which may be different from the ideal conditions in ANSYS software.
Table 4. ANSYS and experimental HAZ width for the three samples
|
Samples |
Without inter Pass Temp. |
100℃ Inter Pass Temp. |
150℃ Inter Pass Temp. |
|
ANSYS |
17 mm |
23.6 mm |
26.8 mm |
|
Experimental |
19 mm |
25 mm |
28 mm |
6.8 Welding joint model deformation analysis
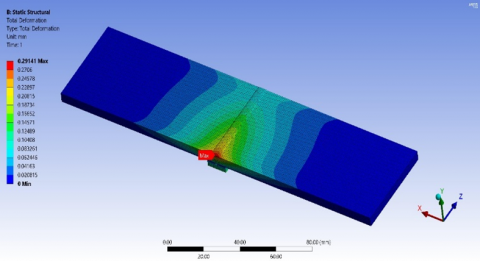
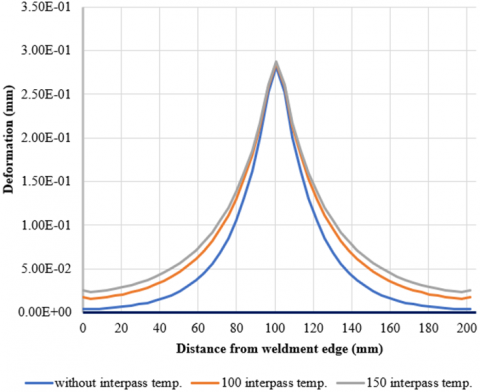
Reducing distortion is a key objective of the interpass welding technique. Welding generates thermal energy, which modifies the composition of the material. This information is established. This transition is attributed to the processes of recrystallization, grain development, and precipitate dissolution. It is important to note that specific characteristics of austenitic stainless steels render them very susceptible to deformation during the welding process. Welding induces distortion in the form of potential material deformation or displacement. This distortion compromises the structural integrity and functionality of welded constructions, potentially resulting in issues. The findings indicated that the optimal groove angle for reducing angular distortion was a V-shaped groove set at an angle of 60 degrees. Moreover, the findings from the steel plate study were in line with those of a previous inquiry. As the angle between the two surfaces increased, the amount of distortion in the angular shape of single V-groove butt weldments reduced. The variation in transverse shrinkage across the thickness of the specimen was the cause for this. By employing the concept of significant displacement, mechanical analysis investigates the deformations associated with welding. This investigation utilizes the dynamic thermal source profiles, specifically the deformation in the x-direction, within specific boundary conditions. Figure 9 displays the outcomes of the ANSYS simulation models for weldments, comparing those with and without interpass temperature treatments. The welding joint center line had the most distortion in all three models due to the concentrated heat input and the constraints at both ends. The highest deflection for all three models was 0.29 mm, representing about 5% of the weldment's thickness.
Figure 9. Welding joint and HAZ deformation
Figure 10 displays the distribution of deformation over the weldment in all three models. It reveals that the regions exposed to the welding heat for the longest duration had the highest degree of distortion. The alterations in the mechanical and thermal properties of the zone are influenced by temperature, which in turn affects these changes. This exposure leads to the modifications mentioned [42]. At around 800℃, the latent heat amplifies the specific heat and other properties during a phase change. The thermal expansion ratio (TER) is a valuable indication for assessing the final result of a phase transition. The yield stress becomes negligible when the temperature surpasses 600–700℃.
Figure 10. Deformation distribution over the three weldment models
When a material is in its most flexible and easily changeable state, it shows very little resistance to deformation. The mechanical melting point refers to the temperature at which a substance undergoes a transition from a solid to a more liquid-like state, resulting in reduced resistance to deformation. The location of the fasteners played a crucial role in determining the extent of deformation impact, as indicated by the results. The biggest distortion zone in this experiment was created by removing the welding connection and obstructing the two welding edges, using the center line of the welding. Figure 10 demonstrates a distinct negative correlation between the interpass temperature and the decrease in deformation values. As the interpass temperature increases, the soft HAZ zone will expand, as indicated by all three models, with uniform deformation decreasing from the center to the margins. Based on the ANSYS model, the interpass temperature has an impact on the distribution of distortion from the welding center joint to the weldment edge. However, it does not change the maximum deformation value.
6.9 Welding residual stresses analysis
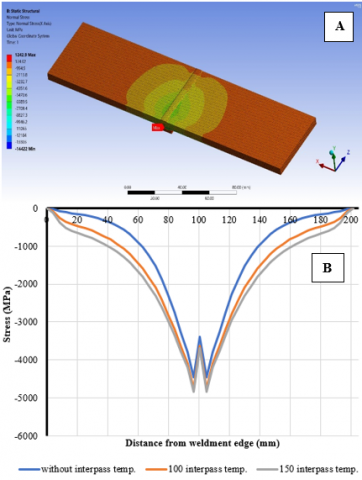
As the two edges of the weldment converge towards the center line of the welding, they generate residual strains on the welding models. The stress levels near the center of the welding joint and the borders of the two weldments are much higher compared to other places. This is seen in Figure 11(A), which depicts the stress distribution of the weldment for the three models. However, stress patterns do alter among these places. Regarding the highest levels of stress, there were virtually no differences between the three ANSYS models. According to Figure 11(B), the greatest total normal stress values for the three models were 4455.4 MPa for the welding model without interpass temperature, 4754.4 MPa for the welding model with an interpass temperature of 100℃, and 4847.7 MPa for the model with an interpass temperature of 150℃. During the process of welding, if a localized region of a joint is subjected to a sufficiently elevated temperature, both the surrounding material and the region itself undergo liquefaction, facilitating the fusion of the joint's components. The distribution of heat within the joint is characterized by its unpredictability and dynamic nature. As previously noted, the joint undergoes thermal expansion to different extents due to the unequal distribution of temperatures. The joint's variation is counterbalanced by stresses and distortions resulting from elastic and plastic strains. Another potential explanation for the temperature distribution is the presence of a significant temperature gradient, resulting in greater temperatures near the heat source and lower temperatures in other areas. The neighboring area will inherently function as a thermal barrier, impeding the expansion of the HAZ. As previously stated, in the quasistatic scenario, the temperature field remains constant while it moves down a lengthy butt joint. It is anticipated that, in these conditions, most of the joints, save for the starting and ending points, will retain a level cross-sectional form while being welded. Based on this data, it may be inferred that the molten metal will solidify first along the welding fusion line due to its faster cooling rate in the area near to the cold base metal. Due to the exceedingly high temperature of the molten metal, this area will experience substantial thermal stress. The intensity of these strains will be determined by two key variables: the temperature differential between the molten and cold base metals. Can this difference be reduced very rapidly? The interpass temperature has a negative impact on the operation by causing an increase in residual tension and distortion in the welding joint. In simpler terms, it measures the speed at which the metal can cool down after being subjected to welding heat.
Figure 11. (A) Welding joint and HAZ stress. (B) Welding joint and HAZ stress distribution diagrams for the three models
6.10 Interpass temperature effects on δ-ferrite morphology, microstructural evolution, and joint performance
Results reveal that a higher interpass temperature leads to different and wider δ-ferrite growth in the weld area which is valuable for avoiding hot cracking and for making the welds more flexible and stronger. Ferrite development in the weld is greatly influenced by the interpass temperature during cooling. All the samples contained lathy and skeletal δ-ferrite and the cooling rate was clearly tied to how these features were produced. When welding was done without intermediate temperature, higher cooling rates led to an increase in δ-ferrite in the fused portion of the sample. When the interpass temperature was higher (100℃ and 150℃), the cooling rate became slower and this decreased the percentage of δ-ferrite. Lathy δ-ferrite appeared with extreme cooling (absence of interpass temperature), but the skeletal δ-ferrite structure dominated at intermediate cooling rates of 100℃. They show that when the cooling method is different, both the ferrite’s shape and the weld’s quality alter.
The way the microstructure changed in the HAZ and fusion zone was affected by the temperature between passes. With rising interpass temperature, the HAZ grew wider because the metal didn’t cool fast enough to prevent recrystallization and growth of the grains. Since the cooling was reduced, less δ-ferrite was developed and more austenite was incorporated, most strongly in areas where the interpass temperature was 100℃ and 150℃. The increase in interpass temperature caused the XRD patterns to show that more austenite (γ) formed and less δ-ferrite was present. That means slowly cooling increases the chances of austenite forming, resulting in a stronger but less qualified microstructure through removing some ferrite. Microstructural changes in the joints were examined to evaluate their mechanical functions. The toughness of the welds decreased as the interpass temperature was increased. The decrease in hardness is caused by the decrease in δ-ferrite and the increase in austenite at higher temperatures between passes. The highest hardness readings were seen at the welds that involved no interpass heating, since more δ-ferrite was preserved in that area. Still, the HAZ was often softer, especially in joints exposed to high interpass temperatures, due to the larger grain size in those areas.
Results from the study are consistent with previous literature showing that δ-ferrite helps avoid cracks in the welding process and watching interpass temperatures carefully ensures there are no problems with the weld joint. It has also been discovered by Lippold and Kotecki [31] and further by Dadfar et al. [30] that the cooling rate of welds determines how much ferrite is formed and balancing ferrite with austenite supports the best results from the weld. The findings show that the best performance from a weld joint can be obtained by lowering the temperature just before heat passes are made. Therefore, this study is designed to show how controlling interpass temperature affects δ-ferrite structure, how the microstructure develops and how the strength of the weld joint is determined. When you keep the temperature high between welding passes, the weld cools more slowly, so δ-ferrite appears in less quantity and in a different shape which leads to a tougher weld, but there may be less δ-ferrite. The results confirm that controlling the temperature between welds is important to get the best performance from 316L stainless steel joining in industry.
A major difference in this study from earlier literature on multipass welding is the use of both numerical analysis and lab tests to look at how interpass temperature impacts the microstructure and mechanical performance of 316L stainless steel. What truly distinguishes this research from others the field can be listed in below:
An investigation was conducted on three samples of 316L SS to analyze the weld zones, HAZ, fusion line microstructure, phase transformation, and hardness. The samples were subjected to different interpass temperatures: no interpass temperature, 100℃ interpass temperature, and 150℃ interpass temperature. Joined using Shielded Metal Arc Welding (SMAW). The significant outcomes can be succinctly summarized as follows:
A. Results shown by the study that interpass temperature is a major factor controlling the amount of δ-ferrite within the fusion zone. Interpass temperatures up to 150℃ caused a reduction in δ-ferrite because cooler transformations encouraged the formation of more austenite.
B. Moderate cooling led to skeletal δ-ferrite, as opposed to the formation of lathy δ-ferrite at faster cooling which demonstrates that the way a sample cools affects ferrite structure. All weldments had a specific fusion energy (SFE) greater than 9 MJ/m², so the weld microstructure stayed stable since no martensitic transformation occurred.
C. Reduced hardness in welded joints at higher interpass temperatures resulted from having fewer amounts of δ-ferrite in the structure.
D. The highest joint performance is achieved when the interpass temperature is managed properly. Interpass temperatures kept low without preheating reduce the amount of γ-ferrite and increase crack resistance. Still, when the temperatures during interpass are higher, the tensile strength of steel often increases, but it may sacrifice the toughness of the material.
[1] Butola, R., Meena, S.L., Kumar, J. (2023). Effect of welding parameter on micro hardness of synergic MIG welding of 304l austenitic stainless steel. International Journal of Mechanical Engineering and Technology (IJMET), 4(3): 344-348.
[2] Hamdey, M.D., Mohammed, M.S., Kareem, A.H., Majdi, H.S. (2024). Thermal and mechanical analysis in joint welding of thick steel alloy plates with and without backing plate. Journal of Engineering Science and Technology, 19(5): 1974-1989.
[3] Mohammed, M.S., Hamdey, M.D., Kareem, A.H., Majdi, H.S. (2024). Investigation of copper backing plate effects in stainless steel welding distortion, heat distribution, and residual stress. International Journal of Heat and Technology, 42(4): 1434-1446. https://doi.org/10.18280/ijht.420433
[4] Deng, D., Murakawa, H. (2006). Numerical simulation of temperature field and residual stress in multi-pass welds in stainless steel pipe and comparison with experimental measurements. Computational Materials Science, 37(3): 269-277. https://doi.org/10.1016/j.commatsci.2005.07.007
[5] Manai, A. (2022). Residual stresses distribution posterior to welding and cutting processes. Intech Open. https://doi.org/10.5772/intechopen.100610
[6] Mochizuki, M., Hayashi, M., Hattori, T. (2000). Numerical analysis of welding residual stress and its verification using neutron diffraction measurement. Journal of Engineering Materials and Technology, 122(1): 98-103. https://doi.org/10.1115/1.482772
[7] Perić, M., Nižetić, S., Garašić, I., Gubeljak, N., Vuherer, T., Tonković, Z. (2020). Numerical calculation and experimental measurement of temperatures and welding residual stresses in a thick-walled T-joint structure. Journal of Thermal Analysis and Calorimetry, 141(1): 313-322. https://doi.org/10.1007/s10973-019-09231-3
[8] Sattari-Far, I., Javadi, Y. (2008). Influence of welding sequence on welding distortions in pipes. International Journal of Pressure Vessels and Piping, 85(4): 265-274. https://doi.org/10.1016/j.ijpvp.2007.07.003
[9] Alkhafaji, M.M., Mohammed, M.S., Amin, S.A., Habeeb, L.J., Majdi, H.S. (2025). Electrodes type effects on welding of copper to 304 stainless steel and analysis of heat distribution, microstructures, and mechanical properties. International Journal of Computational Methods and Experimental Measurements, 13(1): 85-96. https://doi.org/10.18280/ijcmem.130109
[10] Jiang, W., Yahiaoui, K. (2007). Finite element modelling of multi-pass fusion welding with application to complex geometries. Proceedings of the Institution of Mechanical Engineers, Part L: Journal of Materials: Design and Applications, 221(4): 225–234. https://doi.org/10.1243/14644207JMDA151
[11] Karcı, F., Kacar, R., Gündüz, S. (2009). The effect of process parameter on the properties of spot welded cold deformed AISI304 grade austenitic stainless steel. Journal of Materials Processing Technology, 209(8): 4011-4019. https://doi.org/10.1016/j.jmatprotec.2008.09.030
[12] Tian, W.Y., Kong, H.Y., Sun, Q., Liu, Y.B., Wang, C.Y., Sun, Q.J. (2025). Thermal history-tailored microstructure, microhardness, and tensile properties in heterogeneous double-wire arc directed energy deposited martensitic stainless steel. Journal of Materials Processing Technology, 341: 118904. https://doi.org/10.1016/j.jmatprotec.2025.118904
[13] Yan, J., Gao, M., Zeng, X.Y. (2010). Study on microstructure and mechanical properties of 304 stainless steel joints by TIG, laser and laser-TIG hybrid welding. Optics and Lasers in Engineering, 48(4): 512-517. https://doi.org/10.1016/j.optlaseng.2009.08.009
[14] Lee, W.S., Lin, C.F. (2001). Impact properties and microstructure evolution of 304L stainless steel. Materials Science and Engineering: A, 308(1-2): 124-135. https://doi.org/10.1016/S0921-5093(00)02024-4
[15] Lee, D.J., Jung, K.H., Sung, J.H., Kim, Y.H., Lee, K.H., Park, J.U., Shin, Y.T., Lee, H.W. (2009). Pitting corrosion behavior on crack property in AISI 304L weld metals with varying Cr/Ni equivalent ratio. Materials & Design, 30(8): 3269-3273. https://doi.org/10.1016/j.matdes.2009.01.023
[16] Hong, H.U., Rho, B.S., Nam, S.W. (2002). A study on the crack initiation and growth from δ-ferrite/γ phase interface under continuous fatigue and creep-fatigue conditions in type 304L stainless steels. International Journal of Fatigue, 24(10): 1063-1070. https://doi.org/10.1016/S0142-1123(02)00019-1
[17] Rao, K.R.M., Mukherjee, S., Raole, P.M., Manna, I. (2005). Characterization of surface microstructure and properties of low-energy high-dose plasma immersion ion-implanted 304L austenitic stainless steel. Surface and Coatings Technology, 200(7): 2049-2057. https://doi.org/10.1016/j.surfcoat.2004.06.035
[18] Garcia, C., De Tiedra, M.P., Blanco, Y., Martin, O., Martin, F. (2008). Intergranular corrosion of welded joints of austenitic stainless steels studied by using an electrochemical minicell. Corrosion Science, 50(8): 2390-2397. https://doi.org/10.1016/j.corsci.2008.06.016
[19] Davis, J.R. (2006). Corrosion of Weldments. 1st ed. ASM International.
[20] Gholipour, A., Shamanian, M., Ashrafizadeh, F. (2011). Microstructure and wear behavior of stellite 6 cladding on 17-4 PH stainless steel. Journal of Alloys and Compounds, 509(14): 4905-4909. https://doi.org/10.1016/j.jallcom.2010.09.216
[21] Hamza, S., Boumerzoug, Z., Helbert, A.L., Bresset, F., Baudin, T. (2019). Texture analysis of welded 304L pipeline steel. Journal of Metals, Materials and Minerals, 29(3): 32-41. https://doi.org/10.14456/jmmm.2019.31
[22] Kotecki, D.J. (2000). A martensite boundary on the WRC-1992 diagram—part 2: The effect of manganese. Welding Journal, 79(12): 346-s-354-s.
[23] Dai, Q.X., Cheng, X.N., Zhao, Y.T., Luo, X.M., Yuan, Z.Z. (2004). Design of martensite transformation temperature by calculation for austenitic steels. Materials Characterization, 52(4-5): 349-354. https://doi.org/10.1016/j.matchar.2004.06.008
[24] Jamaati, R., Toroghinejad, M.R. (2014). Effect of stacking fault energy on mechanical properties of nanostructured FCC materials processed by the ARB process. Materials Science and Engineering: A, 606: 443-450. https://doi.org/10.1016/j.msea.2014.03.126
[25] Cordeiro, F.D.S. (2015). A critical analysis on weld’s distortion. https://share.google/EcGT6ii4vZSy5XxDw.
[26] Lindgren, L.E., Hedblom, E. (2001). Modelling of addition of filler material in large deformation analysis of multipass welding. Communications in Numerical Methods in Engineering, 17(9): 647-657. https://doi.org/10.1002/cnm.414
[27] Ognianov, M., Leitner, H., Wieser, V. (2017). Influence of the cooling rate on the microstructure and mechanical properties in 5% Cr martensitic steel. BHM Berg-Und Hüttenmännische Monatshefte, 162(3): 94-100. https://doi.org/10.1007/s00501-017-0579-6
[28] Wu, C.F., Li, S.L., Zhang, C.H., Wang, X.T. (2016). Microstructural evolution in 316LN austenitic stainless steel during solidification process under different cooling rates. Journal of Materials Science, 51(5): 2529–2539. https://doi.org/10.1007/s10853-015-9565-0
[29] Pryds, N.H., Huang, X. (2000). The effect of cooling rate on the microstructures formed during solidification of ferritic steel. Metallurgical and Materials Transactions A, 31(12): 3155-3166. https://doi.org/10.1007/s11661-000-0095-1
[30] Dadfar, M., Fathi, M.H., Karimzadeh, F., Dadfar, M.R., Saatchi, A. (2007). Effect of TIG welding on corrosion behavior of 316L stainless steel. Materials Letters, 61(11-12): 2343-2346. https://doi.org/10.1016/j.matlet.2006.09.008
[31] Lippold, J.C., Kotecki, D.J. (2005). Welding Metallurgy and Weldability of Stainless Steels. 1st Ed. New Jersey: John Wiley & Sons, Inc.
[32] Hsieh, C.C., Lin, D.Y., Chen, M.C., Wu, W. (2007). Microstructure, recrystallization, and mechanical property evolutions in the heat-affected and fusion zones of the dissimilar stainless steels. Materials Transactions, 48(11): 2898-2902. https://doi.org/10.2320/matertrans.MRA2007162
[33] das Neves, M.D.M., Lotto, A., Berretta, J.R., Rossi, W.D., Júnior, N.D.V. (2010). Microstructure development in Nd: YAG laser welding of AISI 304 and Inconel 600. Welding International, 24(10): 739-748. https://doi.org/10.1080/09507110903568877
[34] Wang, Y., Turk, M.C., Sankarasubramanian, M., Srivatsa, A., Roy, D., Krishnan, S. (2017). Thermophysical and transport properties of blends of an ether-derivatized imidazolium ionic liquid and a Li+-based solvate ionic liquid. Journal of Materials Science, 52(7): 3719-3740. https://doi.org/10.1007/s10853-016-0735-5
[35] Monrrabal, G., Bautista, A., Guzman, S., Gutierrez, C., Velasco, F. (2019). Influence of the cold working induced martensite on the electrochemical behavior of AISI 304 stainless steel surfaces. Journal of Materials Research and Technology, 8(1): 1335-1346. https://doi.org/10.1016/j.jmrt.2018.10.004
[36] Rizvi, S.A. (2020). Effect of heat input on microstructural and mechanical properties of AISI 304 welded joint via MIG welding. International Journal of Engineering Transactions C: Aspects, 33(9): 1811-1816. https://doi.org/10.5829/ije.2020.33.09c.16
[37] Abtan, A.A., Mohammed, M.S., Alshalal, I. (2024). Microstructure, mechanical properties, and heat distribution ANSYS model of CP copper and 316 stainless steel torch brazing. Advances in Science and Technology. Research Journal, 18(1): 167-183. https://doi.org/10.12913/22998624/177299
[38] Hamza, S., Boumerzoug, Z., Raouache, E., Delaunois, F. (2019). Simulated heat affected zone in welded stainless steel 304L. Acta Metallurgica Slovaca, 25(3): 142-149. https://doi.org/10.12776/ams.v25i3.1290
[39] Maistro, G. (2018). Low-temperature carburizing/nitriding of austenitic stainless steels: influence of alloy composition on microstructure and properties. Department of Industrial and Materials Science, Chalmers University of Technology.
[40] Kozuh, S., Gojic, M., Kosec, L. (2009). Mechanical properties and microstructure of austenitic stainless steel after welding and post-weld heat treatment. Kovove Materialy-Metallic Materials, 47(4): 253-262.
[41] Islam, M., Buijk, A., Rais-Rohani, M., Motoyama, K. (2014). Simulation-based numerical optimization of arc welding process for reduced distortion in welded structures. Finite Elements in Analysis and Design, 84: 54-64. https://doi.org/10.1016/j.finel.2014.02.003
[42] Ueda, Y., Fukuda, K., Tanigawa, M. (1979). Title new measuring method of three dimensional residual stresses based on theory of inherent strain (welding mechanics, strength & design). Transactions of JWRI, 8(2): 249-256.