Abdulrahman Almutlaq*![]() | Sulaiman Alyahya
| Sulaiman Alyahya![]()
© 2023 IIETA. This article is published by IIETA and is licensed under the CC BY 4.0 license (http://creativecommons.org/licenses/by/4.0/).
OPEN ACCESS
In this investigation, a vertical multi-effects diffusion solar distillation unit was designed and evaluated to optimise the production of fresh water. The primary objective was to elucidate the impact of brine feed rate and the number of stages on the water yield, addressing the prevalent challenge of low yield typically associated with solar-assisted distillation. Experiments were conducted across a range of feed rates: 240, 480, and 720 mL/h for a single stage; 480, 960, 1920, and 2880 mL/h for a three-stage setup; and 960, 1920, and 2880 mL/h for a five-stage setup. A consistent gap distance of 16 mm was maintained in all configurations. To ensure comprehensive understanding of the process, parameters such as ambient and feed water temperatures, solar intensity, and total dissolved solids (TDS) were meticulously documented. Results revealed a positive correlation between water yield and both the number of stages and the feed rate. The maximum water yield observed was 1252 g/h m2, achieved with a five-stage setup, a feed rate of 2880 mL/h, and an average solar intensity of 721 W/m2. This setup also enabled a significant reduction in TDS by 78%. Contrarily, an increase in feed rate was associated with increased TDS measurements of the distillate.
solar energy, sea water, desalination, sustainability, thermal power, solar still
The indispensable role of desalinated water in diverse human activities, spanning from daily tasks such as cooking and washing to the operation of industrial equipment such as boilers, heat exchangers, and evaporative air coolers, is well-established. Moreover, it is central to farming practices, thereby playing a crucial part in global food security. As populations burgeon and economies expand, the demand for desalinated water is projected to surge [1, 2]. Consequently, the race to discover efficient and sustainable methods to desalinate water has captured the interests of researchers worldwide.
Thermal distillation presents an attractive avenue for water desalination, leveraging heat as the primary energy source for the evaporation of brine at relatively low temperatures. Electricity serves as a secondary energy source, functioning to operate the requisite water and vacuum pumps [3]. In this study, an alternative method, passive solar desalination using thermal localization, also referred to as vertical multi-effects solar distillation, was examined. This approach is notable for its blend of efficiency and flexibility, utilizing non-concentrated solar energy as the heat source for seawater evaporation [4].
Despite its potential, the dearth of experimental studies investigating classical vertical multi-effect distillation is striking. A recent review by Lim et al. [5] reveals that only 11 such studies have been conducted between 1980 and 2021. Thus, the primary aim of this research is to substantiate the findings of previous studies on classical vertical multi-effects solar stills, exploring the influence of feed rate and the number of stages on water productivity. Additionally, variables that naturally fluctuate, such as solar radiation, ambient temperature, and feed water temperature, will be considered.
Historically, pioneering work by Kudret Selçuk [6] introduced a two-effects, tilted solar distillation unit. This design was distinguished by cascaded evaporator troughs filled with brine from the top, eliminating the need for wicks, plastic sheets, or other materials with relatively limited lifespans. In an outdoor and forced convection experiment, Selçuk recorded a solar radiation on a horizontal surface of 792 W/m2 yielding a total water production of 0.76 kg/h m2.
Ouahes et al. [7] conducted an experimental study of a three-stage distiller, employing artificial radiation to generate 408 W/m2. They maintained a 4 cm gap between stages, and modulated the feed rate for each stage to be 522, 420, and 360 g/h for the first, second and third stages, respectively. This setup resulted in a yield of 1092 g/h m2.
Subsequently, Bouchekima et al. [8] undertook an experimental investigation into the effects of the number of stages and feed temperature on the distillate yield. Their feed source was derived from underground and approximately 65℃. At noon, the maximal production rates were approximately 0.38 and 0.65 L/h m2 for one- and two-stage setups, respectively. A notable observation was that an increase in the inlet feed temperature correlated with an increase in distillate yield.
Later, Lim et al. [9] performed a two-dimensional numerical analysis to assess the performance of a tiltable multi-effect solar distiller. They maintained a 5 mm gap between stages, and assumed three different insolations and ambient temperatures, based on the seasonal variations in South Korea. They reported the highest seasonal productivity of 7.32-7.80 kg/m2 during the summer solstice, followed by 2.93-3.17 kg/m2 during the spring/autumn equinoxes, and the lowest yield of 0.33-0.34 kg/m2 during the winter solstice.
More recently, Xu et al. [10] designed and fabricated a 3D-printed distillation unit featuring ten stages with an aperture area of 92.16 cm2 and a 5 mm inter-stage distance. They used 0.5 mm aluminium plates and employed capillary wicks (paper towels) to absorb water naturally via capillary action from the bottom. Moreover, they used silica aerogel as an insulating material for the front cover. During laboratory tests under one sun illumination, they achieved a production rate of 5.78 L/h m2. In an outdoor experiment with an average solar intensity of 670 W/m2 over 4.5 hours, they collected 61 mL of water.
Zhang et al. [11] embarked on a comprehensive numerical study that considered a diverse range of variables, including the number of stages, insulation of the side walls, distance between stages, and unit size. Their principal findings were fourfold: (1) An increase in the number of stages corresponded to an increase in efficiency, up to a certain threshold, beyond which the efficiency plateaued. This observation was noted within a range of 1-30 stages. (2) A decrease in the gap distance led to an increase in efficiency, within a studied range of 0.5-1 cm. (3) An increase in the side length of the unit resulted in an increase in efficiency, within the studied range of 5-15 cm. (4) Greater insulation of the side walls led to greater efficiency, up until the insulation reached a certain value, at which point the efficiency stabilized. The studied range was 0-15 K/W m2.
In parallel, other researchers have explored the use of cylindrical plates in lieu of flat ones, resulting in a water yield of 0.74 and 1.28 kg/h m2 for single and triple stages, respectively, at 1 kW/m2 [12]. Likewise, additional elements have been introduced to the solar distiller to enhance water output, both numerically and experimentally. For instance, a mirror was placed opposite the glass cover to increase production, as it aided in reflecting solar radiation, thereby accelerating the evaporation rate. This design innovation enabled a water yield of 29.2 and 34.5 kg/d m2 on sunny spring equinox and winter solstice days, respectively, at the equator from 10 stages with a 10 mm gap distance [13-15].
Others have designed multi-stage horizontal distillers that naturally absorb seawater through capillary action and can be placed directly in the sea. Their numerical study estimated the water productivity at 15 kg/d m2 at 22 MJ/d m2 [16].
Others have tried to extract water from burning fuel in industrial sectors and found that it may be a good source of clean water [17].
Drawing from these precedents, it can be postulated that an increase in both the feed rate and the number of effects would lead to an increase in water yield.
The solar radiation enters the double glass cover and is absorbed by the black absorber as shown in Figure 1. As a result of this absorption, the thermal energy absorbed by the black absorber transfers to the wick, thus raising the temperature, T of the brine that flows through the wick. It is this increase in temperature that causes the brine in the wick evaporates. The vapor that is generated during this process then diffuses to the next galvanized steel sheet that is 16 mm apart. After diffusing, the vapor is condensed on the surface of the next sheet due to its relatively low temperature. The condensate that is generated flows down to the collector. When the vapor condenses on the sheet, the condensation latent heat is transferred to the sheet. This transfer causes the temperature of the sheet to increase and thus, the thermal energy is transferred to the wick attached on the sheet, and brine in the wick evaporates. In order to obtain fresh water, a series of repeated evaporation, diffusion, and condensation processes occur. The seawater concentration gradually increases as it flows down the wick, leading to the discharge of concentrated seawater in a tub located at the bottom of the unit. The final effect sheet of the distiller does not have a wick attached, and its thermal energy is dissipated to the ambient [18].
Figure 1. Schematic diagram of vertical multi effect diffusion solar distillation unit (3 effects)
The experiments were carried out in Qassim, Saudi Arabia on multiple days in June and July 2023. The angle from horizontal to the surface of the diffusion solar distillation unit (tilt angle) was fixed to 90 degrees (vertical). Whereas, the azimuth angle was 66 degrees clockwise from the north. The solar radiation was measured by solar power meter (LX-107, Vici, China) which was fixed on the wooden frame of the distillation unit. All experiments were conducted in the early morning hours from 6:30 am to 11:30 am.
The diffusion solar distillation unit, shown in Figure 2, consists of a square wooden frame (Swedish wood – V, also known as Pin Sylvestre) with an external side length of 103.5 cm, an internal side length of 93.5 cm, and a thickness of 10.2 cm. The frame was painted with several layers of waterproofing sealer for protection against moisture. The wooden frame contains two tempered glass covers of 95.5 cm side length and 8 mm thickness for each; separated by an inner gap of 3 cm. This gap distance of the double glass covers was selected based on a recommendation by Lim et al. [18]. The glass covers were fixed in the frame by 1 cm groove on each side of the frame. The aperture area of the glass was 0.874 m2. Each side of the frame has 3 holes where an 8 mm threaded studs should be inserted; in order to fix the effects / stages and the absorber with the frame. The absorber was galvanized steel sheet. Its thickness was 0.3 mm and its area was 1 m2 and painted in black. The distance between the absorber and the nearest glass surface was 2.8 cm.
Each stage is square and consists of galvanized steel sheet with 0.3 mm thickness. The sheet was fixed to the sides of 16 mm square steel tubes by means of rivets, so the gap distance between two effects was 16 mm. That was the smallest tube size found in local market. The inner side length of the stage was 94 cm. The inner gaps between the tubes and the sheet were sealed by heavy duty construction adhesive (The Gorilla Glue Company, USA). At the bottom of the stage is an inclined square tube; used to collect the water droplets that condensed on the surface of the sheet. The tube inclination was approximately 7 degrees, see Figure 3.
The gap under the water collecting tube was filled with polyurethane foam. On the other side of each stage was cloth wick (Alkhuzama Disposable Towel) attached to it and serves to spread the brine as it flows from the top, see Figure 4.
Figure 2. Experiments apparatus
Figure 3. Photograph of one effect with temperature sensors attached
Figure 4. Wick in loose contact with galvanized steel plate
The studied ranges of feed rates were: (240, 480 and 720) mL/h for one stage, (480, 960, 1920 and 2880) mL/h for three stages, and (960, 1920 and 2880) mL/h for five stages. The feeding was done manually by using 60 mL syringe and equally along the effects. The feeding was not continuous; rather, it was done every 15 minutes (4 times with equal amounts every hour) for all experiments.
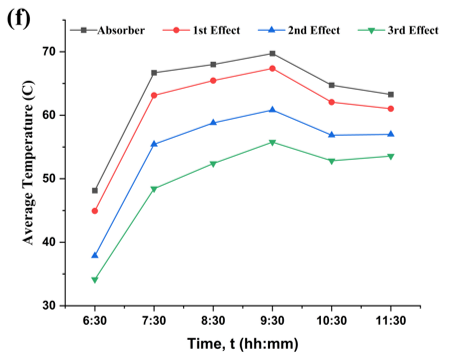
Each one of the absorber and stages had 3 temperature sensors on it. One was fixed on the center, second was above the center and the third was in the upper left corner. The average temperature was calculated for the absorber and each stage. The absorber has 3 axes of symmetry, which allows us to assume that the temperatures in the rest of the points on the surface are nearly the same. The temperature sensors are type K thermocouples, each connected to a small screen. The sides of the unit were sealed by duct tape to reduce vapor leakage Figure 5. All of the aforementioned materials and conditions could be easily replicated by other researchers.
Figure 5. Side view of distillation unit with 3 effects. A duct tape was used to reduce vapor leakage and heat loss
3.1 Experiments on 1 effect distillation unit
The solar radiation, Q was measured every hour using Vici LX-107, the measured points had a parabolic trendline. The equation of the solar radiation was found for each experiment; in order to calculate the amount of energy received within 5 hours, which represents the area under the radiation curve.
The feeding rate, $\dot{\mathrm{V}}$ is controlled manually with a syringe. It was used to measure the amount of brine that has been added manually every 15 minutes, i.e., 4 times per hour.
Figure 6 shows the result of the experiments conducted in July 2023. The number of effects tested was 1. Both of the ambient temperature, Tamb and brine temperature, Tw were measured. The brine feed rates, $\dot{\mathrm{V}}$ were (240, 480, and 720) mL/h. For all experiments, the maximum amount of energy measured in 5 hours was 3510 Wh/m2, while the lowest was 3206 Wh/m2, and the difference ratio between them was approximately 9%.
Figure 6. Results of experiments conducted on the solar distiller (1 effect) with different feed rates: (a-b) 240 mL/h; (c-d) 480 mL/h; (e-f) 720 mL/h
On July 12, the solar energy measured in 5 hours was 3356 Wh/m2. The feeding rate was 240 mL/h and the distilled water yield at the end of the experiment was 624 g. The maximum production rate was 177 g/h between 7:30 and 8:30, where the solar radiation was 761 W/m2 and 822 W/m2 respectively, the mean of these radiations was 792 W/m2. The total dissolved solids (TDS) for the feed were 4020 ppm, whereas, the measured TDS of the product water was 84 ppm.
On the 15th of July, the measured solar energy in 5 hours was 3206 Wh/m2, the feed rate was 480 mL/h, and the distilled water yield at the end of the experiment was 809 g. The maximum production rate was 217 g/h between 8:30 and 9:30, where the solar radiation was 825 W/m2 and 784 W/m2 respectively, the average of that radiation was 805 W/m2. The TDS for the feed were 4080 ppm, whereas, the measured TDS of the product water was 108 ppm. The collected amount after the experiment (at 17:30) was 30 g.
On the 17th of July, the measured solar energy in 5 hours was 3510 Wh/m2, the feed rate was 720 mL/h, and the distilled water yield at the end of the experiment was 1008 g. The maximum production rate was 268 g/h between 7:30 and 8:30, where the solar radiation was 783 W/m2 and 844 W/m2 respectively, the average of that radiation was 814 W/m2. The TDS for the feed were 3950 ppm, whereas, the measured TDS of the product water was 351 ppm. The collected amount after experiment (at 17:30) was 16 g.
3.2 Experiments on 3 effects distillation unit
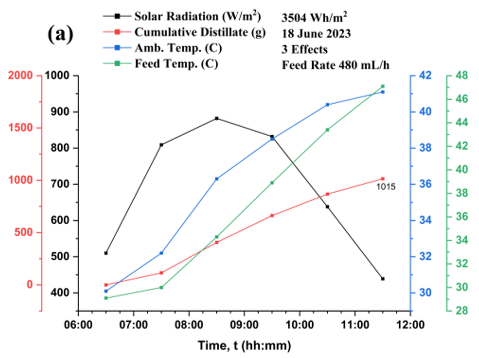
Figure 7 shows the result of the experiments conducted in June 2023. The number of effects tested was 3. The brine feed rates were (480, 960, 1920 and 2280) mL/h. For all experiments, the maximum amount of energy measured during 5 hours was 3855 Wh/m2, while the lowest was 3208 Wh/m2, and the difference ratio between them was approximately 20%.
On June 18, the solar energy measured in 5 hours was 3504 Wh/m2. The feeding rate was 480 mL/h and the distilled water yield at the end of the experiment was 1015 g. The maximum production rate was 292 g/h between 7:30 and 8:30, where the solar radiation was 809 W/m2 and 882 W/m2 respectively, the mean of these radiations was 846 W/m2. The collected amount after experiment (at 17:30) was 51 g.
On the 17th of June, the measured solar energy in 5 hours was 3855 Wh/m2, the feed rate was 960 mL/h, and the distilled water yield at the end of the experiment was 1667 g. The maximum production rate was 500 g/h between 7:30 and 8:30, where the solar radiation was 861 W/m2 and 912 W/m2 respectively, the average of that radiation was 887 W/m2. The total dissolved solids (TDS) for the feed were 22100 ppm. The collected amount after experiment (at 17:30) was 122 g. The measured TDS of the total products water was 2600 ppm, which represents 88% reduction.
On June 16, the measured solar energy in 5 hours was 3243 Wh/m2, the feed rate was 1920 mL/h, and the distilled water yield at the end of the experiment was 1989 g. The maximum production rate was 597 g/h between 7:30 and 8:30, where the solar radiation was 748 W/m2 and 853 W/m2 respectively, the average of that radiation was 801 W/m2. This rate is equivalent to 683 g/h m2 which is lower by approximately 16% than the simulation conducted by Sharon et al. [19] on 3 effects distillation unit, as they found at 800 W/m2, 1 glass cover and 6 mm gap distance the distillate would be 800 g/h m2. The reference value considered for calculating the previous percentage was the average of the two rates of the studies. The collected amount after experiment (at 17:30) was 150 g.
On the 19th of June, the measured solar energy in 5 hours was 3208 Wh/m2, the feed rate was 2280 mL/h, and the distilled water yield at the end of the experiment was 1591 g. The maximum production rate was 499 g/h between 8:30 and 9:30, where the solar radiation was 842 W/m2 and 803 W/m2 respectively, the average of that radiation was 823 W/m2. The collected amount after experiment (at 17:30) was 85 g.
Figure 7. Results of experiments conducted on the solar distiller (3 effects) with different feed rates: (a-b) 480 mL/h; (c-d) 960 mL/h; (e-f) 1920 mL/h; (g-h) 2280 mL/h
3.3 Experiments on 5 effects distillation unit
Figure 8 shows the result of the experiments conducted in July 2023. The number of effects tested was 5. The brine feed rates were (960, 1920, and 2880) mL/h. For all experiments, the maximum amount of energy measured for 5 hours was 3685 Wh/m2, while the lowest was 3495 Wh/m2, and the difference ratio between them was approximately 5%.
On July 6, the solar energy measured in 5 hours was 3685 Wh/m2. The feeding rate was 960 mL/h and the distilled water yield at the end of the experiment was 1902g. The maximum production rate was 574 g/h between 8:30 and 9:30, where the solar radiation was 886 W/m2 and 827 W/m2 respectively, the mean of these radiations was 857 W/m2. the total dissolved solids (TDS) for the feed were 2240 ppm. The collected amount after experiment (at 17:30) was 132 g. The measured TDS of the total products water was 189 ppm.
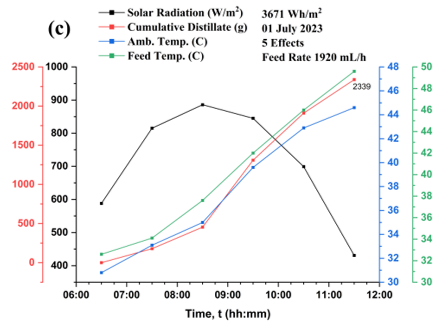
On the 1st of July, the measured solar energy in 5 hours was 3671 Wh/m2, the feed rate was 1920 mL/h, and the distilled.
water yield at the end of the experiment was 2339 g. The maximum production rate was 855 g/h between 8:30 and 9:30, which was equivalent to 978 g/h m2, where the solar radiation was 886 W/m2 and 845 W/m2 respectively, the average of that radiation was 866 W/m2. The collected amount after experiment (at 17:30) was 221g. The measured TDS of the total products water was 432 ppm.
On the 2nd of July, the measured solar energy in 5 hours was 3495 Wh/m2, the feed rate was 2880 mL/h, and the water yield at the end of the experiment was 2517 g. The maximum production rate was 1094 g/h between 9:30 and 10:30, where the solar radiation was 814 W/m2 and 627 W/m2 respectively, the average of that radiation was 721 W/m2. The TDS for the feed were 5530 ppm, whereas, the measured TDS of the product water was 1230 ppm. The collected amount after experiment (at 17:30) was 510 g. excessive brine feeding led to inefficient distillation, which will be discussed in the next subsection.
Figure 8. Results of experiments conducted on the solar distiller (5 effects) with different feed rates: (a-b) 960 mL/h; (c-d) 1920 mL/h; (e-f) 2880 mL/h
3.4 Summary of experiments
In Figure 9 the water yield is shown against the number of effects. It can be seen that as the number of effects increase, the water yield would also increase, as shown by the results of this work and previous studies [6, 8, 19]. There are several reasons for the reduction of water yield in this work compared to other studies. The most prominent of these are the intermittent water feeding that takes place every 15 minutes, as the water may evaporate before the next batch is added depending on the feed rate, the poor insulation of the sides of the unit, and the partial separation of the wick from the surface of the evaporator. In addition to the large gap distance between the stages, as it was found by Xu et al. [10] that the practically best gap distance was 5 mm.
Figure 9. Rates of water yield versus number of effects
When comparing the resulting water for single-effect experiments, it is possible to notice a continuous increase in the resulting water as the feeding rate increases. This may indicate that at low feeding rates, most of the brine has evaporated from the wick before the next amount of brine added, meaning that it is able to absorb larger amounts of brine. Figure 10 shows the water yield vs. brine feed rate.
Figure 10. Maximum water yield in each experiment versus brine feed rates
As for the experiments with three effects, it can be noted that the water yields are more than those of one effect. Here the importance of multiple effects emerges. For example, it is noted that at a feed rate of 480 mL/h, the water yield for the three effects is 334 g/m2 h, which is greater than that of single effect, which is equal to 248 g/m2 h. It is also possible to notice the repetition of what happened in the case of a single effect, where the amount of water yield increases as the feed rate increases. However, at high feeding rates, i.e., 2280 mL/h, a decrease in the water yield is observed. The possible reason for this may be that the amount of brine added is greater than what the wick can absorb, meaning that the wick is saturated with brine, which should be drained to the lower basin. That means, part of the heat stored in the evaporators have been transferred to the excess water that has been drained. Accordingly, the temperature of the evaporators decreased, and their ability to generate more vapor flux have decreased, which means a decrease in the water yield.
As for the experiments with five effects, it can be noted that the water produced from them is more than those of three effects. For example, when the feed rate was 960 mL/h, the water yield was to 657 g/m2 h from the five effects, while in the three effects it reached 572 g/m2 h. This indicates that the five effects are superior to the one and three effects. It can also be noted that at a feed rate of 2280 ml/h, the resulting water increased to 1252 g/m2 h. If this yield is compared with the previous ones, its validity can be questioned. However, when referring to the TDS of the feed water, it was 5530 ppm, and as for the TDS of the yield, it was 1230 ppm. From these values, it can be understood that the distilled water has been mixed with the feed water. Although the TDS reduction is 78%, it is possible to notice a design flaw which will be discussed in the next subsection.
A statistical analysis was conducted on the data shown in Figure 10 by using Design Expert software, with neglecting the variations in solar irradiance. Table 1 shows the analysis of variance.
Table 1. Analysis of variance (ANOVA) for two factors interaction (Water Yield)
|
Source |
Sum of Squares |
df |
Mean Square |
F-Value |
p-Value |
|
Model (Significant) |
9.66E+05 |
3 |
3.22E+05 |
39.77 |
0.0002 |
|
A- Number of Stages |
2.59E+05 |
1 |
2.59E+05 |
32.03 |
0.0013 |
|
B- Feed Rate |
96523.04 |
1 |
96523.04 |
11.93 |
0.0136 |
|
AB |
84558.93 |
1 |
84558.93 |
10.45 |
0.0179 |
|
Residual |
48562.44 |
6 |
8093.74 |
- |
- |
|
Cor Total |
1.01E+06 |
9 |
- |
- |
- |
3.5 Practical considerations
In previous experiments, it was noted that the total dissolved solids measurements varied as the brine feed rate being altered. There were two possible reasons for the presence of salts in the product: (1) The high feed rate led to the transfer of some brine from the wick to the inclined tube that collects distilled water, as in Figure 11, and this was a flaw in the design of the stage as it was necessary to either reduce the width of the collector tube; or put a barrier to prevent the excessive brine that could not be absorbed by the wick (due to its saturation) until it drains slowly from the bottom. (2) When the wick becomes in contact with the upper frame, shown in Figure 11, a surface tension phenomenon arises between the excessive brine droplets and the surface of the frame, which makes the droplets move to the surface of the frame until their weight increase then fall into the collector tube.
Brine droplets from upper frame causes the increment of TDS of product water. As the wick become in contact with the collector tube, it causes some of the excessive brine droplets to transport from the wick into the product water, and hence raising the TDS.
When another experiment was conducted with the unit tilted, Ɵ by 25 degrees towards the south, as shown in Figure 12, a severe decrease in the amount of water produced was observed. One possible explanation is the difficulty in getting the wick close to the absorber. For example, when the wick was stretched to make it in better contact with the surface it was torn, which confirms that wicks have relatively limited useful life [6]. However, when the wick was attached to the surface without stretching, it became loose, and as the brine being added, the weight of the wick increased, which made it separate from the absorber / effect. This in turn reduces the water produced by the unit. Precisely for this reason, the previous experiments were carried out at tilt angle, Ɵ of 90 degrees.
Figure 11. Variation of TDS measurements as the feed rate increases
Figure 12. Separation of wick as the unit being tilted causes reduction in water product
In this distillation unit, duct tape was used on both side walls to reduce the amount of steam lost, but it was not the ideal method, as it does not prevent leakage and does not insulate heat. As Zhang et al. [11] found in a numerical study that the side wall insulation plays an important role in efficiency optimization, which eventually means increment in water produced.
In this work, a vertical multi effects distillation unit was constructed. The front cover was made of two tempered glass plates separated by 3 cm. The distance between the surface of the glass and the absorber was 2.8 cm. The wick was painted in black. The absorber and stages were 0.3 mm thick and made of galvanized steel sheets. The distance between every two stages was 16 mm. The brine was fed manually from the top every 15 minutes. The azimuth angle was 66 degrees and the tilt angle was 90 degrees. The experiments were conducted in Qassim, Saudi Arabia.
The effect of the number of stages and feeding rates on the produced water was studied. The studied ranges of feed were: (240, 480 and 720) mL/h for one stage, (480, 960, 1920 and 2880) mL/h for three stages, and (960, 1920 and 2880) mL/h for five stages. The maximum water yields were:
Based on these findings, The assumption mentioned in the introduction was proven to be valid, as the results were consistent with some previous studies, and the water yield – in general – had a direct relation with both of the feeding rate and the number of effects / stages.
However, it was observed that the TDS measurements of the product were increasing with the increase in the feeding rate. The possible causes were analyzed and some recommendations regarding the stage design were presented.
There were Some limitations encountered during this work such as, tilting the unit to a suitable tilt angle; as this would make the wick separated from the steel sheet. Other limitation was the difficulty of stacking the effects / stages together in a simple way that prevents steam leakage.
Some suggested areas for future studies are altering the gap distance between effects, continuous brine feeding to the unit and study of the use of adhesive between the wick and the plate; and its effect on clogging the pores of the wick and whether this leads to a reduction in water absorption or not.
[1] Liu, J.G., Yang, H., Gosling, S.N., Kummu, M., Flörke, M., Pfister, S., Hanasaki, N., Wada, Y., Zhang, X.X., Zheng, C.M., Alcamo, J., Oki, T. (2017). Water scarcity assessments in the past, present, and future. Earths Future, 5(6): 545-559. https://doi.org/10.1002/2016EF000518
[2] Seckler, D., Barker, R., Amarasinghe, U. (1999). Water scarcity in the twenty-first century. International Journal of Water Resources Development, 15(1-2): 29-42. https://doi.org/10.1080/07900629948916
[3] Likhachev, D.S., Li, F.C. (2013). Large-scale water desalination methods: a review and new perspectives. Desalination Water Treat., 51(13-15): 2836-2849. https://doi.org/10.1080/19443994.2012.750792
[4] Zhang, L., Xu, Z., Zhao, L., Bhatia, B., Zhong, Y., Gonga, S., Wang, E.N. (2021). Passive, high-efficiency thermally-localized solar desalination. Energy & Environmental Science, 14(4): 1771-1793. https://doi.org/10.1039/D0EE03991H
[5] Lim, B.J., Choi, S.M., Cho, S.H., Lee, G.R., Park, C.D. (2022). Designs and performance analysis of vertical multi-effect diffusion solar distiller: A review. Desalination, 527: 115572. https://doi.org/10.1016/j.desal.2022.115572
[6] Kudret Selçuk, M. (1964). Design and performance evaluation of a multiple-effect, tilted solar distillation unit. Solar Energy, 8(1): 23-30. https://doi.org/10.1016/0038-092X(64)90007-6
[7] Ouahes, R., Ouahes, C., Le Goff, P., Le Goff, J. (1987). A hardy, high-yield solar distiller of brackish water. Desalination, 67: 43–52. https://doi.org/10.1016/0011-9164(87)90230-X
[8] Bouchekima, B., Gros, B., Ouahes, R., Diboun, M. (1998). Performance study of the capillary film solar distiller Desalination, 116(2-3): 185-192. https://doi.org/10.1016/S0011-9164(98)00194-5
[9] Lim, B.J., Yu, S.S., Chung, K.Y., Park, C.D. (2018). Numerical analysis of the performance of a tiltable multi-effect solar distiller. Desalination, 435: 23-34. https://doi.org/10.1016/j.desal.2017.12.035
[10] Xu, Z., Zhang, L., Zhao, L., Li, B., Bhatia, B., Wang, C., Wilke, K.L., Song, Y., Labban, O., Lienhard, J.H., Wang, R., Wang, E.N. (2020). Ultrahigh-efficiency desalination via a thermally-localized multistage solar still. Energy & Environmental Science, 13(3): 830-839. https://doi.org/10.1039/C9EE04122B
[11] Zhang, L., Xu, Z., Bhatia, B., Li, B., Zhao, L., Wang, E.N. (2020). Modeling and performance analysis of high-efficiency thermally-localized multistage solar stills. Applied Energy, 266: 114864. https://doi.org/10.1016/j.apenergy.2020.114864
[12] Huang, L., Jiang, H., Wang, Y., Ouyang, Z., Wang, W., Yang, B., Liu, H., Hu, X. (2020). Enhanced water yield of solar desalination by thermal concentrated multistage distiller. Desalination, 477: 114260. https://doi.org/10.1016/j.desal.2019.114260
[13] Tanaka, H., Nakatake, Y. (2005). A simple and highly productive solar still: a vertical multiple-effect diffusion-type solar still coupled with a flat-plate mirror. Desalination, 173(3): 287-300. https://doi.org/10.1016/j.desal.2004.08.035
[14] Tanaka, H., Nakatake, Y. (2005). Factors influencing the productivity of a multiple-effect diffusion-type solar still coupled with a flat plate reflector. Desalination, 186(1-3): 299-310. https://doi.org/10.1016/j.desal.2005.07.005
[15] Tanaka, H., Nakatake, Y. (2007). Numerical analysis of the vertical multiple-effect diffusion solar still coupled with a flat plate reflector: optimum reflector angle and optimum orientation of the still at various seasons and locations. Desalination, 207(1-3): 167-178. https://doi.org/10.1016/j.desal.2006.05.020
[16] Fukuia, K., Nosoko, T., Tanaka, H., Nagata, T. (2004). A new maritime lifesaving multiple-effect solar still design. Desalination, 160(3): 271-283. https://doi.org/10.1016/S0011-9164(04)90029-X
[17] Shcheklein, S.E., Dubinin, A.M., Alwan, N.T. (2021). Obtaining fresh water from natural and synthetic fuels in the energy sector. International Journal of Energy Production and Management, 6(2): 193-201. https://doi.org/10.2495/EQ-V6-N2-193-201
[18] Lim, B.J., Lee, G.R., Choi, S.M., Chung, K.Y., Park, C.D. (2020). Model optimization and economic analysis of a multi-effect diffusion solar distiller. Desalination, 485: 114446. https://doi.org/10.1016/j.desal.2020.114446
[19] Sharon, H., Reddy, K.S., Gorjian, S. (2020). Parametric investigation and year round performance of a novel passive multi-chamber vertical solar diffusion still: Energy, exergy and enviro-economic aspects. Solar Energy, 211: 831-846. https://doi.org/10.1016/j.solener.2020.10.016