Serapio Quillos-Ruiz![]() | Ciro Rodriguez*
| Ciro Rodriguez*![]() | Carlos Navarro
| Carlos Navarro![]() | Pedro Lezama
| Pedro Lezama![]()
© 2025 The authors. This article is published by IIETA and is licensed under the CC BY 4.0 license (http://creativecommons.org/licenses/by/4.0/).
OPEN ACCESS
This study addresses the critical challenge of enhancing thermal efficiency in industrial firetube boilers within the fishing industry, a sector burdened by significant fuel consumption and associated costs amidst rising fuel prices; achieving even marginal improvements in boiler efficiency can result in substantial economic savings and environmental benefits. Utilizing the Peruvian technical standard for efficiency determination, alongside recommendations from boiler manufacturers and operational conditions, this research employs artificial neural networks (ANNs) to model and predict efficiency outcomes based on various operational parameters, including fuel type and combustion conditions specifically, the study explores the impact of excess air and fuel regulation on thermal efficiency and pollutant emissions, employing applied research methods and a comprehensive analysis of boiler operation at 80% and 100% load conditions. Results demonstrate the capability of neural network models to accurately predict thermal efficiency, with optimized configurations achieving significant reductions in CO2 and CO emissions by 43% and 55%, respectively. The findings underscore the potential for neural network applications in optimizing boiler operations, offering a pathway to economic and environmental improvements in industrial processes. The study concludes with optimal operational parameters that balance efficiency gains with emission reductions, highlighting the practical implications for the fishing industry and beyond.
thermal efficiency, firetube boilers, fishing industry, CO2, CO emissions
The research examines how excess air in combustion affects steam boiler thermal efficiency and pollutant emissions (CO2, CO, SO2, NOx, HC) in an industrial fishing plant.
It is motivated by Chimbote’s high levels of environmental pollution and the scarcity of studies on thermal efficiency and emissions in industrial boilers. Optimizing efficiency in firetube boilers not only saves costs but also reduces environmental harm, which is crucial for urban areas near fishing plants.
At present, the improvement of the industrial thermal park and economic savings are sought, given the periodic increase of fuels; the fishing companies have to improve and maintain the thermal efficiency of a boiler, which is the ratio between the heat absorbed by the water to be transformed into steam and the heat caused by the combustion chamber of the boiler, product of the combustion of the fuel and air (oxygen) [1].
Fishing plants operate with firetube boilers that exceed 2,000 BHP of evaporation power, so the fuel consumption is several times the initial capital of one of the equipment. The savings that can be obtained for each point of improved thermal efficiency are important.
Likewise, optimizing the thermal efficiency of the firetube boilers gives other benefits. It improves the air quality of the environment because it reduces polluting emissions by consuming less fuel; the thermal efficiency is determined by applying the formulas of the Peruvian Technical Standard developed by Indecopi, taking into account the recommendations of the boiler manufacturer and the operating conditions and the type of fuel to be used in the plant. These values are subjected to a prediction model by artificial neural networks (ANNs) to determine the degree of interference and a minimum quadratic error [2].
In the city of Chimbote, the first fishing port in the country, the leading industrial economic activity is the processing of fishmeal, with plants that have a processing capacity of 80 tons per hour on average, for which steam is required for the cooking and drying process of the fishmeal; being produced by steam boilers of the firetube boiler type, Chimbote is also the third industrial zone with the third largest number of steam boilers in the country.
The combustion of R-500 residual oil in steam boilers generates harmful gas emissions into the air. Despite carbon dioxide (CO2) being the least powerful of the gases identified by the Kyoto Protocol, it is undoubtedly the most prevalent, making up 80% of the overall emissions that need to be decreased. CO is a gas that poses a risk to human health. Thermal efficiency is defined as the ratio of useful work output to the heat input in a heat engine. It is represented by the symbol η and indicates how effectively a heat engine converts thermal energy into work [3].
The overall objective is to determine how excess air control and fuel regulation optimize thermal efficiency and emissions control in firetube boilers in the Chimbote fishing sector in Lima, Peru. The objectives provide a structured approach, including identifying applicable AI techniques, analyzing flue gas temperature, and evaluating oxygen levels. These elements clarify the direction of the study and align with the purpose of the introduction to develop a predictive mathematical model to improve boiler efficiency.
The research examines how excess air in combustion affects steam boiler thermal efficiency and pollutant emissions (CO2, CO, SO2, NOx, HC) in an industrial fishing plant. Analyzing the relationship between excess air and fuel regulation is intended to optimize efficiency and emissions through controlled experiments involving specific operators and techniques to validate the findings.
By analyzing the relationship between excess air and fuel regulation, the study aims to optimize efficiency and emissions through controlled experiments involving operators and specific techniques to validate findings.
This study employs an applied research methodology, focusing on the practical application of theoretical principles to improve boiler efficiency and reduce emissions in an industrial setting. The research is conducted in a two-phase process: initially, the operational parameters affecting thermal efficiency and emissions are identified and modeled using ANNs; subsequently, these models are validated through empirical testing on industrial boilers.
The research target is to know the excess air in combustion and how it modifies the use of the heat obtained, which is determined by applying mathematical models to obtain the steam boiler thermal efficiency [4].
The thermal efficiency level will directly impact the number of unburned products, such as CO2, CO, SO2, NOx, and HC emissions, that are evacuated to the atmosphere.
This research understands and solves the problem in a context. The work is carried out in an industrial fishing plant where operators, machines, equipment, and installations work. The boilers are the object of study; from here, the most relevant data to be analyzed will be obtained.
An investigation has been carried out to explain how the phenomenon of the dependence of thermal efficiency on excess air and fuel regulation occurs and also to test the specific hypothesis of the investigation; its interest is focused on explaining why a phenomenon occurs and under what conditions it occurs, as well as why two or variables are correlated, being in our research the excess air and fuel to obtain different values of thermal efficiency and pollutant emissions [5].
Verify the impact of manipulating the independent variables of excess air control and fuel regulation to study the effects on optimizing thermal efficiency and pollutant emissions under strictly controlled conditions where the operator is involved and determine the technique to be applied to test the hypothesis and be able to explain with greater reliability and validity.
2.1 Boiler selection
The research focuses on firetube boilers with an evaporation power exceeding 2,000 BHP, a standard configuration in the fishing industry. An 800 BHP boiler is selected as the standard for testing, operating under full load (100%) and reduced load (80%) conditions to simulate varying operational demands.
The boiler selected for the sample is Corporación Pesquera 313-Chimbote, which has eight 800 BHP units and two 200 BHP units (Table 1). The sample boiler details are as follows:
Brand: Cleaver Brooks
Model: CB 800
Serial Number: L - 86239
Year: 1989
Type of Boiler: Horizontal fire-tube (Pyrotubular)
Passes: 4
Design Pressure: 150 Psi
Table 1. Constant values for the 800 BHP boiler
|
Parameter |
Symbol |
Value |
|
K |
- |
0.53 |
|
K1 |
- |
54 |
|
Ε |
- |
0.94 |
|
PCS |
Kj/Kg |
42 283 |
|
Af |
m2 |
73.93 |
|
Ag |
m2 |
11.50 |
|
Cauldron Length (L) |
m2 |
6.45 |
|
Diameter of the Cauldron (D) |
m |
2.60 |
|
Heating surface |
m2 |
319.62 |
|
Chimney diameter (d) |
m |
0.61 |
|
Chimney length (l) |
m |
6.00 |
|
mc |
Kg/hr |
839 |
|
mf |
Kg/hr |
12 519 |
|
B |
- |
3 |
|
H2O |
% |
0.10 |
|
H |
% |
11.5 |
|
V |
m/seg |
0.31 |
|
BHP |
BHP |
800 |
2.2 Data collection instruments
Measurement accuracy is ensured using calibrated instruments, including the E Instruments International gas analyzer and a digital thermometer, allowing for precise monitoring of boiler performance parameters such as temperature and gas emissions.
Heating Surface: 319.616 m²
Evaporation Capacity: 12,519 kg/hr
Length: 6.45 m
Diameter: 2.60 m
Chimney Diameter: 0.61 m
Chimney Length: 6 m
Fuel Consumption: 223 GPH
The selected 800 BHP boilers will follow the following steps (Table 2):
The boiler must be tested at its maximum load (100%) for the first test and then at (80%) of the load.
The boiler test pressure must be the nominal working pressure and remain constant, with a maximum variation of 5%.
It will start with excess air of 30% and then increase in percentages until reaching 110%.
The instruments for taking data must be correctly calibrated, to reduce the uncertainty of the values taken.
During the test, bottom and level purges must be avoided.
During the test, soot blowing must not be performed.
There must be no combustion gas leaks, nor air leaks.
Table 2. Typical characteristics of R-500 fuels
|
Characteristics |
Residual R-6 |
Residual R-500 |
|
API Gravity at 15.6℃ |
10.7 |
10.6 |
|
Specific Gravity at 15.6/15.6℃ |
0.9951 |
0.9958 |
|
Density (kg/m³) at 15℃ |
993.11 |
994.07 |
|
Flash Point (℃) |
80 |
96 |
|
Pour Point (℃) |
3 |
3 |
|
Viscosity (CST) at 50℃ |
627 |
1,050 |
|
Sulfur Content (% by weight) |
1.35 |
1.57 |
|
Ash Content (% by weight) |
0.05 |
0.05 |
|
Water and Sediments (% by volume) |
0.1 |
0.1 |
|
Conradson Carbon Residue |
13.6 |
15.22 |
|
Cetane Index |
- |
- |
|
Lower Calorific Value (kJ/kg) |
39,770 |
39,984 |
|
Higher Calorific Value (kJ/kg) |
42,099 |
42,283 |
|
Vanadium Content (ppm) |
80-89 |
103-135 |
|
Minimum Pumping Temperature (℃) |
45 |
50 |
|
Atomization Temperature, Forced Draft (℃) |
100-110 |
110-120 |
|
Atomization Temperature, Natural Draft (℃) |
110-120 |
120-130 |
|
Storage Temperature (℃) |
50-60 |
60-70 |
2.3 Experimental procedure
The experimental setup involves adjusting the boiler's excess air from 30% to 110% to understand its impact on thermal efficiency and emissions. Data is collected at ten-minute intervals under both load conditions, ensuring a comprehensive dataset for analysis.
2.4 Analytical methods
Thermal efficiency calculation
Thermal efficiency (η) is calculated using the formula:
$\eta \frac{Q_{\text {absorbed}}}{Q_{\text {input }}} \times 100$ (1)
where, Qabsorbed is the heat absorbed by water to produce steam, and Qinput is the heat generated in the combustion chamber.
Emissions analysis
CO2, CO, SO2, NOx, and HC emissions are quantified using the gas analyzer. The results are adjusted based on the excess air percentage to accurately reflect emission concentrations under varying operational conditions.
Combustion efficiency
Combustion efficiency (ηcomb) is crucial for understanding how effectively the fuel's energy content is converted into usable heat. It can be calculated by considering the heat loss due to unburnt fuel and heat loss in flue gases:
$\eta_{c o m b}=100-$(Loss due to unburnt fuel + Loss due to flue gases) (2)
Excess Air Level (EAL)
Excess air supplied for combustion affects both thermal efficiency and emission levels. It can be determined from the oxygen content in the flue gas using the formula:
$E A L=\left(\frac{21}{\% O_2}-1\right) \times 100$ (3)
where, %O2 is the percentage of oxygen measured in the flue gas.
$E A L=\left(\frac{21}{\% O_2}-1\right) \times 100=\left(\frac{21}{5}-1\right) \times 100=320 \%$ (4)
Emission factor estimation
To quantify emissions of CO2, CO, and NOx per unit of fuel consumed, emission factors (EF) can be calculated based on the type of fuel and combustion efficiency:
$E F_{C O_2, \mathrm{CO}, \mathrm{NOx}}=\frac{\text { Mass of } \mathrm{CO}_2, \mathrm{CO}, \mathrm{NOx} \text { emitted }}{\text { Mass of fuel consumed }}$ (5)
EFs are calculated using measured emissions and fuel consumption data to determine the mass of pollutants emitted per unit of fuel consumed.
Heat loss
The thermal energy lost through exhaust gases is a significant factor affecting boiler efficiency. It can be estimated using the flue gas temperature (Tfg), ambient temperature (Tamb), and thermal capacity of the exhaust gas (Cp):
Heat Loss $=C_p \times\left(T_{f g}-T_{a m b}\right)$ (6)
It is assumed Cp for flue gas and the actual mass flow rate.
Boiler efficiency by indirect method
The American Society of Mechanical Engineers (ASME) provides a standard for calculating boiler efficiency using the indirect method, accounting for various heat losses:
$\eta_{\text {boiler }}=100-($Total heat losses$)$ (7)
where total heat losses include losses from flue gas, unburnt fuel, radiation, and others.
Net Calorific Value (NCV) adjustment
When calculating thermal efficiency, the net calorific value of the fuel plays a crucial role. The NCV can be adjusted for moisture content and hydrogen in the fuel:
$N V C=G C V-9 \times H_2 O \times\left(2500+2.442 \times T_{f g}\right)$ (8)
where, GCV is the gross calorific value, H2O is the moisture content in the fuel, and Tfg is the flue gas temperature.
Specific gas emission rates
Specific gas emission rates provide insight into the environmental impact per unit of energy produced. These can be calculated for CO2, CO, and NOx using the formula:
Specific Emission Rate $=\frac{E F \times F \text {uel Consumption }}{\text { Energy Produced }}$ (9)
These equations, as part of the analytical methods, offer a more detailed and scientifically grounded analysis, enabling a thorough evaluation of the boiler's operational efficiency and environmental impact. The calculations will help identify key areas for improvement and develop strategies to optimize boiler performance while minimizing emissions.
2.5 Neural network modeling
Neural networks are applied across various fields, including biology, business, environment, finance, manufacturing, medicine, and the military. They address key problems such as text-to-speech conversion, natural language processing, image compression, character and pattern recognition, combinatorial problem-solving, signal processing, system behavior prediction, system modeling, and noise filtering of the most crucial aspects of a neural network is learning, defined as the process by which the network adjusts its weights in response to input-output data. The network's structure determines the types of problems it can solve. Neural networks rely on example-based learning, and for effective learning, examples must meet these criteria:
Significant: A sufficient number of examples is required. A small dataset prevents effective weight adaptation.
Representative: Examples should be diverse. A dataset biased toward specific types leads to specialization and limits generalization.
The core of the research involves developing a predictive model using (ANNs). The model is structured as follows:
Input parameters: Excess air (α) and ambient temperature (Ta) are inputs.
Output parameters: Outputs include thermal efficiency (η), flue gas temperature (Tg), CO2, CO, O2 concentrations, and surface gas temperature (Tsg).
A multi-layer perceptron (MLP) architecture is used, hidden layers use activation functions while output layers employ linear functions to match the range of input and output values. Training of the network is conducted through the Backpropagation technique, utilizing mean squared error (MSE) as the criterion for performance evaluation.
Equation for predictive modeling
The model's prediction for thermal efficiency (η) is calculated through the neural network as a function of inputs α and Ta, represented as:
$\eta=f(\alpha, T a ; \Theta)$ (10)
where, f denotes the neural network function, and $\Theta$ represents the network parameters (weights and biases) optimized during training.
2.6 Validation and testing
The neural network model's predictions are validated against empirical data collected from the boiler tests. The validation process assesses the accuracy of the model in predicting thermal efficiency and emissions, ensuring the model's applicability to real-world operations.
2.7 Materials
The selected 800 Bhp boiler will follow the following steps:
The boiler should be tested at full load (100%) for the first test and then at (80%) load.
The test pressure of the boiler must be the nominal working pressure and must remain constant, with a maximum variation of 5%.
It will start with excess air of 30%, and then it will increase in percentages until it reaches 110%.
The instruments for data collection must be correctly calibrated to reduce the uncertainty of the values taken.
During the test, bottom and level drains should be avoided.
During the test, do not blow soot.
There should be no flue gas leaks and no air leaks.
2.8 Working
The fieldwork was carried out as follows:
Applying the Technical Standard, data was collected on the following parameters.
Air excesses (λ) will vary from 30% to 110%.
Data will be taken every ten minutes at full load (100%).
The data will be taken at 80% load.
The data was recorded with the E Instruments International gas analyzer and digital thermometer from 0 to 300s℃.
Given the parameters, the neural network configurations can be obtained and applied to boiler efficiency and emissions analysis to demonstrate the process.
Excess air range identified by neural network predictions: 43% to 55%
Minimum quadratic errors for the neural network system at 80% and 100% load: 0.318 and 0.558, respectively.
The values for CO2, CO, O2 concentrations, gas temperature, and thermal efficiency are based on neural network predictions.
CO2 concentration at optimal operation: 12%
CO concentration at optimal operation: 0.02%
O2 concentration at optimal operation: 5%
Gas temperature (Tfg): 180℃
Thermal efficiency (η): 89%
Ambient temperature (Tamb): 25℃
2.9 Interpretation
The calculations demonstrate the application of analytical methods to interpret neural network predictions for boiler operations. The identified range of excess air (43% to 55%) and the high thermal efficiency (89%) underscore the neural network's potential to optimize boiler performance and reduce emissions. However, the discrepancy in the EAL calculation highlights the importance of aligning all operational and measurement parameters for accurate analysis.
For future steps, operational data from the boiler system should be used to accurately perform these calculations. Further investigation into the impact of different fuel types, combustion conditions, and boiler loads on efficiency and emissions could enhance the model's applicability and accuracy. These analyses will support the ongoing optimization of industrial boiler operations, contributing to economic savings and environmental sustainability.
The initial strategy for addressing the boiler identification problem through the concept of utilizing ANNs was developed to grasp the complex dynamics of boiler operations. The selection of two inputs, excess air (α) and ambient temperature (Ta), was driven by their critical influence on boiler efficiency and emission rates. These inputs directly affect combustion quality, heat transfer, and, ultimately, the environmental impact of boiler operations. Seven outputs were chosen to comprehensively represent the system's performance: flue gas temperature (Tg), carbon dioxide (CO2), carbon monoxide (CO), oxygen (O2), steam gas temperature (Tsg), steam temperature (Tsf), and thermal efficiency (ηt). This output array was designed to offer a holistic view of the boiler's operational status, including emission characteristics and efficiency metrics.
The neural network architecture incorporated more than 30 neurons in the hidden layer to ensure sufficient computational power for capturing the complex nonlinear relationships between the inputs and outputs. A larger number of neurons allows to learn detailed features and data patterns, although it also increases the risk of overfitting. Careful training, validation, and testing phases were implemented to mitigate this. The output layer consisted of 7 neurons, corresponding to the number of output variables, ensuring a direct mapping from the neural network's learned representations to the desired outputs.
The choice of activation functions is pivotal in the network's ability to learn and generalize. As per MATLAB's notation, sigmoidal activation functions (tansig and logsig) were employed in the hidden layer to introduce non-linearity, enabling the network to model complex relationships between inputs and outputs. These functions are particularly effective for inputs varying across a wide range, as they can map any input value into a (0, 1) range, making them suitable for handling the diverse operational parameters of boilers. The linear activation functions in the output layer were chosen to allow the network to output a range of positive values greater than 1, directly aligning with the real-world measurements of the outputs, like temperatures and efficiency percentages, which are not bounded between 0 and 1.
Developing the neural network system at 80% load capacity focused on optimizing boiler performance under reduced load conditions. This scenario is critical for understanding how boilers behave under varying operational demands, which can significantly impact efficiency and emissions. At 80% load, the boiler operates under different combustion and heat transfer conditions than full load, affecting the optimal settings for excess air and the resulting emission profiles. Training the neural network with data from this operational state enables the identification of patterns and the prediction of optimal conditions for reduced load operations, aiming to enhance thermal efficiency while minimizing harmful emissions.
This extended approach underscores the complexity of modeling and optimizing boiler operations through neural networks. By carefully selecting inputs, outputs, and the network structure and focusing on specific operational scenarios like the 80% load condition, this methodology offers a powerful tool for improving industrial boiler performance regarding both efficiency and environmental impact.
This is explained since the range of input signals covers the whole range from the smallest to the most significant values of α and Tg, a favorable condition for radial basis functions, and the outputs take positive values greater than 1, favorable for using linear functions [6].
However, consistent results were not reached since the training had many difficulties to converge, and in the cases in which it did converge, its behavior was very chaotic and generalized very poorly. Furthermore, no attempt was made to train networks with a greater number of neurons since this made training very slow, although it should be pointed out that there were possibilities of training networks of this type that worked correctly.
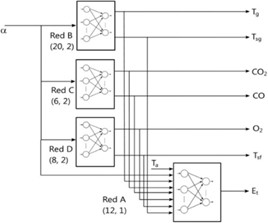
Otherwise, it was decided to divide the system into four networks, each performing a different variable identification task, as shown in Figure 1 [7]. Allowing less consumption of resources and optimizing the training process.
Figure 1. Neural network system architecture at 80% load
Neural network A calculates thermal efficiency from two inputs α and Ta, and six outputs Tg, CO2, CO, O2, Tsg, and Tsf. Network A has been constructed with 12 hidden neurons with a sigmoidal logarithm function and one output of linear type. A learning ratio of 0.2.
The outcomes of training and the performance evaluation of Network A are presented in Figure 2, calculating, in addition, the errors offered on the outputs used for training. The training of this network was a fast and consistent process, opting for the number of neurons already because sub-parameterization and overparameterization are not observed [8, 9].
Figure 2. MATLAB sheet of learning performance of neural model A with 140 training stages and decreasing mean squared error
Table 3. The errors of neural network B
|
Error |
Tg |
Tsg |
|
D P1 |
0.000 |
0.000 |
|
D P2 |
-0.075 |
- 0.043 |
|
D P3 |
-5.001 |
- 4.028 |
|
D P4 |
0.146 |
0.132 |
|
D P5 |
-1.170 |
- 0.960 |
|
D P6 |
-15.000 |
-11.855 |
|
D P7 |
-0.225 |
- 0.295 |
|
D P8 |
-0.067 |
0.065 |
|
D P9 |
0.262 |
- 0.085 |
|
D P10 |
0.349 |
- 0.221 |
|
D P11 |
-1.304 |
0.190 |
|
D P12 |
0.078 |
-0.171 |
|
e |
4.595 |
3.628 |
To evaluate the network's efficiency, the twelve-training data were taken as inputs along with interpolated data, with spacing between them constant but small enough to have a wide range of inputs.
Choosing a larger number of neurons showed slight overparameterization, with very small errors for the 12 sample points but irregular oscillatory behavior outside the sample points.
On the other hand, choosing a smaller number of neurons resulted in sub-parametrization in the curve, where the curve was very smooth over the whole range, but the errors at the 12 points were more significant (or some quite large) [4, 10].
In Table 3, Network B must calculate Tg and Tsg from the input α. This has its rationale since Tg and Tsg have similar shapes with respect to α. In neural network B, 20 hidden neurons of sigmoidal logarithm type and two in the output layer of linear type with a learning ratio of 0.5 were considered [8].
This achieved fast and effective learning and avoided the problems of overparameterization and under parameterization in the output curve. The network was tested with interpolated input data on the 12 excess air samples, covering a wide range of values.
3.2 Results of the complete neutral system
Architecture
For 80% Load (Network A): A multi-layer Perceptron (MLP) with 22 hidden layers indicates a deep neural network approach designed to capture the complex relationships between operational parameters and boiler efficiency/emissions. The description provides a clear understanding of what the architecture entails (refer to Figure 3).
Figure 3. Neural network schematic A
Input layer
The network begins with an input layer consisting of 2 neurons, corresponding to the two primary inputs: excess air (α) and ambient temperature (Ta).
Hidden layers
The network extends through 22 hidden layers following the input layer. Each of these layers contains a number of neurons, which, for the sake of this description, we can assume to be varied or uniform across layers depending on the specific design choices made during the network's development. These hidden layers use sigmoidal logarithmic activation functions to enable the network to capture and model complex, nonlinear relationships between the inputs and the desired outputs.
First hidden layer: Immediately follows the input layer, initiating the process of transforming input data through weighted connections and the sigmoidal activation function.
Intermediate hidden layers (2-21): Serve as the core computational engine of the network, each further abstracting and transforming the representations from the previous layer, progressively refining the network's internal representation of the problem.
Last hidden layer (22nd): Prepares the final transformed features for output, encapsulating the most abstract representations of the input data in relation to the desired outputs.
Output layer
The network culminates in an output layer with 7 neurons, each producing a continuous value corresponding to one of the seven outputs (Tg, CO2, CO, O2, Tsg, Tsf, and ηt). This layer uses a linear activation function suitable for the range of real-valued outputs the network aims to predict.
Connections and weights
Each neuron in every layer is linked to each neuron in the following layer via weighted connections. These weights are adjusted during the training process to minimize the prediction error, with the learning rate controlling the adjustment magnitude per training iteration.
Learning rate
Plays a critical role in the training process, with a different rate used for the 80% load model (0.2) and the 100% load model (0.02), reflecting the strategic adjustments made to optimize learning efficiency and model accuracy across different operational scenarios.
Training and optimization
The training process involves feeding the network with data on boiler operations and adjusting the weights through backpropagation based on the discrepancy between the forecasted and true values for the outputs. The network's deep architecture, featuring 22 hidden layers, enables it to discern extremely intricate patterns within the data, though this comes with heightened computational demands and a higher likelihood of overfitting., which must be carefully managed through techniques such as regularization and dropout (if applicable).
This overview provides a framework for understanding the complexity and design considerations involved in constructing and training a deep neural network with 22 hidden layers for optimizing industrial boiler operations.
Architecture
For 100% Load: Similar MLP structure but with 12 hidden layers, indicating a streamlined model compared to the 80% load scenario. This could reflect differences in the variability or complexity of the data at full operational capacity (refer to Figure 4).
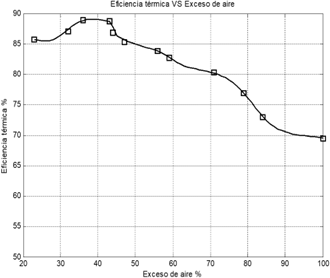
Figure 4. Effect of excess air on thermal efficiency, training with the whole system
Input layer
The architecture starts with an input layer that consists of 2 neurons. These neurons correspond to the primary inputs of the model, which are excess air (α) and ambient temperature (Ta). This layer serves as the entry point for the operational data into the neural network, facilitating the initial processing of these critical parameters.
Hidden layers
Following the input layer, the network architecture includes 12 hidden layers. Each hidden layer is designed with a uniform number of neurons, assumed to be 10 for visualization purposes but adjustable based on specific modeling requirements. These hidden layers employ sigmoidal logarithmic activation functions, a choice aimed at effectively capturing the nonlinear relationships inherent in boiler operation data. The depth provided by these 12 layers enable the network to identify intricate relationships and patterns present in the data, crucial for accurately predicting boiler efficiency and emissions at full load.
First hidden layer: Positioned right after the input layer, it begins the process of transforming and abstracting input data.
Intermediate Hidden Layers (2-11): Each layer further processes the data, with neurons in these layers contributing to the incremental abstraction and feature extraction. This gradual transformation is key to understanding the intricate dynamics of boiler efficiency and emissions.
Last hidden layer (12th): Acts as the final stage of data transformation before the output layer, preparing the learned representations for prediction output.
Output layer
The architecture culminates in an output layer with 7 neurons. This layer uses a linear activation function to produce continuous values that correspond to the model’s outputs, including temperatures, gas concentrations, and efficiency metrics. The linear function is chosen to ensure the network can output a range of values directly corresponding to the real-world measurements.
Learning rate
The learning rate for the 100% load model is set to 0.02. This lower rate compared to the 80% load model indicates a more conservative approach in adjusting the weights during the training process, which could be essential for achieving stable convergence given the potentially higher sensitivity of boiler operations at full capacity.
Training and predictive modeling
The training process involves feeding the network with data reflective of boiler operations at full capacity. The choice of 12 hidden layers represents a balanced approach between modeling complexity and computational efficiency. By adjusting weights via backpropagation and minimizing error metrics such as mean squared error (MSE), the network learns to predict key operational outcomes. The structure of this neural network, with its deep configuration of hidden layers and tailored activation functions, is optimized for identifying the intricate patterns that dictate boiler performance under varying conditions. This setup is crucial for developing actionable insights into achieving optimal thermal efficiency and reducing emissions, thereby supporting more sustainable and cost-effective boiler operations. In essence, the conceptual design of this neural network architecture embodies a sophisticated approach to tackling the challenges of boiler efficiency optimization, leveraging the depth and complexity of modern deep learning techniques to address the specific needs of industrial boiler systems at full operational load.
MSE
The 0.318 for 80% load and 0.558 for 100% load. These values indicate the model's performance, with a lower MSE at 80% suggesting better predictive accuracy under these conditions. The higher error at 100% load could be due to increased operational complexity or less data availability.
Table 4 shows the calculations for a quantitative understanding of the errors between loading conditions.
Table 4. Error variability test
|
|
Load |
Mean |
Standard Deviation |
Lower 95% CI |
Upper 95% CI |
|
0 |
80% |
0.03373 |
0.571223 |
-0.08 |
0.147 |
|
1 |
100% |
0.06126 |
0.776784 |
-0.093 |
0.215 |
Excess air optimization
The model successfully identified an optimal excess air range of 43% to 55% for maximizing thermal efficiency and minimizing emissions. This optimization is crucial for boiler operation, as it directly impacts fuel consumption rates and environmental impact. Impact on Boiler Efficiency and Emissions:
Thermal efficiency
An implied improvement in efficiency, especially noted at the 89% efficiency level, showcases the neural network's capability to identify operational adjustments that yield significant performance enhancements.
Emissions reduction
While specific reduction percentages are not provided, the optimization of excess air based on neural network predictions would lead to lower CO2 and CO emissions, contributing to environmental sustainability and compliance with regulatory standards.
Table 5. The errors of neural network A working with all neural networks
|
Error |
Neural System, ηt |
|
D P1 |
-0.054 |
|
D P2 |
0.396 |
|
D P3 |
-0.044 |
|
D P4 |
-0.062 |
|
D P5 |
0.882 |
|
D P6 |
0.448 |
|
D P7 |
-0.047 |
|
D P8 |
0.108 |
|
D P9 |
-0.148 |
|
D P10 |
-0.069 |
|
D P11 |
0.113 |
|
D P12 |
0.141 |
|
e |
0.318 |
In Table 5, these configurations have proved to be the most optimal for fast training of the networks and convergence to a small error, and, also, a fairly smooth generalization curve was achieved for all the excess air points considered. Several networks were tested for each type of network A, B, C, and D, and the one giving the smallest error was chosen [11].
Finally, the four networks were put together into the complete 4-network system that calculates the seven outputs from the two inputs α and Ta. Values of α were taken from 23 to 100, with small increments and a constant value of Ta, equal to 25℃.
It is found that the neural system gives thermal efficiencies with very low error. The total root means the square error is 0.318, slightly higher than Network A in Figure 4, 0.252.
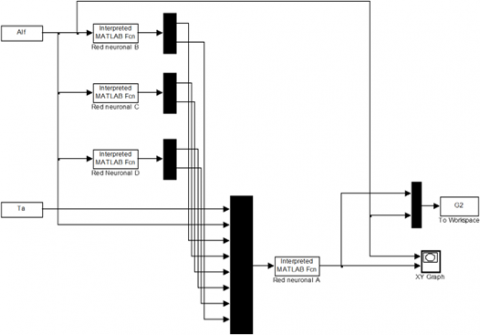
The simulation scheme used in Simulink, as well as the results and the efficiency of the neural network system is illustrated in the Figures 3 and 4 [1, 12].
3.3 Development of the neural networks system at 100%
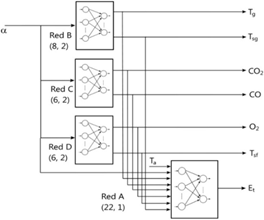
The same scheme was followed to identify the boiler system operating at 100% load as was used for the boiler operating at 80%. Therefore, the system was divided into several neural networks, A, B, C, and D, with the same input and output variables. All of this is detailed in Figure 5.
Figure 5. Neural network system architecture at 100% load
Everything indicated in the development of the 80% neuronal network system about the optimal choice of the number of neurons, the choice of the activation functions, and the procedure followed to check the performance of each network is valid here since the same criteria were followed. Therefore, each network will be discussed briefly. The results of the behavior of the neural networks evaluated and those chosen for the complete neural system are presented below and the result of the complete system itself [13].
Figure 6. Effect of excess air on thermal efficiency, training with the whole system
3.4 Results of the complete neural system
Figure 6 explains that the net A training was done with 10 points. On the other hand, the training of networks B, C, and D was done with 8 points, eliminating the third and fifth. This decision is a certain chaotic behavior of the networks when considering these points, which could be explained by errors in the measuring devices or unpredictable behavior of the boiler due to external or even internal effects.
Table 6. The errors of neural network: A working with all the neural networks
|
Error |
Neural System, ηt |
|
D P1 |
-0.004 |
|
D P2 |
0.012 |
|
D P3 |
-1.717 |
|
D P4 |
0.013 |
|
D P5 |
-0.397 |
|
D P6 |
-0.040 |
|
D P7 |
0.061 |
|
D P8 |
-0.023 |
|
D P9 |
-0.073 |
|
D P10 |
0.046 |
|
e |
0.558 |
The error over the 10 points was checked in the complete system, and it is clear that it increases a lot in the third and fifth points. The square root of the mean squared error of the system is 0.558, above the error of network A in Table 6 [11, 13, 14].
The Figure 7 depicts the effects of excess air; increasing this value causes a decrease in carbon dioxide concentration; at the 100% load curve, the curve drops sharply to 55% and then remains constant, and at 90%, it drops smoothly and remains constant from 100% excess air [15-17].
With excess air at the 80% load, the curve drops to 90% α and then remains constant. Then, CO2 levels remain constant on average at 6% with both loads.
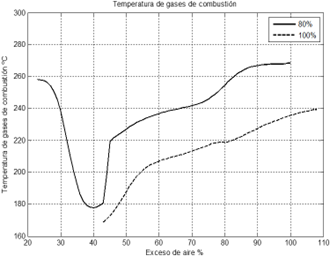
The Figure 8 shows the effects of excess air, firstly a decrease in the gas temperature and the excess air greater than 40%. The gas temperature increases with both loads, lower when working at 100%; when the excess air exceeds 55%, the gas temperature rises significantly [16-19].
Figure 7. Effect of excess air on carbon dioxide
Figure 8. Effect of excess air on flue gas temperature
Table 6. The quadratic error behavior of each neural network is between 80% and 100%
|
Load |
Neuronal Network System |
||||||||
|
A |
B |
C |
D |
A |
|||||
|
ɳt |
Tg |
Tsg |
CO2 |
CO |
O2 |
Tsf |
ɳt |
||
|
80% |
Error, ɛ |
0.252 |
4.595 |
3.628 |
0.049 |
0.0001 |
0.041 |
0.001 |
0.318 |
|
Learning ratio |
0.2 |
0.5 |
10-4 |
10-4 |
|
||||
|
100% |
Error, ɛ |
0.002 |
1.021 |
0.723 |
0.001 |
0.0000 |
0.004 |
0.011 |
0.558 |
|
Learning ratio |
0.02 |
0.1 |
0.001 |
0.001 |
|
||||
The quadratic errors of each neural network are shown in Table 6, it is observed that in network B at 80% is higher due to chaotic behavior of the gas temperature and the boiler surface temperature when working with an excess of air between 30% to 45% reflecting 4.27 an unusual behavior between the gas temperature and the thermal efficiency, which does not happen when working at 100%. The other quadratic errors of the networks have an acceptable behavior, but it is observed that in the 100% load, it was necessary to work with 8 points to improve the interpolations of the network, but with network A, a minimum quadratic error was achieved [20-23].
It was determined that the excess air is in a range of 43% to 55%, and the boiler should be operated at full load to obtain optimum thermal efficiency values and lower CO2 and CO pollutant emissions.
The type of artificial intelligence applied was by two-layer neural networks, having a sigmoidal logarithmic function and output layer a linear function, and was used the supervised learning by error correction, Backpropagation method; the training system was the feedforward network, where all the input signals go to the outputs; developing 140 stages in the training of the network at 80% load with a quadratic error of 0. 318, and in the network at 100% load, 45 stages were reached with a quadratic error of 0.558.
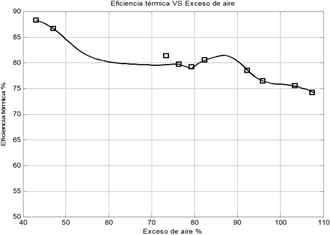
A range of flue gas temperatures was established between 170℃ to 200℃ for air excesses from 43% to 55% to obtain thermal efficiencies greater than 82%; this was achieved with 100% load; also, the CO2 concentration levels decreased from 12% to 8.5% at 80% load and from 10% to 7.5 at 100% load, while the CO concentration tends to zero with both loads.
The oxygen percentage was determined between 6.5 to 7.5%; this range of values is achieved with 80% and 100% loads for optimal efficiencies and where CO2 and CO emissions can be controlled based on the determined oxygen range [24, 25].
In the economic part, a benefit is obtained when the thermal efficiency increases by 1%. In boilers of 800 BHP, which consume residual oil R-500, approximately $116.15 per day is saved.
3.5 Managerial implications
The practical implications of applying firetube boilers in fishing plants through neural networks are in thermal efficiency management and emission control, combustion optimization, emission control, continuous improvement, and personnel development. The implementation and precise control of operating parameters through advanced techniques generate significant benefits in the efficiency and sustainability of the operations of these plants.
Regarding optimization, the need for complete combustion with optimal excess air is emphasized, as the study highlights the importance of adjusting and maintaining specific conditions in the boiler to maximize thermal efficiency and minimize harmful emissions by properly managing parameters to reduce operating costs and improve environmental performance. Implementing a neural network trained to automatically predict and adjust combustion parameters (such as excess air) allows managers to improve the accuracy and speed of operational settings, adapting to variations in plant load and fuel conditions.
On the control side, by using indicators such as CO2, CO, and O2 to assess excess air and thermal efficiency, the system facilitates more effective monitoring and management of emissions. This is crucial in the context of increasingly stringent environmental regulations. It also allows for continuous improvement, as the system's results, such as minimum root mean square error and optimum excess air range, provide management with concrete and measurable data that can be used to make continuous improvements in boiler operating processes. Moreover, training contributes to integrating advanced technologies such as neural networks that may require staff training to operate and maintain the systems, also allowing for personal development.
This study highlights the essential importance of excess air management in optimizing thermal efficiency and reducing emissions in industrial boilers, aligning with the principles outlined by existing research [1, 4, 17, 18]. By employing a feedforward artificial neural network architecture with error correction learning through the Backpropagation method, this study corroborates the theoretical underpinnings presented in prior works [1-3, 17, 18], emphasizing the efficiency of neural network models in predicting and optimizing boiler performance.
Notably, the decision to operate boilers at an excess air range of 43% to 55% for optimal thermal efficiency and emission reduction mirrors previous research findings that identify the delicate balance between complete combustion and minimal heat loss [12, 19]. This study extends the application of these principles by demonstrating their practical utility in an industrial setting, leveraging the predictability and adaptability of neural network models to achieve significant improvements.
However, this study diverges from traditional research by integrating a comprehensive analysis of CO2 and CO emissions [25, 26], highlighting the environmental implications of boiler operation optimization. The emphasis on reducing CO emissions, a harmful gas to human health, addresses operational efficiency and contributes to the environmental health and safety discourse, a perspective less explored in previous literature.
The use of neural networks to predict operational parameters and optimize thermal efficiency represents an innovative approach to addressing the challenges posed by variable fuel and operating load scenarios [18]. This study's methodology, rooted in applied research and validated by empirical data, offers a tangible solution to the inefficiencies in the industrial combustion process, advancing the field beyond theoretical models to practical applications.
Using a hidden layer gives the network greater flexibility with many fewer nodes. This is because the input to the second layer consists of signals already processed by the first layer and is therefore more complex than the inputs. However, the more hidden layers there are, the slower the training becomes and the more local minima appear.
Air excess between 43% and 55% ensures optimal thermal efficiency with CO2 levels at 7.5%-12% and O2 levels at 6.5%-7.5%. Higher air excess leads to complete combustion but increases gas temperatures, causing heat losses. Careful monitoring avoids unsustainable CO emissions.
The discussion acknowledges the interconnectedness of thermal efficiency, fuel consumption, and emissions, situating this study within the larger context of sustainable industrial practices. By bridging the gap between academic research and industrial application, this study contributes valuable insights into optimizing boiler operations, underscoring the potential of artificial intelligence technologies in achieving economic and environmental objectives.
The research conclusively demonstrates that optimizing the excess air range between 43% to 55% during boiler operations at full load can significantly improve thermal efficiency while minimizing CO2 and CO emissions in industrial pyrotubular boilers. Utilizing two-layer neural networks, the study achieved a nuanced prediction of thermal efficiency, establishing an operational blueprint for achieving efficiencies greater than 82% under full load conditions. This optimization promises substantial environmental benefits through reduced emissions and offers considerable economic advantages by enhancing fuel efficiency. Despite the promising outcomes, the study's limitations must be acknowledged. The research was confined to specific boiler types within the fishing industry, potentially limiting the generalizability of the findings across different industries or boiler configurations. Furthermore, while effective, the reliance on ANNs suggests a dependency on the availability and quality of historical operational data, which may not be uniformly accessible or applicable in all settings.
Building on the foundation laid by this study, future research efforts should aim to extend the applicability of the findings across a broader range of industrial contexts and boiler types. Investigating the integration of real-time monitoring systems to dynamically adjust operational parameters could further enhance efficiency and emission outcomes. Additionally, exploring alternative artificial intelligence models may uncover more efficient or accurate prediction methodologies, potentially improving boiler operation and environmental impact. Lastly, a comprehensive analysis of the economic impacts, including detailed cost-benefit analyses under varying operational scenarios, would provide valuable insights for industry stakeholders considering the adoption of these optimization strategies.
This research has had the main support of Dr. Serapio Quillos, representing the Universidad Nacional del Santa, and the professors of the Universidad Nacional Mayor de San Marcos, who have contributed significantly to making this project a reality.
|
Symbol |
Description |
|
Ta |
Ambient temperature, ℃ |
|
Tg |
Combustion gas temperature, ℃ |
|
Tsf |
Outer surface temperature of the boiler covering the working fluid, ℃ |
|
Tsg |
Outer surface temperature of the boiler covering the combustion gases, ℃ |
|
Tc |
Fuel temperature at the burner, ℃ |
|
K |
Siegert constant |
|
K1 |
Constant for residual fuels |
|
CO2 |
Volumetric concentration of Carbon dioxide in the exhaust gases (dry basis), % |
|
CO |
Volumetric concentration of carbon monoxide in the exhaust gases (dry basis), % |
|
O2 |
Volumetric concentration of oxygen in the exhaust gases (dry basis), % |
|
Α |
Excess air coefficient, % |
|
Af |
Area of the boiler's outer surface covering the working fluid, m2 |
|
Ag |
Area of the boiler's outer surface covering the combustion gases, m2 |
|
qrf |
Radiant heat flux on the boiler's outer surface covering the working fluid, kW/m² |
|
qrg |
Radiant heat flux on the boiler's outer surface covering the combustion gases, kW/m² |
|
Ε |
Surface emissivity |
|
BHP |
Boiler horsepower, BHP |
|
mc |
Fuel mass flow rate, kg/hr |
|
mf |
Working fluid mass flow rate, kg/hr |
|
PCS |
Higher calorific value of the fuel, kJ/kg |
|
PCI |
Lower calorific value of the fuel, kJ/kg |
|
B |
Bacharach index |
|
P1 |
Heat loss due to the enthalpy of dry exhaust gases, % |
|
P2 |
Heat loss due to unburned gases, % |
|
P3 |
Heat loss due to unburned solids, % |
|
P4 |
Heat loss due to radiation, % |
|
ηt |
Thermal efficiency, % |
|
H2O |
Water content by weight in the fuel, % |
|
H |
Hydrogen content by weight in the fuel, % |
|
hcf |
Convection coefficient of the boiler's outer surface covering the working fluid, kW/m²-℃ |
|
hcg |
Convection coefficient of the boiler's outer surface covering the combustion gases, kW/m²-℃ |
|
V |
Wind speed around the boiler, m/s |
|
Wc |
Boiler power, kW |
|
Pd |
Design pressure, maximum heat absorbed by the working fluid, bar |
|
Poperación |
Operating pressure, established by the manufacturer, bar |
[1] Jiang, X., Wang, N., Xin, J., Xia, X., Yang, X., Gao, X. (2021). Learning lightweight super-resolution networks with weight pruning. Neural Networks, 144: 21-32. https://doi.org/10.1016/j.neunet.2021.08.002
[2] Pang, Z., O’May, C. B., Choksi, B., VanRullen, R. (2021). Predictive coding feedback results in perceived illusory contours in a recurrent neural network. Neural Networks, 144: 164-175. https://doi.org/10.1016/j.neunet.2021.08.024
[3] Jiang, H., Qin, F., Cao, J., Peng, Y., Shao, Y. (2021). Recurrent neural network from adder’s perspective: Carry-lookahead RNN. Neural Networks, 144: 297-306. https://doi.org/10.1016/j.neunet.2021.08.032
[4] Peng, L., Li, X., Bi, D., Xie, X., Xie, Y. (2021). Pinning multisynchronization of delayed fractional-order memristor-based neural networks with nonlinear coupling and almost-periodic perturbations. Neural Networks, 144: 372-383. https://doi.org/10.1016/j.neunet.2021.08.029
[5] Teichmann, M., Larisch, R., Hamker, F. H. (2021). Performance of biologically grounded models of the early visual system on standard object recognition tasks. Neural Networks, 144: 210-228. https://doi.org/10.1016/j.neunet.2021.08.009
[6] Mancini, T., Calvo-Pardo, H., Olmo, J. (2021). Extremely randomized neural networks for constructing prediction intervals. Neural Networks, 144: 113-128. https://doi.org/10.1016/j.neunet.2021.08.020
[7] Bates, J. (1998). A strategy for reducing methane emissions. Studies in Environmental Science, 72: 245-264. https://doi.org/10.1016/S0166-1116(98)80016-2
[8] Ismail, F. B., Al-Bazi, A., Aboubakr, I. G. (2022). Numerical investigations on the performance and emissions of a turbocharged engine using an ethanol-gasoline blend. Case Studies in Thermal Engineering, 39: 102366. https://doi.org/10.1016/j.csite.2022.102366
[9] Feng, H., Lai, K., Zheng, Z., Lin, S., Wu, X., Tang, Q. (2024). Effects of methanol direct injection and high compression ratio on improving the performances of a spark-ignition passenger car engine. Fuel, 357: 130052. https://doi.org/10.1016/j.fuel.2023.130052
[10] Guan, W., Wang, X., Zhao, H., Liu, H. (2021). Exploring the high load potential of diesel–methanol dual-fuel operation with Miller cycle, exhaust gas recirculation, and intake air cooling on a heavy-duty diesel engine. International Journal of Engine Research, 22(7): 2318-2336. https://doi.org/10.1177/1468087420926775
[11] Qiao, J., Liu, J., Zhang, Q., Liang, J., Wang, R., Zhao, Y., Shen, D. (2023). Experimental investigation on the effects of Miller cycle coupled with asynchronous intake valves on the performance of a high compression ratio GDI engine. Fuel, 332: 126088. https://doi.org/10.1016/j.fuel.2022.126088
[12] Bunce, M., Peters, N., Subramanyam, S.K.P., Blaxill, H., Gao, J., Choi, E. (2021). The impact of advanced fuels and lubricants on thermal efficiency in a highly dilute engine. SAE International Journal of Advances and Current Practices in Mobility, 3(5): 2540-2553. https://doi.org/10.4271/2021-01-0462
[13] Peters, N., Subramanyam, S.K.P., Bunce, M., Blaxill, H., Cooper, A. (2020). Optimization of lambda across the engine map for the purpose of maximizing thermal efficiency of a jet ignition engine. SAE International Journal of Advances and Current Practices in Mobility, 2(6): 3140-3150. https://doi.org/10.4271/2020-01-0278
[14] Lao, C.T., Akroyd, J., Smith, A., Morgan, N., Lee, K.F., Nurkowski, D., Kraft, M. (2021). Modelling investigation of the thermal treatment of ash-contaminated particulate filters. Emission Control Science and Technology, 7: 265-286. https://doi.org/10.1007/s40825-021-00197-z
[15] Royko, M.M., Howell, S., Faegh, E., Mustain, W., Lauterbach, J. (2021). Influence of preparation conditions on platinum and palladium catalysts supported on anodically oxidized stainless steel wire meshes for CO oxidation. Emission Control Science and Technology, 7(3): 210-221. https://doi.org/10.1007/s40825-021-00196-0
[16] Woo, J., Wang, A., Bernin, D., Ahari, H., Shost, M., Zammit, M., Olsson, L. (2021). Impact of different synthesis methods on the low-temperature deactivation of Cu/SAPO-34 for NH 3-SCR reaction. Emission Control Science and Technology, 7: 198-209. https://doi.org/10.1007/s40825-020-00182-y
[17] Rodriguez, C. R., Luque, D., La Rosa, C., Esenarro, D., Pandey, B. (2020). Deep learning applied to capacity control in commercial establishments in times of COVID-19. In 2020 12th International Conference on Computational Intelligence and Communication Networks (CICN), Bhimtal, India, pp. 423-428. https://doi.org/10.1109/CICN49253.2020.9242584
[18] Pandey, B.K., Veeramanickam, M.R.M., Ahmad, S., Rodriguez, C., Esenarro, D. (2023). ExpSSOA-Deep maxout: Exponential shuffled shepherd optimization based deep maxout network for intrusion detection using big data in cloud computing framework. Computers & Security, 124, 102975. https://doi.org/10.1016/j.cose.2022.102975
[19] Wang, W., Brydon, R.R., Bissett, E.J., Wahiduzzaman, S. (2021). Improved pressure drop modeling during regeneration of particulate filters using soot cake with variable porosity. Emission Control Science and Technology, 7(3): 187-197. https://doi.org/10.1007/s40825-021-00194-2
[20] Ahari, H., Phillips, J., Pauly, T. (2021). Statistical approach to diesel aftertreatment accelerated aging performance correlation to in-use population. Emission Control Science and Technology, 7: 79-90. https://doi.org/10.1007/s40825-020-00180-0
[21] Walander, M., Sjöblom, J., Creaser, D., Agri, B., Löfgren, N., Tamm, S., Edvardsson, J. (2021). Modelling of mass transfer resistances in non-uniformly washcoated monolith reactors. Emission Control Science and Technology, 7(2): 153-162. https://doi.org/10.1007/s40825-020-00178-8
[22] Liora, N., Poupkou, A., Kontos, S., Meleti, C., et al. (2021). Estimating road transport pollutant emissions under traffic-congested conditions with an integrated modelling tool—Emissions reduction scenarios analysis. Emission Control Science and Technology, 7(2): 137-152. https://doi.org/10.1007/s40825-021-00191-5
[23] Aguilar Vizcarra, D., Esenarro, D., Rodriguez, C. (2021). Three steps mixed (Fire tube–water tube) vertical boiler to optimize thermal performance. Fluids, 6(3): 93. https://doi.org/10.3390/fluids6030093
[24] Omar, A., Mohamed, F., Mohammed, M., Fouad, B. (2021). Discrete event systems fault's diagnosis and prognosis using feed-forward neural networks. Journal Européen des Systèmes Automatisés, 54(6): 853-863. https://doi.org/10.18280/jesa.540607
[25] Premkumar, M., Prasanna, R., Sachan, V. (2023). Assessing wireless communication systems performance metrics using artificial neural networks: A modelling and simulation approach. Instrumentation Mesure Métrologie, 22(6): 223-229. https://doi.org/10.18280/i2m.220601
[26] Suprajitno, H. (2022). Investigations on impact of feature normalization techniques for prediction of hydro-climatology data using neural network backpropagation with three layer hidden. International Journal of Sustainable Development and Planning, 17(7): 2069-2074. https://doi.org/10.18280/ijsdp.170707