Ali A. Ismaeel*![]() | Nassr F. Hussein
| Nassr F. Hussein![]() | Mohammed A. Fayad
| Mohammed A. Fayad![]() | Azher M. Abed
| Azher M. Abed![]() | Miqdam T. Chaichan
| Miqdam T. Chaichan![]()
© 2025 The authors. This article is published by IIETA and is licensed under the CC BY 4.0 license (http://creativecommons.org/licenses/by/4.0/).
OPEN ACCESS
Particulate matter, such as dust, soot, and dirt, are moved by wind and other air movements and accumulated on top of the PV panel surface, excluding solar penetration and hence affecting the extent of power produced. Six levels of dirt density were prepared for this experiment to evaluate the effects of dust and soot on PV efficiency in the Al-Doura district, Baghdad, where emissions from power plants and oil refineries are higher than a district located 10 km away in terms of University of Technology, Baghdad, Iraq. The research showed that soot and dust accumulation on the panels reduced the flow of sunlight and intensified hot spots, thereby reducing the power generation efficiency. Dust alone reduces efficiency by up to 48%, while soot by 54%. The greater soot is ascribed to its deposit, which increases panel temperatures more than dust does. The effect of deposition density on temperature rise was proportional, to be exact, 0.54℃ to 2℃ increase per dirty deposit.
electrical efficiency, dust, photovoltaic modules, solar thermal performance, soot particles
There are many ways to utilize solar energy, from investing directly in photovoltaic systems to generating electricity and from various solar systems such as solar towers, solar water collectors, and solar air heaters through converting solar energy into thermal energy. The application of photovoltaic systems has recently expanded to many applications, including stand-alone modules, communication systems, streetlights, buildings, farming tools, transportation, etc. Furthermore, electricity generated by photovoltaic systems is a sustainable source of energy and does not emit harmful pollutants [1, 2]. There are many factors affecting photovoltaic performance, such as raw materials, temperatures, solar radiation values, shading, temperatures, wind speeds, relative humidity, and dust particles. In addition, other factors could affect the performance of PV, such as soot particles [3, 4].
According to previous studies, solar radiation heat storage in PV panels and dust accumulation are the main factors affecting the productivity of photovoltaic units [5, 6]. To restore the productivity of photovoltaic modules, photovoltaic/thermal systems are recently adopted [7]. In addition, the dust accumulation on PV modules and its harmful effects was investigated in recent work [8]. Determining the physical and chemical properties of dust origin on the PV surfaces is the first step in treating the problem [9]. According to this knowledge, cleaning methods can be applied on the PV surfaces, as well as appropriate cleaning periods for the systems [10]. Besides, the dust accumulation on solar panels can also include soiling, soot, bird droppings, combustion products, organic growth, pollen, and salt [11]. Airborne dust and soot deteriorate photovoltaic cells' performance because they block a significant amount of solar radiation from reaching photovoltaic cells, similar to shadows [12]. Dust and soot particle accumulation on PV modules also causes hot spots in multiple regions, which in turn reduces their ability to produce electricity [13, 14].
Several factors determine the rate of accumulation of soot and dust on PV surfaces, including particle concentration suspended in the air, PV cells' orientation, and weather conditions. Many studies in the literature have mentioned these factors. The size and shape of dirt particles were investigated experimentally by Hachicha et al. [14]. In the experiments, dirt particle sizes ranged from 1.61 to 38.40 (μm) with an irregular distribution were examined. Photovoltaic performance decreases as dust particle size decreases, according to the study results. With an irregular distribution, different dirt particle sizes were tested, ranging from 1.61 to 38.40 (mm). According to the study results, dust particles of smaller size have a lower photovoltaic performance. Bird droppings have been found to affect the efficiency of PV modules, according to work by Sisodia and Mathur [15]. The effect of tilt angle ranging from 00 to 900 with bird droppings was investigated, and the findings showed that the bird droppings reduce the power generation of PV modules by about 23.8% at a tilt angle of 0o. Kazem et al. [16] have experimentally examined the effect of dust bulk and vehicle exhausts on solar cells in Iraq. PV cells are affected by air pollutants by about 12%, so it might be possible to use solar cells in the Iraqi atmosphere if these cells are periodically cleaned.
Different sources of particles such as sand, cement, and gypsum are transported by flying into the air in large lumps in Iraq due to poorly stored which forming part of the dust. Over three months, Fatima et al. [17] collected and analyzed atmospheric dust. Silica oxides (sand) make up more than 50% of the collected dust, while cement and gypsum make up the majority of the rest of the dust. Even small amounts of these substances lead to a decrease in overall PV efficiency by preventing solar radiation from reaching the PV modules; it reduces transmittance and energy generation. Due to its small particle size, natural cement is the most difficult of these materials to dry clean. The greatest loss of energy occurs when synthetic gypsum accumulates in more than 25 grams per square meter. The study recommended cleaning the PV unit without using any liquids to avoid interacting with building materials.
The impact of dust deposition on photovoltaic module performance was evaluated by Chaichan and Kazem in Baghdad, Iraq [18]. A two-month collection of dust was analyzed for its components. A study was conducted to determine the effects of three main elements on the performance of PV modules by comparing them individually with naturally accumulating dust. It was found that the degradation rates of PV panel performance are significantly affected by accumulated dust components. The study examined several types of cleaning materials in addition to the best ones available locally. It was proved that sodium solution is the most effective way to recover lost electricity when particulates and natural dust are present on the surfaces of photovoltaic panels. It is reported that dust with a high content of calcium carbonate has a limited effect on PV performance. Whenever this dust (containing high levels of calcium carbonate) needs to be cleaned, high-pressure water should be used. In addition, to prevent these substances from sticking to the panel's surface, the surface should be wiped clean with a cloth or brush.
The Iraqi government has strategically developed its view of electricity production from renewable sources, especially solar PV technology. In several governorates of Iraq, contracting has begun for photovoltaic stations to produce cumulative electric power of 750 MW. A further goal is to increase solar energy's share of electricity production to 15% by 2030 [19]. As a result of the shortage of electricity supplied by the network, many citizens installed PV systems on their roofs. These systems may be less effective due to high levels of air pollution caused by environmental conditions and human activities over the past forty years.
Accordingly, the present study investigates the thermal and electrical performance of PV panels after the deposition of mixed dust and dirt. In two different locations within Baghdad city, dust is laden with fine particles and ash from fossil fuel that is used in power plants and oil refineries negatively affects the performance of PV modules. In Baghdad, the Dora area is the most suitable for conducting practical tests due to the high level of pollution emitted from fossil fuel combustion in electric generator stations and oil refineries. In contrast, the second study area is about 10 km away from the first area and is far from any power plant or refinery. Therefore, the level of pollutants in the atmosphere of this area will be reduced compared to the first area.
In this experimental study, the attempt was to evaluate the effect of dust on the performance of photovoltaic energy. Tests were conducted in two locations inside Baghdad. The difference between the two locations is that in one of them, the suspended dust is full of soot emitted from refinery chimneys and power plants. The second location is far from these effects, but the dust has high proportions of volatile building material particles due to poor storage.
2.1 Study location
Baghdad is the capital city of Iraq, located at 33.3152°N and 44.3661°E. Usually, it has a desert climate characterized by high air temperatures, especially in summer, and frequent dust storms. It is predicted that Iraq could experience more than 280 dust storms per year by 2022, according to the Iraqi Ministry of Environment and the United Nations [19]. In Baghdad, dust storms are caused by a variety of factors, including drought and soil erosion due to the large population increase in the city, which turned a large part of Mesopotamia into barren lands [20]. During the period of rapid population growth in Baghdad, large areas of agricultural land were converted into residential neighborhoods [21]. Baghdad's skies are constantly polluted, not only by dust storms but also by the emissions of pollutants caused by the combustion process of the power plants and by the special diesel-powered generators that are installed inside the city to compensate for the lack of electricity supply from the national grid [22]. The large number of public and private transportation also increased levels of soot and ashes in the Baghdad sky [22].
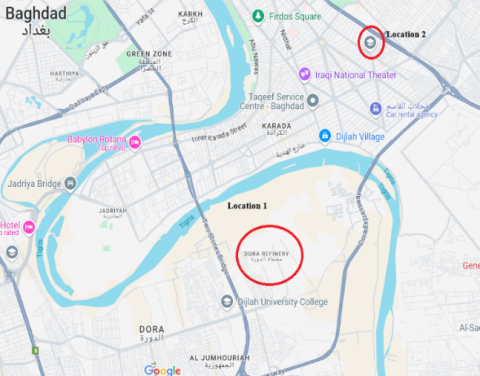
To conduct the practical experiments, the Al-Dora district in Baghdad city, as shown in Figure 1, has been chosen for this study. This district was selected because of the high carbon levels in its local weather, its proximity to the Al-Dora oil refinery, three power plants within the Al-Dora power station, and the Al-Dora expressway. Table 1 contains details about power plants [23]. The second set was located at the University of Technology, Al-Sinaa Street, about 10 km away from the first location, as shown in Figure 1.
Table 1. Details of power plants near AL-Dora district [23]
|
Name |
Type |
Total Capacity (MW) |
|
Southern Baghdad Thermal Power Plant |
Thermal (Combined Cycle) |
1000 |
|
Baghdad South Thermal Power Station |
Thermal |
165 |
|
Baghdad South Gas Power Plant-1 |
Natural Gas (Open cycle) |
246 |
|
Baghdad South Gas Power Plant-2 |
Natural Gas (Open cycle) |
350 |
|
Al-Rasheed Gas Power Plant |
Natural Gas (Open cycle) |
94 |
|
Dora Power Station |
Thermal (Open cycle) |
640 |
|
Al-Dora Al-Rasheed Gas Power Station |
Natural Gas (Open cycle) |
250 |
Figure 1. The two test locations
2.2 Experimental setup
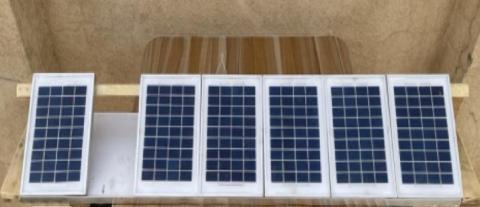
An experimental evaluation of dust and emission effects on a photovoltaic system consisting of six photovoltaic panels was conducted. As shown in Figure 2, the panels were installed 34 degrees off-center towards the south. A description of the PV panels used for this study can be found in Table 2.
Figure 2. The six tested PV modules
Table 2. PV panel characteristics
|
Item |
Specs. |
|
Module type |
MP-30WP |
|
Manufacturer |
NKSolar |
|
Peak power (Pmax) |
3 (W) |
|
Maximum power current (Imp) |
0.34 (A) |
|
Maximum power voltage (Vmp) |
9 (V) |
|
Short circuit voltage (Voc) |
0.41 (A) |
|
Open circuit voltage (Voc) |
11.25 (V) |
|
Maximum system voltage (VDC) |
1000 |
|
Dimensions |
425 × 650 × 35 mm |
|
Wind resistance |
2400 |
For comparison, the panel at the left of the figure was fully cleaned daily before measurements. For the remaining five panels, they divided the exposing Panel No. 2 to outdoor weather for one week and then cleaned. After two weeks of exposure to these conditions, panel number 3 is cleaned. Similarly, the fourth panel is exposed to these conditions for three weeks, and so on. An average of the outputs of Panel 1 is used to calculate the weekly totals for Panel 1. Likewise, average readings are taken for the other panels. From these readings, its performance was determined based on its output over five weeks (five measuring cycles). Thus, the best period to clean panels in this area can be determined based on the rate of power recovery after exposure and cleaning.
To reduce dust adhesion to the panel, the dusty panel is placed in a hot environment laboratory to simulate the atmosphere of Iraq. The lab is in the Electromechanical Engineering Department, University of Technology- Iraq. The lab environment was maintained at 40℃ for 8 hours to remove moisture and dry the dust. Afterward, the panel is cleaned with a soft brush, the dust is collected in a container and weighed with a sensitive scale, and a sample is taken to analyze the components of the dust, focusing on the percentage of ash and soot using X-ray diffraction (XRD) and X-ray fluorescence (XRF). The panel was cleaned and took its place for a new exposure round.
2.3 Instrumentations
Experiments were conducted outdoors in Baghdad starting from 01 March 2022. The study was conducted in March because its days are characterized by low dust storms compared to other months, as declared by Ghazi et al. [24]. There were three types of measurements: panel's performance, dust accumulation weights, and the soot and ash percentage using the instruments specified in Table 3.
Table 3. The measuring instrumentation, properties, and uncertainties
|
Measuring Device |
Origin |
Measured Items |
Uncertainty |
|
AEROCET device |
USA |
PM1, PM2.5, PM7, PM10, and TSP |
±0.23 |
|
Mt-4617 (light intensity meter) |
USA |
Solar radiation intensity |
±1.23% |
|
digital Multimeter |
Japan |
PV current and voltage |
±1% |
|
Thermocouples type K |
China |
temperature |
±0.15% |
|
Max-Advance II data logger |
Japan |
PV current and voltage at variable load. |
±0.2% |
|
RHT2nl-02 |
UK |
Humidity and temperature |
±0.3% and ±0.28% |
|
Sensitive balance (EJ6I0-E) |
Japan |
Weight |
±0.02% |
|
X-ray diffraction (XRD) |
USA |
Qualitatively formation |
±0.1% |
|
X-ray fluorescence (XRF) |
USA |
Quantitatively formation |
±0.07% |
The AEROCET device was used to measure pollution in terms of its content of volatile nanoparticles in the outdoor air. It is USA-made and can measure PM1, PM2.5, PM7, PM10, and total suspended particles (TSP) in the atmospheric air and has an uncertainty of ±0.23. A light intensity meter type (Mt-4617) was used to measure solar radiation intensity, which measures irradiance ranges from 0 to 1500 W/m2. This device has an uncertainty of ±1.23%. A digital Multimeter with ±1% uncertainty was used to determine the currents and voltages associated with the PV panel. Current and voltage were measured at variable loads using a Max-Advance II data logger and have a significant uncertainty of ±0.2%. Two thermocouples supply each panel type K. It is fixed on the back of the panels, in the middle and 10 mm from the top and bottom ends. The thermocouples' attached measures were recorded using a digital thermometer that has an accuracy of up to ±0.15%, as well as the temperatures of the PV panels were measured. Temperature and humidity sensor type RHT2nl-02 were used to measure the ambient temperature and humidity with an accuracy of ±0.3% for temperature and ±0.28% for humidity measurements.
Additionally, thermal images of the PV panels were taken using a thermal camera. The amount of dust accumulated on the surface of the panels was weighed using a sensitive balance (EJ6I0-E), which has a measurement accuracy of ±0.02%. X-ray diffraction (XRD) and X-ray fluorescence (XRF) of dust particles were performed to qualitatively and quantitatively characterize the substances involved in dust formation. These devices have high accuracy and tiny uncertainty of ±0.1% and ±0.07%, respectively. By using the equation suggested by Al-Kayiem et al. [25], the total uncertainty of the experiments was calculated. With a very high accuracy rate and limited uncertainty of 2.14%, the practical measurements were very accurate.
3.1 Total suspended particles (TSP) in air
Figure 3 shows the distribution of TSP concentrations in the air of the two study areas for a full day, starting at midnight and ending at the same time the next day. The results show a significant difference in TSP concentrations between the two study areas. Very high concentrations of soot particles characterize the Al-Dora region throughout the day, while for the University of Technology area, they are much lower and reach low levels in the period from 9 pm to 5 am. TSP levels increase for both areas during official working hours and in the evening because they are both located near a very busy highway with trucks, vehicles, and buses, which also emit high TSP concentrations. Over a full day, the increase in TSP concentrations measured in the Al-Dawra area was about 111.87% higher than that measured in the area of the University of Technology. This huge difference in these concentrations is due to the distance of the University of Technology from the main sources of pollutant emissions (power stations and refineries), as the air works to distribute and dilute TSP concentrations during its spread. This figure also gives reliability to the researchers' choice of study areas.
Figure 3. The measured suspended particle concentrations in the air for the tested locations
3.2 Collect dust specifications
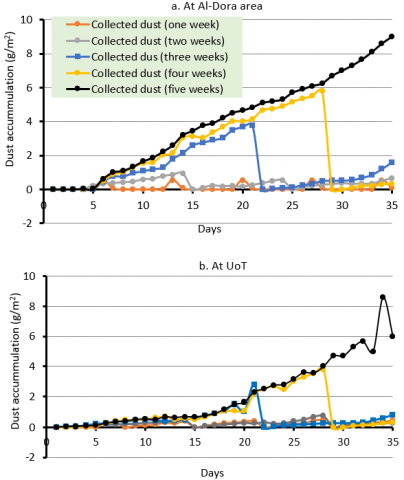
Figure 4 shows the rate of dust accumulation on the PV panels studied. Panel No. 1, which is cleaned daily, has a low dust accumulation rate. The accumulation rate of soot particles increases with the increase in the period of exposure PV to weather conditions without cleaning, reaching its peak after 35 days of exposure for panel No. 6. The total accumulated dust and pollution quantities for the Al-Dora area were 3.67, 11.43, 40.04, 76.76 and 138. 85 g/m2 for weeks 2, 3, 4, 5, and 6, respectively. At the same time, the total accumulated dust and pollution quantities for the University of Technology area were 1.57, 8.67, 16.75, 34.7, and 76.22 g/m2 for weeks 2, 3, 4, 5, and 6, respectively, as declared from Figure 4(b). When comparing Figures 4(a) and (b), it can be observed that the rate of dust accumulation in the case of the Al-Dora area increases rapidly even after cleaning operations.
In contrast, in the area of the University of Technology, the rate of accumulation is lower than in the Al-Dora area, and its increase is slower. This result is expected due to the high pollution of the Al-Dora area and the high percentage of soot in the accumulated dust. This type of dust is difficult to clean by conventional methods and forms a base on which new dust builds and accumulates at a faster rate.
Figure 4. Measured dust accumulation rate on the tested PV panels
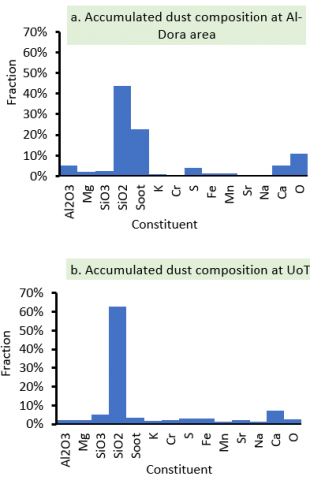
The dust ingredients on PV panel No. 6 (exposed to weather conditions for five weeks without cleaning) are shown in Figures 5(a) and (b). Baghdadi's dust is mostly silicon, around 43.9%, since the city is surrounded by desert on all sides, and the Anbar Desert in the west and northwest is the most prominent. The second highest component of accumulated dust is emitted from the electric power stations' chimneys and Al-Dora refineries (22.6%). Burning high-sulfur Iraqi fuel causes the dust to contain a high percentage of sulfur (3.84%). In the University of Technology case, the highest component is silicon at around 62.9%, followed by calcium compound found in volatile building materials at 7%. Compared with studies conducted in Baghdad, such as Fatima et al. [17], and Kazem et al. [18], the rest of the components are at acceptable levels. Exposure to soot that contains ultra-fine particles (PM1.0 and PM2.5) and sulfur for a long period expose living organisms, especially children, to serious health risks.
Figure 5. The accumulated dust constituent for panel No. 6
3.3 Electrical performance indicator
3.3.1 Hourly output power test
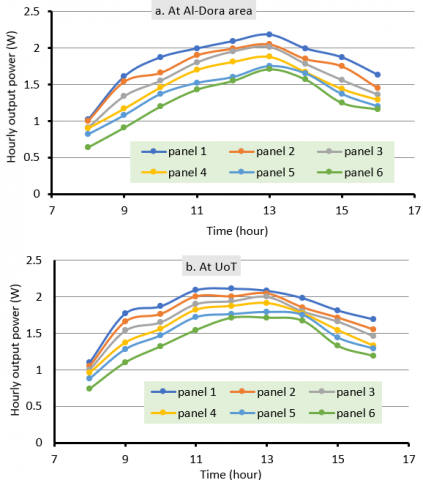
The average hourly output power tests are shown in Figure 6(a). The output energy produced by the clean panels deteriorates significantly when the panels are dirtied. In comparison with clean panels, dirt-covered panels produced less power by about 17%, with an average difference of 0.22 W (Figure 6). Compared to clean panels, dirty panels had an average difference of 0.13W and decreased performance by 12.7%. It can be seen that soot affected the performance of the PV modules, resulting in a decrease in efficiency. Combined dust and soot have a dark color that facilitates the absorption of light, whether direct or diffuse, and keeps the light from reaching the photovoltaic cell surface. Increasing dust concentrations lead to increased deterioration in the production of power over time. An additional factor contributing to the deterioration is the increasing temperature of the photovoltaic module, which is another cause of dust accumulation. The results show that the deterioration rate of solar panels was 4.15%, 6.5%, 12%, 18%, and 21.6% for panel numbers 2, 3, 4, 5, and 6, respectively, compared to clean panel No. 1.
Figure 6(b) shows the same behavior with smaller differences in the power degradation rate of 3.3%, 5.9%, 10.8%, 16.37%, and 19.57% for panel numbers 2, 3, 4, 5, and 6, respectively, compared to clean plate number 1. This reduction in power degradation can be attributed to the lower concentrations of dust and soot on the surface of the modules.
Figure 6. Hourly output power for the tested PV panels
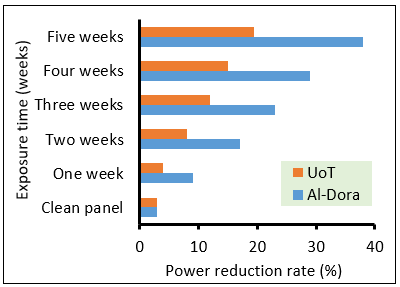
3.3.2 Power reduction rate
The generating power of the experimental cases was compared to the standard values of the clean unit. According to Figure 7, the power production of PV panels did not reach the standard production value because of weather effects that reduced the power production by 3%. In the Al-Dora area, as a result of dust accumulation, the performance of the PV panels decreased by 9%, 17%, 23%, 29%, and 34% compared to standard PV peak power. At the University of Technology, the performance of the PV panels decreased by 4%, 8%, 12%, 15%, and 19.5% compared to standard PV peak power. When working in a dusty atmosphere (with soot in particular, as in the Al-Dora area), PV modules operate at less than two-thirds of their standard power. While at areas far from the pollution sources (such as the University of Technology), the power degradation rate is less than in the first case. To restore the lost capacity, the panels must be cleaned periodically, and the cleaning frequency should be shorter when working in an environment with dust with a high percentage of soot particles and ash.
Figure 7. Power reduction rates for the PV panels studied
3.4 Thermal performance indicator
3.4.1 Hourly solar radiation behavior
Figure 8 shows the solar radiation behavior during daylight hours, and it can be noted that the value of solar radiation increases with time to reach its maximum value at midday and then begins to decrease.
Figure 8. Solar radiation behavior with daylight hours
3.4.2 Comparison in terms of PV thermal profile
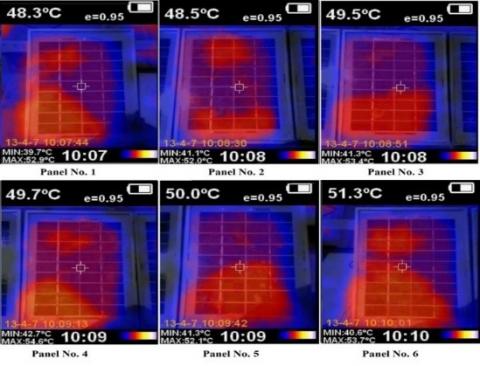
Many factors affect the thermal profile of a photovoltaic cell, including manufacturing defects, dust buildup, soot, dirt, etc. Depending on the thermal conductivity of the photovoltaic panel material, the emission factor of dust or dirt deposited on the photovoltaic panel can reduce (cool) or increase (heat) the photovoltaic module temperature [26]. Figure 9 illustrates the thermal profile of a clean photovoltaic module and a contaminated module after 1 week of exposure to the PV (Figure 9(a)) and a dusty panel after 5 weeks of exposure (Figure 9(b)) to understand and evaluate the effects of dust and soot deposition on the thermal profile.
(a) Thermal photographs of PV panels after 1 week of exposure to the environment
(b) Thermal photographs of PV panels after 5 weeks of exposure to the environment
Figure 9. Thermal photograph of PV panels
Clean PV panels, however, have a higher cooling rate compared to dirty PV panels, according to thermal images obtained. The deposition of dust and dirt spots does not cool photovoltaic panels. Rather, they have negative effects, as dust with or without soot deposited on top easily raises the temperature of the photovoltaic cell, creating hot spots. In addition, as the size of the dust or dirt spots increases, these hot spots become larger. Due to the reduced intensity of incident solar radiation on the top surface of the photovoltaic cell and the increased temperature of the photovoltaic cell, dust deposition with/without soot limits the photovoltaic cell's power production [24].
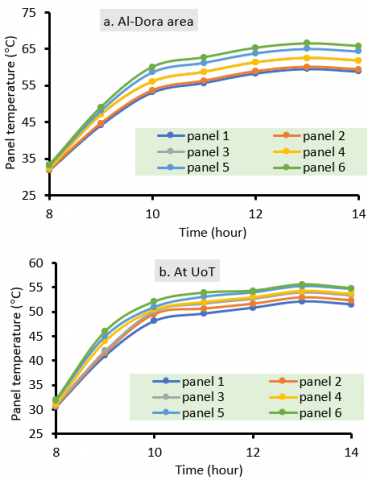
3.4.3 Hourly PV thermal behavior
PV panels are classified according to their thermal performance (clean panels vs. dusty panels) in Figures 10(a) and (b). The temperature of photovoltaic panels decreases when dust concentrations are low. The increased deposition of dust on the top surface of the photovoltaic panel causes the temperature of the photovoltaic panel to increase. The increase in dust accumulation is directly proportional to the increase in panel temperatures. Furthermore, the higher the percentage of soot in the dust (such as in the circulation area) accumulated, the greater the temperature increase, and this rate increases with the increase in the level of dust deposition. The average temperature increase is estimated to be between 0.54℃ and 2℃ depending on the intensity of deposition. As a result, when the surface of the photovoltaic panel becomes dusty and dirty, the temperature increases due to the absorption of solar radiation and its transfer to the lumen by conduction. As the soot forms a high percentage of dust, more solar radiation is absorbed, causing the surface temperature of the panel to increase. The average temperature increases of panels 2, 3, 4, 5, and 6 in the Al-Dora area were 1.05%, 3.12%, 5.12%, 9.07%, and 11.48% compared to panel No. 1, respectively.
Figure 10. Thermal behavior of PV panels during daylight hours
In the case of the University of Technology area, the average increase in the temperature of the panels was 1.07%, 3.04%, 4.5%, 6.5%, and 7.7% compared to panel No. 1, respectively.
It is important to clean the panels periodically to remove dust and dirt accumulated on them. Dust-free or low-soot panels require less periodic cleaning than panels contaminated with dust with a high soot content (as in the case studied). Various literatures, such as Tao et al. [22], Fan et al. [23], and Ghazi and Ip [24], have proven that dust with a high percentage of soot and ash should not be cleaned with water, cloth, or brushes, but it is always preferable to clean it with alcohol or a sodium solution (the latter has proven to be highly effective).
Dusty PV panels (with high soot content) were studied, with a focus on the soot content of dust. Due to the burning of fossil fuels at Al-Dora power stations and refineries, the area south of Baghdad has high soot particle content. Experiments were conducted at two sites, the first being Al-Dora, where pollution levels from exhaust gas emissions from refineries and power plants are very high. The second site was the University of Technology in eastern Baghdad, which is about ten kilometers away from Al-Dora area. Five weeks of experiments began on March 1, 2023. Dust accumulation, particle type, and their effects on power generation were studied. The density and distribution of deposits on PV panels result in an inhomogeneous distribution of solar light. This irregular scattering increases the temperature of PV panels, resulting in hot spots. When soot accumulates on the top face of a PV cell, it becomes hotter.
Experimental measurement results showed a significant increase in TSP concentrations of 111.87% in the air of the Al-Dora area compared to the University of Technology. The panels exposed to outdoor conditions in Al-Dora for one, two, three, four, and five weeks experienced an average decrease in output power of 9%, 17%, 23%, 29%, and 34%, respectively. In contrast, the modules' power degradation rate in the area of the University of Technology was 3.3%, 5.9%, 10.8%, 16.37%, and 19.57%, respectively. The total accumulated dust and pollution quantities for the Al-Dora area were 3.67, 11.43, 40.04, 76.76, and 138. 85 g/m2 for modules 2, 3, 4, 5, and 6, respectively. At the same time, the total accumulated dust and pollution quantities for the University of Technology area were 1.57, 8.67, 16.75, 34.7, and 76.22 g/m2, respectively. Air pollution in the Dora area can reduce the capacity of photovoltaic cells by more than 50% due to frequent dust storms over Baghdad Governorate.
To maintain high energy production efficiency, photovoltaic panels require continuous cleaning, so smart cleaning techniques are needed. It is still necessary to study the soot levels in dust throughout the year in the study area. It is also necessary to measure the accumulation levels annually to determine the logical cleaning method and cleaning intervals.
The authors would like to thank the staff of the Electromechanical Engineering Dept., University of Technology- Iraq, for supporting the experiment work of the study.
[1] Krishnan, N., Kumar, K.R., Inda, C.S. (2023). How solar radiation forecasting impacts the utilization of solar energy: A critical review. Journal of Cleaner Production, 388: 135860. https://doi.org/10.1016/j.jclepro.2023.135860
[2] Tiwari, G.N., Mishra, R.K., Solanki, S.C. (2011). Photovoltaic modules and their applications: A review on thermal modeling. Applied Energy, 88: 2287-2304. https://doi.org/10.1016/j.apenergy.2011.01.005
[3] Rao, R.R., Mani, M., Ramamurthy, P.C. (2018). An updated review on factors and their inter-linked influences on photovoltaic system performance. Heliyon, 4: e00815. https://doi.org/10.1016/j.heliyon.2018.e00815
[4] Rodrigues, A.V., de Souza, D.A.R., Garcia, F.D.R., Ribeiro, S.J.L. (2022). Renewable energy for a green future: Electricity produced from efficient luminescent solar concentrators. Solar Energy Advances, 2: 1-13. https://doi.org/10.1016/j.seja.2022.100013
[5] Salimi, H., Ashtiani, A.D., Lavasani, M., Fazaeli, R. (2024). Experimental analysis and modeling of weather condition effects on photovoltaic systems' performance: Tehran case study. Energy Sources, Part A: Recovery, Utilization, and Environmental Effects, 46(1): 8430-8442. https://doi.org/10.1080/15567036.2020.1765902
[6] Christopher, S., Vikram, M.P., Bakli, C., Thakur, A.K., Ma, Y., Ma, Z., Xu, H., Cuce, P.M., Cuce, E., Singh, P. (2023). Renewable energy potential towards attainment of net-zero energy buildings status - A critical review. Journal of Cleaner Production, 405: 136942. https://doi.org/10.1016/j.jclepro.2023.136942
[7] Fan, S., He, M., Zhang, Z. (2023). Daily prediction method of dust accumulation on photovoltaic (PV) panels using echo state networks with delay output. Applied Soft Computing, 144: 110528. https://doi.org/10.1016/j.asoc.2023.110528
[8] Yao, W., Han, X., Huang, Y., Zheng, Z., Wang, Y., Wang, X. (2022). Analysis of the influencing factors of the dust on the surface of photovoltaic panels and its weakening law to solar radiation—A case study of Tianjin. Energy, 256: 124669. https://doi.org/10.1016/j.energy.2022.124669
[9] Kazem, H.A., Chaichan, M.T., Al-Waeli, A.H., Sopian, K. (2020). A novel model and experimental validation of dust impact on grid-connected photovoltaic system performance in Northern Oman. Solar Energy, 206: 564-578. https://doi.org/10.1016/j.solener.2020.06.043
[10] Jasim, Q.K. (2022). Effect of the different types of dust on the performance of photovoltaic panels in Iraq. Journal of Advanced Research in Fluid Mechanics and Thermal Sciences, 100(3): 1-10. https://doi.org/10.37934/arfmts.100.3.110
[11] Hashim, E.T., Hussien, T.A. (2016). Dust effect on the efficiency of silicon mono crystalline solar modules at different tilt angles at Al-Jadryia climate conditions. Journal of Engineering, 22(2): 56-73.
[12] de Souza, J.S., de Carvalho, M.P.C., Barroso, G.C. (2023). Analysis of the characteristics and effects of soiling natural accumulation on photovoltaic systems: A systematic review of the literature. Journal of Solar Energy Engineering, 145(4): 040801. https://doi.org/10.1115/1.4056453
[13] Vedulla, G., Geetha, A., Senthil, R. (2023). Review of strategies to mitigate dust deposition on solar photovoltaic systems. Energies, 16(1): 1-29. https://doi.org/10.3390/en16010109
[14] Hachicha, A.A., Al-Sawafta, I., Said, Z. (2019). Impact of dust on the performance of solar photovoltaic (PV) systems under United Arab Emirates weather conditions. Renewable Energy, 141: 287-297. https://doi.org/10.1016/j.renene.2019.04.004
[15] Sisodia, A.K., Mathur, R.K. (2019). Impact of bird dropping deposition on solar photovoltaic module performance: A systematic study in Western Rajasthan. Environmental Science and Pollution Research, 26(30): 31119-31132. https://doi.org/10.1007/s11356-019-06100-2
[16] Kazem, H.A., Chaichan, M.T., Al-Waeli, A.H., Sopian, K. (2020). Evaluation of aging and performance of grid-connected photovoltaic system northern Oman: Seven years' experimental study. Solar Energy, 207: 1247-1258.
[17] Fatima, K., Minai, A.F., Malik, H., Márquez, F.P.G. (2024). Experimental analysis of dust composition impact on photovoltaic panel performance: A case study. Solar Energy, 267: 112206. https://doi.org/10.1016/j.solener.2023.112206
[18] Kazem, H.A., Chaichan, M.T., Al-Waeli, A.H., Al-Badi, R., Fayad, M.A., Gholami, A. (2022). Dust impact on photovoltaic/thermal system in harsh weather conditions. Solar Energy, 245: 308-321. https://doi.org/10.1016/j.solener.2022.09.012
[19] Awadh, S.M. (2023). Impact of North African sand and dust storms on the Middle East using Iraq as an example: Causes, sources, and mitigation. Atmosphere, 14(1): 180. https://doi.org/10.3390/atmos14010180
[20] Al-Hameedi, W.M.M., Chen, J., Faichia, C., Al-Shaibah, B., Nath, B., Kafy, A.A., Hu, G., Al-Aizari, A. (2021). Remote sensing-based urban sprawl modeling using multilayer perceptron neural network Markov chain in Baghdad, Iraq. Remote Sensing, 13(20): 1-26. https://doi.org/10.3390/rs13204034
[21] Ahmed, S.M., Al-Ramahi, F.K.M. (2022). Evaluate the effect of relative humidity in the atmosphere of Baghdad City urban expansion using remote sensing data. Iraqi Journal of Science, 63(4): 1848-1859. https://doi.org/10.24996/ijs.2022.63.4.41
[22] Tao, H., Hashim, B.M., Heddam, S., Goliatt, L., Tan, M.L., Sa'adi, Z., Ahmadianfar, I., Falah, M.W., Halder, B., Yaseen, Z.M. (2023). Megacities' environmental assessment for Iraq region using satellite image and geospatial tools. Environmental Science and Pollution Research, 30(11): 30984-31034. https://doi.org/10.1007/s11356-022-24153-8
[23] Fan, S., Wang, Y., Cao, S., Sun, T., Liu, P. (2021). A novel method for analyzing the effect of dust accumulation on energy efficiency loss in photovoltaic (PV) system. Energy, 234: 121112. https://doi.org/10.1016/j.energy.2021.121112
[24] Ghazi, S., Ip, K. (2014). The effect of weather conditions on the efficiency of PV panels in the southeast of UK. Renewable Energy, 69: 50-59. https://doi.org/10.1016/j.renene.2014.03.018
[25] Al-Kayiem, H.H., Tukkee, A.M., See, Y.K. (2024). Experimental assessment of a solar vortex engine integrated with sensible TES at different collector configurations. Renewable Energy, 227: 120539. https://doi.org/10.1016/j.renene.2024.120539
[26] Mohtar, H., Chesse, P., Chalet, D. (2012). Describing uncertainties encountered during laboratory turbocharger compressor tests. Experimental Techniques, 36: 53-61. https://doi.org/10.1111/j.1747-1567.2011.00734.x