Tanu Rizvi*![]() | Satya Prakash Dubey
| Satya Prakash Dubey![]() | Nagendra Tripathi
| Nagendra Tripathi![]() | S. P. Makhija | Mahesh Singh
| S. P. Makhija | Mahesh Singh![]() | Mangal Singh
| Mangal Singh![]()
© 2024 The authors. This article is published by IIETA and is licensed under the CC BY 4.0 license (http://creativecommons.org/licenses/by/4.0/).
OPEN ACCESS
This study presents a novel generation theory based on FSPV system together with grid integration in Chhattisgarh state. In this study four regions mainly two industries and two local loads have been chosen to evaluate the results. There is availability of nearby water sources at the selected sites. The technical, economical and environmental aspects of a proposed FSPV-grid tied system is analyzed in the same selected regions of Chhattisgarh and the results are compared with an existing grid-only system. The entire system of four major sites in the state are simulated using HOMER energy, powered by the National Renewable Energy Laboratory (NREL), United States. At the moment, all of the selected systems are powered by the grid-only system, and data has been collected for the same. The results of HOMER energy are further classified based on economic parameters such as NPC, LCOE, operating cost, system cost and paybacks. The second category includes technical parameters such as production proportion whereas, the third category includes environmental parameters of pollutants and water saving. The obtained results show that the FSPV-grid system as compared to grid-only system's NPC is reduced to 27%, 7.03%, 10.76%, 12.13%, LCOE is reduced to 69%, 27.8%, 44%, 44.6%, with paybacks of 10.11 years, 12.28 years, 11.99 years, and 12.21 years and IRRs of 8.8%, 7.7%, 8%, 7.7% respectively by following the production proportions of 77.7% and 22.3%, 54.2% and 45.8%, 65.2% and 34.8%, and 65% and 35% from FSPV and grid system, Also, CO2 emissions were reduced by 44.6%, 38.06%, 40.62%, and 41.23% compared to the grid-only system for all four selected sites in this study, which can help the attached industries and local loads gain carbon credit points.
Floating Solar Photovoltaic (FSPV), grid, Levelized Cost of Energy (LCOE), Net Present Cost (NPC), carbon dioxide (CO2) emission
This study presents a novel generation theory based on FSPV system together with grid integration in Chhattisgarh state. In this study four regions mainly two industries and two local loads have been chosen to evaluate the results. There is availability of nearby water sources at the selected sites. The technical, economical and environmental aspects of a proposed FSPV-grid tied system is analyzed in the same selected regions of Chhattisgarh and the results are compared with an existing grid-only system [1]. The entire system of four major sites in the state are simulated using HOMER energy, powered by the National Renewable Energy Laboratory (NREL), United States. At the moment, all of the selected systems are powered by the grid-only system, and data has been collected for the same [2-4]. The results of HOMER energy are further classified based on economic parameters such as NPC, LCOE, operating cost, system cost and paybacks. The second category includes technical parameters such as production proportion whereas, the third category includes environmental parameters of pollutants and water saving. The obtained results show that the FSPV-grid system as compared to grid-only system's NPC is reduced to 27%, 7.03%, 10.76%, 12.13%, LCOE is reduced to 69%, 27.8%, 44%, 44.6%, with paybacks of 10.11 years, 12.28 years, 11.99 years, and 12.21 years and IRRs of 8.8%, 7.7%, 8%, 7.7% respectively by following the production proportions of 77.7% and 22.3%, 54.2% and 45.8%, 65.2% and 34.8%, and 65% and 35% from FSPV and grid system, Also, CO2 emissions were reduced by 44.6%, 38.06%, 40.62%, and 41.23% compared to the grid-only system for all four selected sites in this study, which can help the attached industries and local loads gain carbon credit points.
This section discusses the findings of research on the evolvement of FSPV systems as proposed by numerous scientists and power engineers around the world. The contrast between ground-mounted PV and FSPV systems has also been highlighted.
Firstly, proposed FSPV system is Aichi, Japan (2007) with a capacity of 20kW.Soon after which many systems have been built around the world [5]. FSPV system costs more than conventional land-based PV systems. Here the author studied the system used by Spain to use 7% of its water surface for agricultural purposes, and the results were compared to compare the overall cost difference of both systems [6]. However, the system performance of a stand-alone FSPV system supplying power to loads with a battery as energy storage is analyzed and FSPV is compared with ground PV in terms of efficiency. Higher efficiencies have been achieved in case of FSPV system as the cell temperature is maintained in optimum condition [7]. There are potential advantages of FSPV systems over conventional land-based PV systems [8].
It should be noted that the need for floaters, structures, and mooring systems results in an increase in costs. To withstand changes in water level, the material chosen to float the FSPV system should have a high mechanical strength [9]. The reduced weight rather than strong mechanical structures are key advantages of FSPV systems. With these types of mechanical systems, the overall weight of floating platform can be reduced making the system more economical and simpler to use [10].
High density polyethylene can be employed as floating structures due to its benefit of being lighter in weight and more affordable. The feasibility, longevity, robustness, and other qualities of these materials made them to be used as floaters [11].
Also, a decision-making hybrid FSPV systems has significant potential for FSPV system operational benefits for future existing or planned systems [12].
An artificial intelligence-based system driven by FSPV for promoting the energy scenario using the Grasshopper Algorithm optimization technique can also be used to maximize the FSPV output. Sufficiently improved benefits have been observed in water storage, food production and output respectively, with varying tilt angle during summer and winter [13]. FSPV system architecture can also be employed for steel industry with economic expediency and reduced pollutant emission with the lowest cost of energy, capital cost and reduced pollutant emissions [14-19].
The purpose of this article is to evaluate and analyze commercially available technical solutions for FSPV system from a sustainability perspective, including the technical, environmental, and economic parameters. A total of four locations in Chhattisgarh have been targeted for proposed floating solar PV grid-integrated systems. This section includes the four selected sites with their geographical location and its data as received from the officials as indicated in Table 1. The demand requirement and modeling with the study being carried out for fiscal year 2021-2022. The data of load profile has been collected from the officials and engineers of the selected locations which then were utilized as input to the load in the above modeling of HOMER energy software. The other software inputs include solar irradiance resources, FSPV sizing, converter sizing and grid inputs. However here authors have referred the technical reports of installed FSPV system as obtained by the sources for better comparison.
Table 1. Selected sites and their location
|
Parameter |
BSP |
JSPL |
Korba Township Area |
Dhamtari Guest House |
|
Latitude |
21°10.7N |
21.9245° N |
22°35N |
20.6167°N |
|
Longitude |
81°23.4E |
83.3472° E |
82°68E |
81.5697°E |
|
Height above Sea Level |
319m |
215m |
252m |
317m |
Table 2. Load demand of all four mentioned sites
|
S. No. |
Site |
Average Load (kWhr/day) |
Average Load (kW) |
Peak Load (kW) |
Load Factor |
|
1 |
BSP (Oxy Plant) |
1903.9 |
79.33 |
159.75 |
0.5 |
|
BSP (Plant Operations) |
7414.8 |
308.95 |
611.46 |
0.51 |
|
|
2 |
JSPL (Plant Operations) |
5722 |
238.42 |
467.51 |
0.51 |
|
3 |
Korba Township Area |
776.58 |
32.36 |
70.24 |
0.46 |
|
4 |
Dhamtari Guest House |
857.49 |
35.73 |
79.01 |
0.45 |
3.1 Site selection
The authors have divided the sites in two main categories. Table 2 shows the location of sites. Here the sites are divided into two categories: the first category consists of industries that are close to water bodies and the second category is made up of nearby local communities. The selected sites include:
3.1.1 Bhilai Steel Plant (BSP)
BSP is a steel-producing industry, which is located in Bhilai. It has two reservoirs namely Maroda Tank-1 and Maroda Tank-2 that are lying idle and significant around but could be used to generate FSPV in a useful way. To meet its demand, the plant nevertheless purchases electricity from the NSPCL grid. Here, the study has been done taken into account the two sections: oxygen plant (BSP Oxy Plant) and the various plant operations section (BSP Plant Operations). For research purposes, the information for the aforementioned sections and reservoirs was obtained from the officials. The load demand for the same has been mentioned in Figure 1 and Table 2.
3.1.2 Jindal Steel and Power Limited (JSPL)
The largest sponge iron plant is owned by JSPL, which also operates in the mining, power, and infrastructure sectors. The section JSPL Plant Operations has been selected as load. The plant is close to Rabo dam that can be used for the installation of the FSPV-grid-integrated system that has been proposed. The load demand for the same has been mentioned in Figure 1 and Table 2.
3.1.3 Korba Township Area
Hasdeo River is where the Hasdeo-Bango dam is located. It is the largest and longest dam in the state and is used in several hydropower generation projects. However, its surface can be used to generate enough from FSPV to meet the needs of a nearby Township area in Korba. Here the data of Township has been taken for the evaluation of FSPV-grid tied system. The load demand for the same has been mentioned in Figure 1 and Table 2.
(a)
(b)
(c)
(d)
(e)
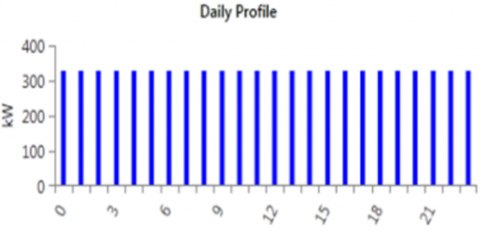
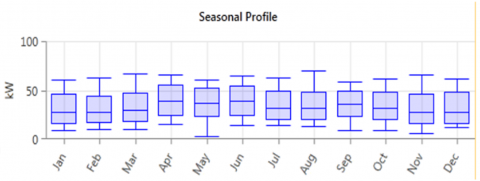
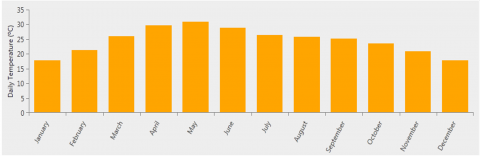
Figure 1. Demand profile of (a) BSP Oxy Plant, (b) BSP Plant Operations, (c) JSPL Plant Operations, (d) Korba Township Area and (e) Dhamtari Guest House
3.1.4 Dhamtari Guest House
A popular destination for tourists is the Gangrel or Ravishankar dam, which is situated in Dhamtari. In the nearby guest houses of the dam, the demand for electricity is fulfilled by the electricity board. Since this dam is also involved in hydroelectric projects, its surface can be used for FSPV generation to meet local residents' needs. The load demand for the same has been mentioned in Figure 1. Also, Table 2 concludes the demand side profile of all four sites under consideration.
3.2 Demand profile
Figure 1 shows the daily and seasonal demand profile for the selected sites and Table 3 provides information about the average load, peak load and load factor of all above mentioned sites. It has been observed that for all sites the overall the load factor is between 0.45 to 0.51 respectively. The minimum average load is observed for Korba Township Area and maximum load is observed for BSP plant operations.
Table 3. Solar irradiance data of all four mentioned sites
|
S.No. |
Site |
Annual Average Irradiance (kWhr/m2/day) |
Annual Average Temperature (°C) |
Maximum Average Temperature (°C) |
|
1 |
BSP Subsections |
5.06 |
26.12 |
35.710 |
|
2 |
JSPL Plant Operations |
4.93 |
24.43 |
30.860 |
|
3 |
Korba Township Area |
4.93 |
24.53 |
31.570 |
|
4 |
Dhamtari Guest House |
5.06 |
24.53 |
30.490 |
3.3 Solar resources
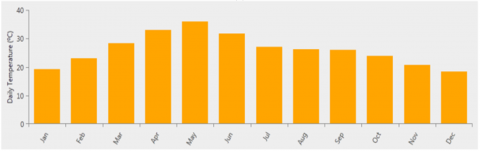
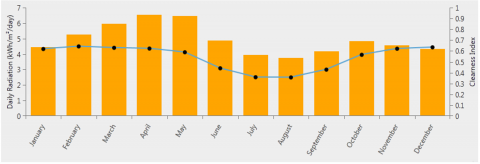
The availability of solar radiation is the most important factor in FSPV generation. Chhattisgarh, being a state where the Tropic of Cancer passes from Ambikapur, has a lot of solar resources. However, the data on solar irradiance varies with the selected locations. Here, Table 3 provides information about the solar irradiance data of all above mentioned sites and Figure 2 shows the availability of month wise solar radiation as fetched from NASA Power: World Wide Prediction of Energy Resources. The study has been carried out for fiscal year 2021-2022. It has been observed that for all sites the overall the load factor is between 0.45 to 0.51 respectively. The minimum average load is observed for Korba Township Area and maximum load is observed for BSP Plant Operations.
(a)
(b)
(c)
(d)
(e)
(f)
(g)
(h)
Figure 2. Solar Irradiance and temperature data of (a) (b) BSP Subsections (c) (d) JSPL Plant Operations (e) (f) Korba Township Area (g) (h) Dhamtari Guest House
3.4 Modeling in homer energy software
The modeling of all the above mentioned four sites has been shown in Figure 3 respectively.
(a)
(b)
(c)
(d)
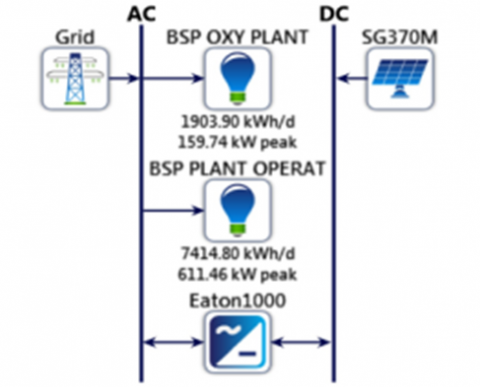
Figure 3. Modeling of (a) BSP Subsections, (b) JSPL Plant Operations, (c) Korba Township Area and (d) Dhamtari Guest House
The system architecture of all four of the above-mentioned sites has been shown in Figure 3(a-d) respectively. It has a discount rate of 8% with an inflation rate of 2%, and the overall project life is 25 years.
System architecture defines system configuration, component combinations for the system, size, and strategy, which all together define the working of the whole system over its entire life period [20-21].
The simulation process serves two purposes: one is to determine the feasibility of the defined system, which satisfies the required load with other imposed constraints, and the other is to estimate the overall cost of the system’s life, which consists of operating cost, maintenance cost, and installation cost. The most practical parameter to compare system investments is life cycle cost [22]. A time series of year-by-year simulations of the entire system's operation is included in the system configuration for HOMER energy [23-25].
Figure 3 depicts the modeling of an FSPV-grid-tied system in HOMER energy software for BSP Subsections, JSPL Plant Operations, Korba Township Area, and Dhamtari Guest House. The FSPV system used here is a Peimar SG370M with Eaton 1000 and Leonics 680 converters. The data of load profile has been collected from the officials and engineers of the selected locations which then were utilized as input to the load in the above modeling. The load is modeled with FSPV and grid in order to achieve the lowest NPC and LCOE system while maintaining the proportion of FSPV and grid system. The obtained results are further analyzed in various technical and economic aspects.
With the availability of various renewable energy options, HOMER Energy is specialized software for designing, simulating, and optimizing any on grid or off grid system with distributed generation [26-29].
NPC represents the final cost after accounting for any potential discounts. Its total cost of involvement includes fuel costs, maintenance costs, component costs, initial costs, and operating costs [30-31]. With salvage value and the sale of power back to the grid, NPC reduces However, the government imposes fine when pollutant emissions are inexplicable, and this is additionally covered by the NPC. IRR is the discount rate at which the NPCs for the existing grid-only system and the proposed floating solar PV-grid integrated system are equal [32-34]. In this instance, HOMER Energy determines the discount rate that corresponds to the present value of the disparity between the two cash flow sequences in order to calculate the IRR.
The payback period is the amount of time needed for the cumulative cash flow of the proposed floating solar PV-grid integrated system difference from the existing grid-only system to become positive [35-37]. It shows how long it will take to make up the investment cost difference between the suggested and existing systems. The simple payback point is where the nominal cash flow difference line intersects zero. The intersection of the discounted cash flow difference line and zero is where the discounted payback is found.
Pollutants such as particulate matter, hydrocarbons, nitrogen dioxide, sulphur dioxide, and carbon dioxide are expressed in kilogrammes per year and come from generators employed for the production of electrical energy, Boilers employed for the production of thermal energy and Grid electricity consumption.
The results of HOMER energy are further classified based on economic parameters such as NPC, LCOE, operating cost, system cost and paybacks. The second category includes technical parameters such as production proportion whereas, the third category includes environmental parameters of pollutants and water saving. Figure 4 depicts a step-by-step research flowchart for analyzing the obtained results. It shows the clear stage by stage result analysis of the results obtained from the simulations of all four sites under consideration with HOMER energy software.
Figure 4. Research flowchart
4.1 Economic parameters
This study of economic parameters includes NPC, LCOE, and system operating costs. They are further explained in the points below.
4.1.1 NPC, LCOE and operating cost
NPC provides the total cost over system lifetime including the revenues according to present value for same lifetime, whereas, LCOE provides the information about the average cost produced by the system per kWh. NPC for proposed FSPV-grid tied system for BSP Subsections, JSPL Plant Operations, Korba township and Dhamtari Guest House as obtained by HOMER energy is \$3,211,169, \$2,512,711, \$355,516 and \$326,974 respectively as shown in Figure 5.
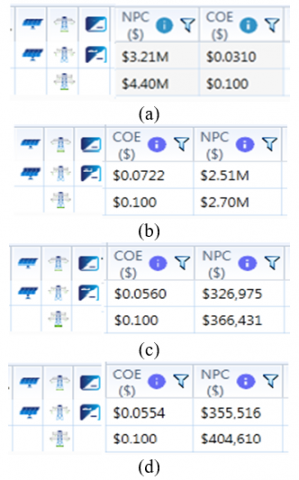
Figure 5. Screenshot of HOMER energy for NPC, LCOE and operating cost of FSPV-grid tied system of (a) BSP Subsections, (b) JSPL Plant Operations, (c) Korba Township Area, (d) Dhamtari Guest House
Similarly, the LCOE is \$0.0398, \$0.07222, \$0.05540 and \$0.05597 with operating cost \$51,184,99, \$110,207.7, \$9,060.21, \$8,284.92. It is evident from Table 4 and Figure 5. that overall NPC reduces to a maximum of 27.045% in case of BSP and LCOE reduces maximum in case of Dhamtari Guest House which is 44.6%. However as seen from Figure 6, it is clear that both NPC and LCOE are reduced in case of FSPV-grid tied system as compared to existing grid only systems in selected urban locations of Chhattisgarh. The major aim behind the research is to obtain lowest NPC and LCOE system that can be feasible with the loads near water bodies.
Table 4. Percentage reduction in NPC and LCOE of FSPV-grid tied system as compared to existing grid only system for all four selected sites
|
S.No. |
Site |
Reduction in NPC (%) |
Reduction in LCOE (%) |
|
1 |
BSP Subsections |
27.045 |
69 |
|
2 |
JSPL Plant Operations |
7.037 |
27.8 |
|
3 |
Korba Township Area |
10.7676 |
44 |
|
4 |
Dhamtari Guest House |
12.1336 |
44.6 |
Figure 6. Screenshot of HOMER energy for NPC, LCOE for FSPV-grid tied and grid only systems of (a) BSP Subsections, (b) JSPL Plant Operations, (c) Korba Township Area, (d) Dhamtari Guest House
4.1.2 System cost
The total FSPV-grid tied cost includes all components of the FSPV system, converter, and grid. Figure 7 represents the cost of FSPV, converter, and grid as obtained by HOMER energy results. The calculations depend upon the base value of capital cost, operating cost, operation and maintenance cost of single FSPV panel, converter or per unit energy purchased and sold back to grid. For BSP Subsections FSPV-grid tied system, the total cost is \$3,211,168.79, which includes the cost of FSPV \$2,939,725.55, converter \$826,200, and grid \$554,756.76. The total cost of the JSPL Plant Operations FSPV-grid tied system is \$2,512,711.33, which includes the cost of the FSPV (\$984,784.12), the converter (\$634,917.33), and the grid (\$893,010.08). The total cost of the Korba Township Area FSPV-grid tied system is \$326,974.49, which includes the FSPV cost of \$199,754.08, the converter cost of \$127,341.87, and the grid cost of \$121.45. The total cost of the Dhamtari Guest House FSPV-grid tied system is \$355,516.28, which includes the FSPV cost of \$215,760.35, the converter cost of \$139,134.71, and the grid cost of \$621.22. As can be seen from the data above and Figure 5, the system relies more on the proposed FSPV-grid tied system than the grid only system in order to maintain the lowest COE.
Table 5. Compare economics of selected sites
|
System |
Present Worth ($) |
Annual Worth ($/yr) |
RoI (%) |
IRR (%) |
Simple Payback (Years) |
Discounted Payback (Years) |
|
BSP Subsections |
1 185, 901 |
91, 735 |
6.4 |
8.8 |
10.11 |
15.81 |
|
JSPL Plant Operations |
187,248 |
14,484 |
5.2 |
7.7 |
12.28 |
18.07 |
|
Korba Township Area |
39,456 |
3,052 |
5.3 |
7.7 |
12.21 |
17.92 |
|
Dhamtari Guest House |
49.093 |
3.798 |
5.5 |
8.0 |
11.99 |
17.35 |
(a)
(b)
(c)
(d)
Figure 7. Screenshot of HOMER energy for system cost of FSPV-grid tied system of (a) BSP Subsections, (b) JSPL Plant Operations, (c) Korba Township Area, (d) Dhamtari Guest House
Figure 7 represents the cost of FSPV, converter, and grid as obtained by HOMER energy results. The calculations depend upon the base value of capital cost, operating cost, operation and maintenance cost of single FSPV panel, converter or per unit energy purchased and sold back to grid.
For BSP Subsections FSPV-grid tied system, the total cost is \$3,211,168.79, which includes the cost of FSPV \$2,939,725.55, converter \$826,200, and grid \$554,756.76. The total cost of the JSPL Plant Operations FSPV-grid tied system is \$2,512,711.33, which includes the cost of the FSPV (\$984,784.12), the converter (\$634,917.33), and the grid (\$893,010.08). The total cost of the Korba Township Area FSPV-grid tied system is \$326,974.49, which includes the FSPV cost of \$199,754.08, the converter cost of \$127,341.87, and the grid cost of \$121.45. The total cost of the Dhamtari Guest House FSPV-grid tied system is \$355,516.28, which includes the FSPV cost of \$215,760.35, the converter cost of \$139,134.71, and the grid cost of \$621.22. As can be seen from the data above and Figure 5, the system relies more on the proposed FSPV-grid tied system than the grid only system in order to maintain the lowest COE.
4.1.3 Other costs and paybacks
The payback period is the number of years required to recover project funds. We do not consider the time value of money when calculating the payback period. The discounted payback period is the number of years after the initial investment is covered by the cumulative discounted cash inflows. This is because the discounted payback period is calculated using the present value of future cash inflows. As a result, based on this criterion, it will take longer to recover the initial investment.
Here RoI is 6.4%, 5.2%, 5.5% and 5.3% for all the four sites defined and similarly the IRR is 8.8%,7,7%,8.0%,7%, 7% respectively in all above-mentioned sites. The simple payback is minimum in case of BSP FSPV-grid tied system and is 10 years whereas it is 12.28, 11.99 and 12.21 years in case of all other three sites. Table 5 shows the same.
4.2 Technical parameter
In this study production proportion is considered as one of technical parameter for evaluation of results obtained from HOMER energy.
4.2.1 Production proportion
The total amount of electrical energy produced annually by the renewable components of the power system is referred to as renewable electrical production. It is the sum of the electrical energy generated by the PV array, wind turbines, and hydro system, plus the portion of the electrical energy generated by each generator derived from biomass. This variable is used by HOMER to calculate the renewable fraction, renewable percentage, thermal production from renewable resources and electrical total production.
Figure 8. Screenshot of HOMER energy for production proportion of FSPV-grid tied system for (a) BSP, (b) JSPL, (c) Korba Township, (d) Dhamtari Guest House
As shown in Figure 8, for BSP Subsections FSPV-grid tied system, the total production as optimized by HOMER energy is 77.7% from FSPV system and 22.3% from grid system. The total production as optimized by HOMER energy for JSPL Plant Operations FSPV-grid tied system is 54.2% from FSPV system and 45.8% from grid system. The total production as optimized by HOMER energy for Korba Township Area FSPV-grid tied system is 65.2% from FSPV system and 34.8% from grid system. The total production as optimized by HOMER energy for Dhamtari Guest House FSPV-grid tied system is 65% from FSPV system and 35% from grid system.
4.3 Environmental parameters
These parameters include pollutants as well as water savings due to evaporation loss.
4.3.1 Pollutant
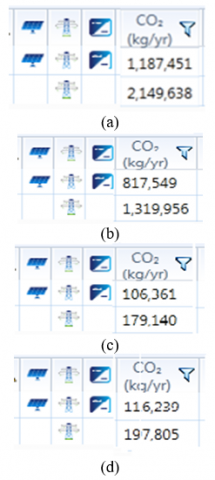
The pollutants are emitted as a result of the following processes: generation of electricity, generation of thermal energy by a boiler, and consumption of grid electricity. Because both consume fuel with known properties, HOMER models the emissions of the generators and the boiler in a similar manner. It has a slightly different grid model. The sections that follow explain how HOMER calculates emissions from generators and boilers, as well as emissions from the grid. As shown in Table 6 and Figure 9, the percentage CO2 reduction in the case of BSP is as high as 44.76%. This reduction has a significant impact on obtaining carbon credit points from the federal and state governments.
Figure 9. Screenshot of HOMER energy for pollutant emission of FSPV-grid tied system for (a) BSP, (b) JSPL, (c) Korba Township and (d) Dhamtari Guest House
Table 6. Percentage reduction in CO2 for FSPV- grid tied system as compared to existing grid only system for all four selected sites
|
S.No. |
Site |
Reduction in CO2 Concentration (%) |
|
1 |
BSP Subsections |
44.76 |
|
2 |
JSPL Plant Operations |
38.06 |
|
3 |
Korba tTownship Area |
40.62 |
|
4 |
Dhamtari Guest House |
41.23 |
4.3.2 Water saving
The major amount of water lost is through evaporation which is heavily influenced by local climate conditions. Losses due to evaporation can be reduced by low air temperatures, high humidity, rainfall, and cloud cover. The surface area of the water also affects evaporation and hence FSPV systems play a major role here. According to various experts in domain of floating solar systems, a conservative estimate of 1250 million liters/year of water can be saved using FSPV per sq. km of reservoir surface area covered.
As shown in Table 7, implementing an FSPV system can save a minimum of 175.212 million liters/year/square kilometers of water. This figure, however, can be increased by providing maximum coverage with FSPV systems. Various experts believe that a minimum of 20% and a maximum of 80% FSPV coverage are feasible.
Table 7. Water saving calculation
|
S.No. |
Site |
Optimized FSPV Rating (kW) |
Area Required (Sq. Km) |
Water Saving (Million Liters/Year/Sq. Km) |
|
1 |
BSP Subsections |
4185 |
.1046 |
130.75 |
|
2 |
JSPL Plant Operations |
1000 |
.025 |
31.25 |
|
3 |
Korba Township Area |
203 |
0.0051 |
6.375 |
|
4 |
Dhamtari Guest House |
219 |
0.00547 |
6.837 |
This study was conducted to determine the feasibility of the proposed FSPV-grid tied system over the grid only system in Chhattisgarh's urban areas. The study was conducted at four locations in the state with nearby water bodies using simulations in HOMER energy software. The study's parameters include various economic, technical, and environmental parameters, which are further subdivided into NPC, LCOE, operating cost, system cost, production proportion, CO2 emission, and water savings through evaporation loss. The following conclusions have been made from the study:
The obtained results show that the system's NPC is reduced to 27%, 7.03%, 10.76%, 12.13%, and the LCOE is reduced to 69%, 27.8%, 44%, 44.6%, with paybacks of 10.11 years, 12.28 years, 11.99 years, 12.21 years and IRRs of 8.8%, 7.7%, 8%, 7.7% by following the system configurations of 7% + 22.3% for BSP subsections, 54.2% + 45.8% for JSPL plant operations, 65% + 35% for Korba Township Area, and 65.2% + 44.8% for Dhamtari Guest House of floating solar PV and grid to achieve the best feasible system combination with zero unmet electric load and zero capacity shortage.
CO2 emissions were also reduced by 44.6%, 38.06%, 40.62%, and 41.23% compared to the grid-only system for all four selected sites in this research.
It is evident that a total of 130.78 million liters per year of water can be saved in the reservoirs of BSP by implementing floating solar PV grid systems only in Areas of 0.104625 sq km of either reservoir surface. Similarly, 31.25, 6.34375, and 7.1875 million liters/year of water can be saved in the case of Rabo Dam, Hasdeo-Bango Dam, and Gangrel Dam by utilizing such a small calculated Area of water body to fulfill the requirements of industry, Township Areas, and Guest houses. This parameter of water saving and Area requirement is not applicable in second case.
At last, it can be concluded that all of the aforementioned sites have a high potential to adopt FSPV-grid tied systems and contribute to the government's national solar mission. Floating solar PV systems provide additional advantages and environmental issues when contrast with ground-mounted systems, as presented in this research.
[1] Bakar, M.S.A., Nandong, J. (2019). Technoeconomic analysis of floating solar field for 1 GWh of electricity generation. IOP Publishing, 495(1): 012064. https://doi.org/10.1088/1757-899X/495/1/012064
[2] Liu, L., Wang, Q., Lin, H., Li, H., Sun, Q. (2017). Power generation efficiency and prospects of floating photovoltaic systems. Energy Procedia, 105: 1136-1142. https://doi.org/10.1016/j.egypro.2017.03.483
[3] Makhija, S.P., Dubey, S.P. (2017). Optimally sized hybrid energy system for auxiliaries of a cement manufacturing unit with diesel fuel price sensitivity analysis. International Journal of Ambient Energy, 38(3): 267-272. https://doi.org/10.1080/01430750.2015.1086680
[4] Cazzaniga, R., Cicu, M., Rosa-Clot, M., Rosa-Clot, P., Tina, G.M., Ventura, C. (2018). Floating photovoltaic plants: Performance analysis and design solutions. Renewable and Sustainable Energy Reviews, 81: 1730-1741. https://doi.org/10.1016/j.rser.2017.05.269
[5] Rodrigues, I.S., Ramalho, G.L.B., Medeiros, P.H.A. (2020). Potential of floating photovoltaic plant in a tropical reservoir in Brazil. Journal of Environmental Planning and Management, 63(13): 2334-2356. https://doi.org/10.1080/09640568.2020.1719824
[6] Yashas, V., Aman, B., Dhanush, S. (2021). Feasibility study of floating solar panels over lakes in Bengaluru City, India. In Proceedings of the Institution of Civil Engineers-Smart Infrastructure and Construction, 174(1): 1-10. https://doi.org/10.1680/jsmic.21.00002a
[7] Mayville, P., Patil, N.V., Pearce, J.M. (2020). Distributed manufacturing of after market flexible floating photovoltaic modules. Sustainable Energy Technologies and Assessments, 42: 100830. https://doi.org/10.1016/j.seta.2020.100830
[8] Zhou, Y., Chang, F.J., Chang, L.C., Lee, W.D., Huang, A., Xu, C.Y., Guo, S. (2020). An advanced complementary scheme of floating photovoltaic and hydropower generation flourishing water-food-energy nexus synergies. Applied Energy, 275: 115389. https://doi.org/10.1016/j.apenergy.2020.115389
[9] Dizier, A. (2018). Techno-economic analysis of floating PV solar power plants using active cooling technique: A case study for Taiwan. Master of Science Thesis, KTH School of Industrial Engineering and Management.
[10] Pimentel Da Silva, G.D., Branco, D.A.C. (2018). Is floating photovoltaic better than conventional photovoltaic? Assessing environmental impacts. Impact Assessment and Project Appraisal, 36(5): 390-400. https://doi.org/10.1080/14615517.2018.1477498
[11] Nirmal, S., Rizvi, T. (2022). A review of renewable energy systems for industrial applications. International Journal for Research in Applied Science & Engineering Technology (IJRASET), 10(9): 1740-1745. https://doi.org/10.22214/ijraset.2022.46903
[12] Sharma, K.K., Singh, B. (2018). Optimization and Sensitivity Analysis of Hybrid Power System in HOMER for study area. International Journal of Pure and Applied Mathematics, 118(19): 2381-2396.
[13] Junianto, B., Dewi, T., Sitompul, C.R. (2020). Development and feasibility analysis of floating solar panel application in Palembang, South Sumatra. Journal of Physics: Conference Series, 1500(1): 012016. https://doi.org/10.1088/1742-6596/1500/1/012016
[14] Lee, N., Grunwald, U., Rosenlieb, E., Mirletz, H., Aznar, A., Spencer, R., Cox, S. (2020). Hybrid floating solar photovoltaics-hydropower systems: Benefits and global assessment of technical potential. Renewable Energy, 162: 1415-1427. https://doi.org/10.1016/j.renene.2020.08.080
[15] Makhija, S.P., Dubey, S.P., Bansal, R.C., Jena, P.K. (2021). Techno-environ-economical analysis of floating PV/on-ground PV/grid extension systems for electrification of a remote area in India. Technology and Economics of Smart Grids and Sustainable Energy, 6: 1-10. https://doi.org/10.1007/s40866-021-00104-z
[16] Chandra, S., Rizvi, T. (2022). Detailed energy audit of thermal power plant. International Journal for Research in Applied Science & Engineering Technology (IJRASET), 10(5): 1836-1846. https://doi.org/10.22214/ijraset.2022.42651
[17] Chandra, S., Rizvi, T. (2021). Energy audit of thermal power plant: A literature survey. i-Manager's Journal on Power Systems Engineering, 9(4): 36. https://doi.org/10.26634/jps.9.4.18662
[18] Siddiquee, S.S., Alam, M.S., Islam, M.K., Reza, M.H., Al Arafat, M. (2015). Optimized hybrid renewable energy system for efficient industrial electrification. In 2015 International Conference on Electrical Engineering and Information Communication Technology (ICEEICT), pp. 1-5. https://doi.org/10.1109/ICEEICT.2015.7307394
[19] Psomopoulos, C.S., Ioannidis, G.C., Kaminaris, S.D., Mardikis, K.D., Katsikas, N.G. (2015). A comparative evaluation of photovoltaic electricity production assessment software (PVGIS, PVWatts and RETScreen). Environmental Processes, 2: 175-189. https://doi.org/10.1007/s40710-015-0092-4
[20] Santafé, M.R., Soler, J.B.T., Romero, F.J.S., Gisbert, P.S.F., Gozálvez, J.J.F., Gisbert, C.M.F. (2014). Theoretical and experimental analysis of a floating photovoltaic cover for water irrigation reservoirs. Energy, 67: 246-255. https://doi.org/10.1016/j.energy.2014.01.083
[21] Sinha, P., Raju, S., Drozdiak, K., Wade, A. (2018). Life cycle management and recycling of PV systems. PHOTOVOLTAICS INT’L, 38: 26-26.
[22] Singh, A.K., Boruah, D., Sehgal, L., Ramaswamy, A.P. (2019). Feasibility study of a grid-tied 2MW floating solar PV power station and e-transportation facility using ‘SketchUp Pro’for the proposed smart city of Pondicherry in India. Journal of Smart Cities, 2(2): 49-59. https://doi.org/10.26789/JSC.2016.02.004
[23] Trapani, K., Redón Santafé, M. (2015). A review of floating photovoltaic installations: 2007–2013. Progress in Photovoltaics: Research and Applications, 23(4): 524-532. https://doi.org/10.1002/pip.2466
[24] Acharya, M., Devraj, S. (2019). Floating solar photovoltaic (FSPV): a third pillar to solar PV sector. New Delhi, India: The Energy and Resources Institute.
[25] Aryani, D.R., Khairurraziq, T.A., Ramadhan, G.R., Wardana, N.S., Husnayain, F., Garniwa, I. (2019). Simulation of stand-alone floating photovoltaic and battery systems. In IOP Conference Series: Materials Science and Engineering, 673(1): 012059. https://doi.org/10.1088/1757-899X/673/1/012059
[26] Liu, L., Wang, Q., Lin, H., Li, H., Sun, Q. (2017). Power generation efficiency and prospects of floating photovoltaic systems. Energy Procedia, 105: 1136-1142. https://doi.org/10.1016/j.egypro.2017.03.483
[27] Choi, Y.K. (2014). A study on power generation analysis of floating PV system considering environmental impact. International journal of software engineering and its applications, 8(1): 75-84. http://dx.doi.org/10.14257/ijseia.2014.8.1.07
[28] Song, J., Choi, Y. (2016). Analysis of the potential for use of floating photovoltaic systems on mine pit lakes: Case study at the Ssangyong open-pit limestone mine in Korea. Energies, 9(2): 102. https://doi.org/10.3390/en9020102
[29] Sahu, A., Yadav, N., Sudhakar, K. (2016). Floating photovoltaic power plant: A review. Renewable and sustainable energy reviews, 66: 815-824. https://doi.org/10.1016/j.rser.2016.08.051
[30] Lee, N., Grunwald, U., Rosenlieb, E., Mirletz, H., Aznar, A., Spencer, R., Cox, S. (2020). Hybrid floating solar photovoltaics-hydropower systems: Benefits and global assessment of technical potential. Renewable Energy, 162: 1415-1427. https://doi.org/10.1016/j.renene.2020.08.080
[31] Zhou, Y., Chang, F.J., Chang, L.C., Lee, W.D., Huang, A., Xu, C.Y., Guo, S. (2020). An advanced complementary scheme of floating photovoltaic and hydropower generation flourishing water-food-energy nexus synergies. Applied Energy, 275: 115389. https://doi.org/10.1016/j.apenergy.2020.115389
[32] Rizvi, T., Dubey, S.P., Tripathi, N., Makhija, S.P. (2022). A comparative analysis of FSPV-grid and grid-only systems for an industrial subsection. In 2022 Second International Conference on Advances in Electrical, Computing, Communication and Sustainable Technologies, Bhilai, India, pp. 1-7. https://doi.org/10.1109/ICAECT54875.2022.9807931
[33] Rizvi, T., Dubey, S.P., Tripathi, N., Srivastava, G., Makhija, S.P., Mohiddin, M.K. (2023). FSPV-Grid system for an industrial subsection with PV price sensitivity analysis. Sustainability, 15(3): 2495. https://doi.org/10.3390/su15032495
[34] Rizvi, T., Dubey, S.P., Tripathi, N. (2021). Designing of a feasible low pollutant grid integrated system for steel plant. CSVTU Research Journal, 10(2): 144-154. https://doi.org/10.30732/CSVTURJ.20211002007
[35] Rizvi, T., Tripathi, N., Dubey, S.P. (2020). Feasibility analysis of a grid integrated renewable energy systems in heavy industries. Journal of Advanced Research in Dynamical and Control Systems, 12(6): 2289-2302. https://doi.org/10.5373/JARDCS/V12I6/S20201188
[36] Rizvi, T., Dubey, S.P., Tripathi, N. (2022). Reconceptualizing the application of renewable energy sources in industry: A review. International Research Journal of Engineering and Technology, 9(1): 514-518.
[37] Belu, R.G., Chiou, R., GHAISAS, K., Tseng, T.L.B. (2014). Teaching renewable energy system design and analysis with HOMER. In 2014 ASEE Annual Conference & Exposition, pp. 24-1169. https://doi.org/10.18260/1-2--23102