Mais Alzgool*![]() | Abdullah Adnan Khalaf
| Abdullah Adnan Khalaf![]() | Omran Nasan
| Omran Nasan![]() | Laith Khatabi
| Laith Khatabi![]() | Mohammad Ali Alrifai
| Mohammad Ali Alrifai![]()
© 2023 IIETA. This article is published by IIETA and is licensed under the CC BY 4.0 license (http://creativecommons.org/licenses/by/4.0/).
OPEN ACCESS
The escalating costs, transmission losses, and environmental ramifications associated with fossil fuel utilization have catalyzed a paradigm shift towards Renewable Energy Sources (RES) in electricity generation. Smart Grid (SG) technologies, which are inherently reliant on a RES-exclusive electricity framework, facilitate efficient energy consumption and the distribution of decentralized energy resources. This investigation underscores the integration of RES within SG infrastructure and the potential for Jordan's transition towards an SG-enabled future. Situated in a locale characterized by abundant solar irradiance and significant wind velocities, Ma'an city presents an optimal case study for RES deployment. An amalgamated RES system, comprising wind and photovoltaic (PV) modules with an aggregate capacity of 180 MW, has been meticulously sized and designed to cater to the electrical demand of Ma'an. The load requirements for Ma'an were determined through an analysis of the city's average annual energy consumption, adjusted for population growth projections. To bolster the system's reliability and cater to emergency load demands, a storage solution has been integrated. The performance of the proposed design was substantiated and assessed via mathematical modeling and simulation analysis, utilizing the MATLAB Simulink platform. The simulations were conducted accounting for factors impinging upon each system's production capacity, inclusive of transmission line losses. Moreover, a Proportional-Integral-Derivative (PID) controller was incorporated and evaluated under simulated fault conditions, ensuring system disconnection within a five-second window subsequent to fault detection. The simulation outcomes exhibited congruence with the mathematical model predictions. Economically, the installation of the proposed systems is justifiable, with projected savings of approximately 80 million Jordanian Dinars (JD) annually and a favorable payback period of 14 months. The levelized cost of electricity is competitively priced at 14.41 JD/MWh. The findings advocate for the expansion of RES integration across Jordan, suggesting the feasibility of a nationwide RES-based SG implementation.
renewable energy sources, wind energy, PV energy, smart grid, renewable energy sources integration, energy economics
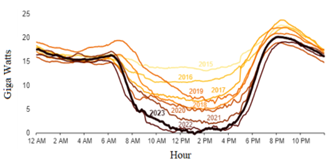
As global electricity demand escalates, Renewable Energy Sources (RESs) are increasingly supplanting traditional power plants, offering the promise of cost reduction and clean energy provision. Legacy power grids, predominantly engineered for unidirectional power flow from centralized generators to consumers, are becoming obsolete. Failures at these central nodes can lead to widespread service disruptions, underscoring the vulnerability of the existing infrastructure [1]. The growth of RESs affects grid stability [2, 3]. For example, more solar energy will cover a high percentage of demand in the mid-day period, which will lead to an imbalance in the demand curve as shown in Figure 1. Also, energy generated from wind is often variable because of wind changes.
The proliferation of RESs introduces complexities to grid management, particularly in terms of stability. For instance, the integration of solar energy can lead to a significant mid-day peak in energy supply, deviating from traditional demand curves and creating an imbalance, as depicted in the so-called 'Duck Curve' [1]. Additionally, the inherently variable nature of wind energy further compounds these stability challenges due to fluctuating wind conditions.
To effectively harness different RESs, advanced control techniques are imperative, yet the current grid's limited data capabilities hinder such advancements [4]. Distributed System Operators (DSOs) are tasked with not only delivering power but also ensuring that power quality remains within acceptable standards [5, 6]. Voltage disturbances, often prompted by overloading from new connections, pose a significant risk; if unaddressed by DSOs, these can trigger unwarranted local blackouts due to the activation of protective devices within the distribution network [7, 8].
Traditional investments by DSOs in copper-based infrastructure or conventional voltage control systems are being challenged by the potential of Local Energy Sources (LES) to offer more versatile and controlled solutions. Notably, regulations introduced in 2017 to incentivize PV farm installations have led to situations where the cost to upgrade the grid to accommodate these new sources can be prohibitively expensive—up to three times the investment value of the PV farms themselves [7].
Figure 1. Duck curve of demand curve [1]
Smart Grids (SGs) and microgrids, equipped with technical tools like SG controllers, are being recognized for their ability to mitigate these challenges at a fraction of the cost [7, 9-11]. The Simris project demonstrated that employing SG components, such as Battery Energy Storage Systems (BESS) and Power Conversion Systems (PCS), can be up to four times more cost-effective than conventional grid upgrades when addressing grid disturbances like voltage deviations [7].
The transition to SGs or microgrids is driven by the need for more efficient electricity supply systems. These grids are characterized by the integration of RESs and decentralized stations [12-16]. SGs enhance grid reliability, enable fault detection and self-repair without manual intervention, and increase resilience against natural disasters or deliberate sabotage. They also empower consumers to become active grid participants, managing power flow [17]. The complexity of SGs is vast, necessitating extensive research [18-20]. Various techniques for integrating and distributing RESs over long distances within SGs have been explored, including DC grids with Multi Input Single Output (MISO) or Multi Input Multi Output (MIMO) DC/DC converters [21-23].
In summary, the variability and unpredictability of RESs, the need for new infrastructure, and the implications for grid stability and security of supply are challenges confronting power grid operators [24]. Consequently, a detailed feasibility study for the adoption of SGs is warranted in the selected area of Ma'an city, Jordan.
In this study, Ma’an governorate has been chosen to be the case study to present an integration method of RESs. As it is a suitable area for wind farms and PV farms. Whereas the average Specific Produced Energy (SPE) is 1870 kWh/kWp/year [25-28], and the average wind speed at an altitude of 10 meters is 5 m/s [29]. To calculate the energy consumption in Ma’an, the population is estimated in 2040. Where Ma’an population in 2019 is estimated to be 175200 people [25] increasing by 2.03%/year, with an average consumption of 2100 kWh/year/person [26]. The proposed project should be cover the energy consumption of 20 years. Thus, the electrical demand could be estimated to be 561.099 GWh/year, so, the gross electricity demand in Ma’an city will be covered by the designed wind and PV farms. An estimation of the percentage of both solar and wind energy required to cover the consumption of this city has been considered. The proposed model integrates renewable energy sources of PV and wind as the primary sources of energy, and a battery bank as the secondary source of energy. In summary, a mathematical model of a detailed design and sizing of the PV and wind farms has been implemented. Also, the use of MISO converter in order to integrate the designed RESs has been considered and tested. The chosen converter has the benefits of simple configuration, fewer parts, high performance, and a high conversion ratio. In order to simulate the proposed model with the aid of the converter; the inputs and output in terms of inductor (L), capacitor (C), and the duty cycle (D) of the power switches (IGBT) are mathematically related. PID controller has been used to control MISO converter where the simple and low cost controller structure is always in demand for most industrial and high performance applications.
In order to test the designed farms performance a PVsyst platform has been used for PV system simulation, while for shade analysis SketchUp software has been utilized. Also the Photovoltaic Geographical Information System (PVGIS) has been used to determine the Sun Peak Energy (SPE) and solar data of Ma'an’s city. Furthermore, SketchUp and MATLAB platforms have been used to model the wind turbines within the wind farm and to determine the layout of the farm. In addition, all the required weather data has been imported to the MATLAB package using the Global Wind Atlas and Global Solar Atlas, in order to determine the electrical output profiles of the mix of renewable sources which will be ready to be integrated to the SGs.
In the following sections, a detailed of technical analysis of the designed PV and wind farms will be discussed. Where the percentage of the covered energy demands has been chosen for each renewable energy source in order to obtain the lowest energy costs within an allowable range of reliability in the selected location [27]. Thus, in this study 60% of overall Ma’an’s energy demands will be covered by the PV farms and the remaining energy will be covered by the wind farm, also, in case of emergency loads the storage batteries will be sized to cover 20% of the overall Ma’an’s energy demand.
3.1 Target energy
As mentioned before the energy produced from solar Photovoltaic systems is said to cover 60% of overall Ma’an’s energy consumption, then the PV farms size could be found using Eq. (1).
$\begin{gathered}E_{P V}=60 \% \times E_{\text {Total }} \\ E_{P V}=60 \% \times 561.099 \\ E_{P V}=336.66 \mathrm{GWh} / \text { year }\end{gathered}$ (1)
3.2 System sizing
According to PVGIS, energy produced from 1 kWp PV installed in Ma’an is 1870 kWh/year. Then, a PV system capacity of 180 MWp is required to deliver 336.66 GWh per year. Thus, six identical separate PV stations of 30 MWp each will be designed in order to achieve a total of 180 MWp.
3.3 Feasibility study of the PV farm
Table 1. Specifications of the PV farm design
|
Energy Degradation |
Tarrif Inflation |
O&M Inflation |
|||
|
First Year 2% |
After 0.55% |
First Year 0.12% |
After 3% |
First Year 2% |
After 5% |
|
Power of System (kW) |
SPE (kWh/kW-year) |
Orientation |
|||
|
180000.00 |
1870 |
AZIM UTH |
TILT |
||
|
0 |
30 |
||||
|
Total Cost (JD) |
Unit Price (JD) |
Panels |
|||
|
54000000.0 |
300 |
Trina Solar 500.0 W |
|||
The required parameters of the PV farm design are listed in Table 1. The utilized PV panels and their cost with their optimal tilted angle have been considered. Furthermore, the economical specifications of the selected PV panel such as; its energy degradation per year and its Operation and Maintenance (O&M) inflation have been listed.
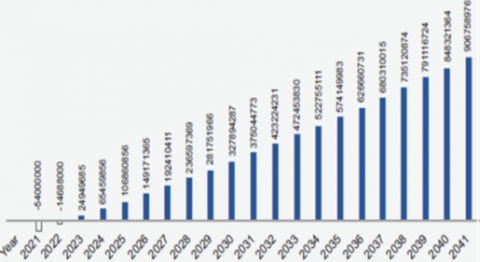
In order to evaluate the economic viability of the designed PV farms, 20 years feasibility study has been performed and listed in Table 2. In order to find the total cost of the designed farms, and to calculate the Levilized Cost of Energy (LCOE) as well as the payback period of the system the cash flow diagram of the system is required as shown in Figure 2.
Figure 2. Cash flow diagram
Table 2. A summary of a 20-year economic viability study
|
Year |
Energy Produced (MWh) |
System Cost (JD) |
Tariff (JD) |
Saving Rate (JD) |
Cash Flow (JD) |
|
2021 |
0 |
54000000 |
0.120 |
0 |
-54000000 |
|
2022 |
336600 |
1080000 |
0.124 |
40392000 |
-14688000 |
|
2023 |
329868 |
1134000 |
0.127 |
40771685 |
24949685 |
|
2024 |
327559 |
1190700 |
0.131 |
41700871 |
65459856 |
|
2025 |
325266 |
1250235 |
0.135 |
42651234 |
106860856 |
|
2026 |
322989 |
1312747 |
0.139 |
43623256 |
149171365 |
|
2027 |
320728 |
1378384 |
0.143 |
44617430 |
192410411 |
|
2028 |
318483 |
1447303 |
0.148 |
45634261 |
236597369 |
|
2029 |
316254 |
1519668 |
0.152 |
46674266 |
281751966 |
|
2030 |
314040 |
1595652 |
0.157 |
47737973 |
327894287 |
|
2031 |
311842 |
1675434 |
0.161 |
48825921 |
375044773 |
|
2032 |
309659 |
1759206 |
0.166 |
49938664 |
423224231 |
|
2033 |
307491 |
1847167 |
0.171 |
51076766 |
472453830 |
|
2034 |
305339 |
1939525 |
0.176 |
52240805 |
522755111 |
|
2035 |
303201 |
2036501 |
0.182 |
53431373 |
574149983 |
|
2036 |
301079 |
2138326 |
0.187 |
54649074 |
626660731 |
|
2037 |
298971 |
2245242 |
0.193 |
55894527 |
680310015 |
|
2038 |
296879 |
2357505 |
0.198 |
57168363 |
735120874 |
|
2039 |
294800 |
2475380 |
0.204 |
58471230 |
791116724 |
|
2040 |
292737 |
2599149 |
0.210 |
59803789 |
848321364 |
|
2041 |
290688 |
2729106 |
0.217 |
61166718 |
906758976 |
Based on the presented data LCOE of the PV system could be calculated as follows:
LCOE $=\left(\frac{\text { PV System Cost }}{\text { PV Energy Produce }}\right)_{20 \text { year }}$ (2)
$\mathrm{LCOE}=\frac{\sum_{\mathrm{y}=1}^{20} \text { Cost }}{\sum_{\mathrm{y}=1}^{20} \text { Energy }}=\frac{89,711,230 \mathrm{JD}}{6,224,473 \mathrm{MWh}}=14.41 \mathrm{JD} / \mathrm{MWh}$
To find the payback period of the PV system, Eq. (3) could be used as follows:
$\begin{gathered}\text { Payback period }=\frac{\text { System Cost }}{\text { Saving Rate }}=\frac{54,000,000}{47,124,000} =1.15 \text { years } \approx 14 \text { months. }\end{gathered}$ (3)
3.4 Results
As a result, the designed PV systems are economically worthy to install, where they would save about 80 million JD each year of operation. Also, an acceptable payback period which reaches 14 months with low LCOE of almost 14.4 JD/MWh have been achieved. This means that the PV system will have a revenue of 900 million JD.
4.1 Study area and data set
In order to design the proposed wind farm and to select the optimal wind turbine in the selected location, a detailed weather information in Ma'an city is required. Ma'an a city located in southern Jordan, with geographical coordinates between (30.456, 36.696), and with elevation ranges from 1100 - 1140 m [29]. Ma'an prevails a desert climate, with temperatures in summer rising up to 35 degrees Celsius, and in winter temperatures down to 15 degrees Celsius. As for the precipitation rain, with a maximum of 60 mm [29]. The city is affected in summer by the southeastern desert winds, and in winter by westerly winds, which are the cause of rain. As mentioned before, Ma'an’s energy demand has been defined to be 561,099 GWh per year [25]. In this study 40% of the demand will be covered by the designed wind farm.
4.2 Target energy
Energy produced from the wind farm through Wind Turbines (WTs) will be:
$\begin{gathered}\mathrm{E}_{\mathrm{WT}}=40 \% \times \text { Target Energy }=40 \% \times 561.099 \mathrm{GW} / \text { year }=224.44 \mathrm{GW} / \text { year }\end{gathered}$ (4)
To calculate the number of wind turbines that should be installed in the proposed farm, the determination of WT type, rated power, specifications, and the capacity factor are required. The Vestas V90-3.0 turbine has been chosen as the model on this study due to its relatively high rated power as listed in Table 3. The wind turbine cut-in speed is 4 m/s and the cut-out speed of 25 m/s, with a rotor diameter of 90 m, and with up to 1,000 V rated voltage.
Table 3. Vestas V90-3.0 turbine specifications [30]
|
Rated Power |
3,000.0 kW |
|
Cut-In Wind Speed |
4.0 m/s |
|
Rated Wind Speed |
15.0 m/s |
|
Cut-Out Wind Speed |
25.0 m/s |
|
Diameter |
90.0 m |
|
Hub Height |
80/105 m |
To calculate the estimated annual energy produced by the selected WT a capacity factor approach could be used. At 100 m height the average wind speed in Ma’an city is 7.68 m/s, then the Capacity Factor (CF) could be calculated using Eq. (5) as follows:
$C F=0.087 \times v-\frac{P_{\text {rated }}}{(D)^2}$ (5)
where, P is the WT rated power, D is the rotor’s diameter and v is the average wind speed.
$C F=0.087 \times 7.68-\frac{3000}{(90)^2}=0.2978$
Then the total required number of WT is:
$\begin{gathered}\text { Number }_{\text {turbines }}=\frac{\text { Annual Energy }}{\mathrm{P}_{\text {rated }} \times 8760 \mathrm{~h} / \mathrm{y} \times \mathrm{CF}} =\frac{224.44 \mathrm{GWh}}{3000 \mathrm{~kW} \times 8760 \times 0.2978}\end{gathered}$
Number $r_{\text {turbines }}=29$ turbines. (6)
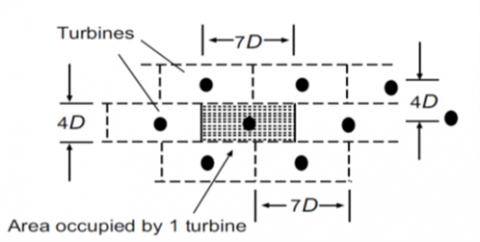
The required area for each WT should be considered in order to prevent wind damage within the farm, so the area could be assumed to be:
Area of one turbine $=4$ Dbetween towers in row $\times 7$ Dbetween row $=28 D 2=28 \times 902=226800 \mathrm{~m}^2$ $=0.2268 \mathrm{~km}^2$ (7)
Thus, the total area needed for the wind farm would be:
$\begin{aligned} \text { Total area } & =\text { Number } r_{\text {turbines }} \times \text { Area of one turbine } \\ & =30 \times 0.2268 \mathrm{~km}^2=6.8 \mathrm{~km}^2\end{aligned}$ (8)
Then the proposed WTs layout configuration within the farm could be as shown in Figure 3.
Figure 3. Wind farm layout
The payback period of the designed wind farm is:
$$
\begin{aligned}
\text { Payback Period } & =\frac{\text { System Cost }}{\text { Saving Rate }}=\frac{114,750,000}{32,869,973}=3.5 \text { years } \approx 42 \text { months }
\end{aligned}
$$ (9)
Then the total saving rate of the PV and wind systems will be 79,993,973 JD/year with net profit of 1.4 Billion JD which make this project worthy to install.
$\begin{aligned} \text { Total saving rate } & =\text { PV saving rate } + \text { Wind saving rate }\end{aligned}$ (10)
$\begin{aligned} \text { Total saving rate } & =47,124,000 \mathrm{JD} / \text { year } +32,869,973 \mathrm{JD} / \text { year } =79,993,973 \mathrm{JD} / \text { year }\end{aligned}$
Net Profit $=542,354,555 \mathrm{JD}+888,287,400 \mathrm{JD}$
Net Profit $=1,430,641,955 \mathrm{JD} \approx 1.4$ Billion JD
4.3 PV system simulation using MATLAB
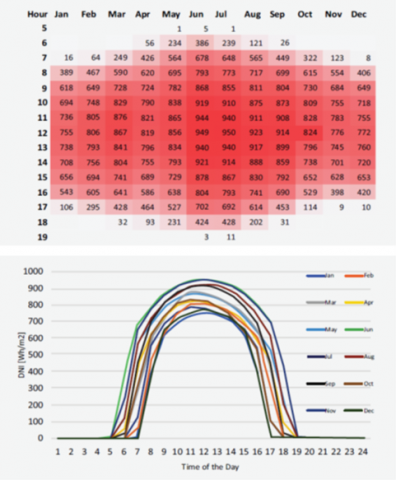
As mentioned before, Ma’an has a comparatively high daily Direct Normal Irradiation (DNI). These solar data are transferred to MATLAB for simulation purposes in order to generate a variable output based on the time of the day for each month of the year as shown in Figure 4.
Figure 4. Solar irradiance in Ma’an city during the day [31]
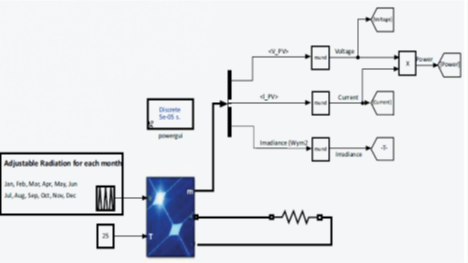
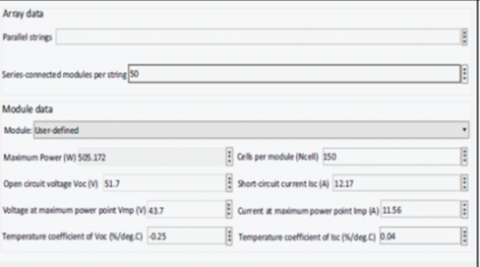
The process of determining the maximum output power of the PV farm during the day is known as the Maximum Power Point Tracking (MPPT), which could be obtained through the utilized solar inverter or the current –voltage (I-V) curve of the PV panels’ performance. Figure 5 depicts the PV array modeling using MATLAB-Simulink software. The module data that has been used is determined as shown in Figure 6.
Figure 5. PV array modeling
Figure 6. PV module specifications
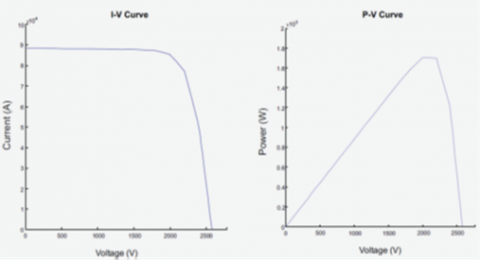
The I-V curve of the PV module represents its energy transfer capability under operating conditions of irradiance and temperature, so as a result the current-voltage and power voltage curves are shown below in Figure 7.
Figure 7. I-V and P-V curves
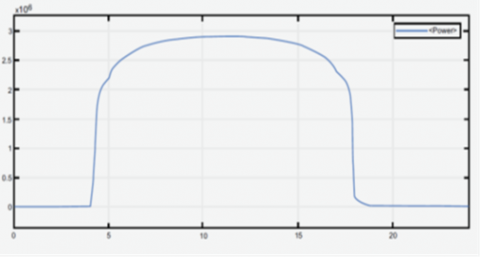
The MATLAB simulation output voltage of the proposed PV array could be obtained as shown in Figure 8.
Figure 8. PV array output voltage
As a result, the profiles of the output voltage and the output current of simulated PV farms have a good correlation with those obtained via mathematical modeling. And this output could be connected to the MISO converter to be integrated with the other sources. So that, these profiles are important to be defined for each hour of the day.
4.4 Wind farm simulation using MATLAB
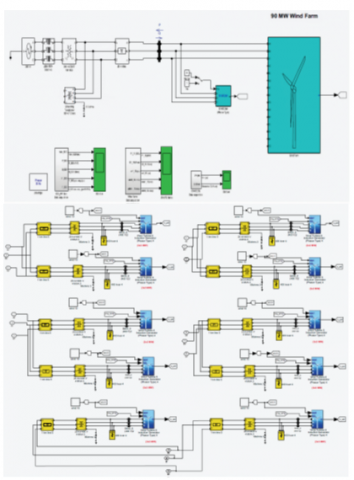
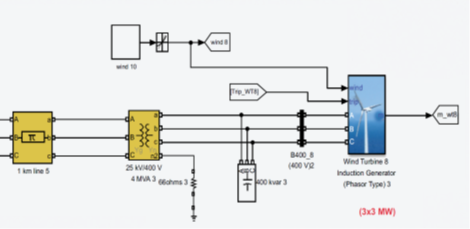
A wind power plant of 90 MW was simulated with Simulink-MATLAB, this section included 30 turbine every one of those with capacity of 3MW as mentioned before. To reduce the working area of Simulink-MATLAB each block consists of three WTs. This is because the wind farm is very large, so to reduce the software issues and to reduce the time required for simulation decided to connect every three turbines in parallel within one block. So, ten blocks (strings) of wind turbine each block with a capacity of (3×3 MW) to obtain a simulated 90 MW, through 10 strings in the proposed farm as shown in Figure 9. Each string has a special control system and specific database of the wind for the preselected location.
Every string connected to a transformer 400V/25kV, with 1 km transmission line loss is included as shown in Figure 10.
From the simulation results it was clear that the Power Factor (PF) quality could be improved by adding a capacitor bank to the system in order to ease the integration of the REs to SG.
Figure 9. 90 MW wind power plant-MATLAB
Figure 10. String design of 9 MW wind power
4.5 Wind farm simulation with control strategy
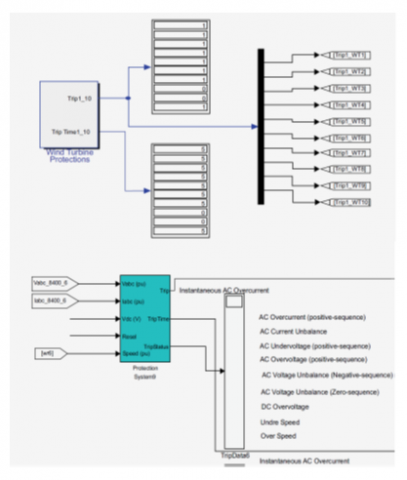
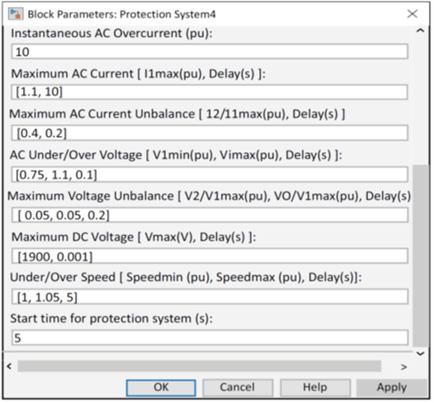
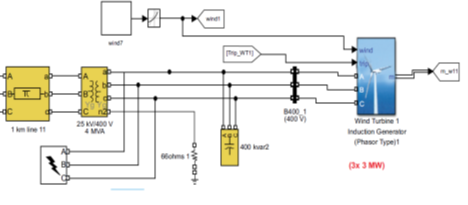
PID Controller for each string has been designed for protection purposes of the wind turbine by shutting the WT down during any fault. In this farm, for controller a number of monitored devices have been used such as: over wind speed, under wind speed, DC overvoltage, AC voltage and unbalance (Zero-sequence). Figure 11 depicts the protection system parameters’ that have been obtained during this simulation. Thus, for each string of the designed farm overcurrent protection system has been implemented as shown in Figure 12.
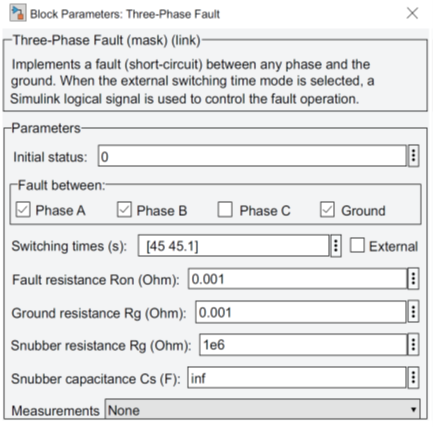
To test the robustness of the proposed controller within the designed wind farm; a three-phase AC fault has been applied at each string as shown in Figure 13. Where the three-phase AC fault parameters have been obtained in Figure 14.
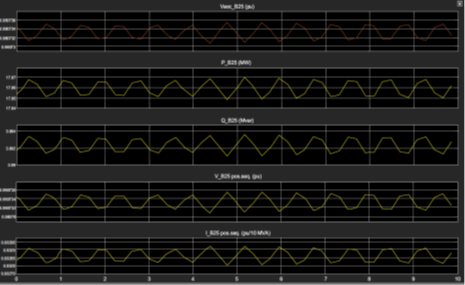
As a simulation result, when the AC fault is detected within the system the turbine goes to shut down after 5 seconds from the fault acquired and this result demonstrates the robustness of the implemented controller. Figure 15 shows the simulation results of each subsystem of the wind power plant which consists of 2 strings (6 × 3MW). The results include the active power (MW), reactive power (MVAR), three-phase current (Iabc) (per-unit/18MVA), three-phase voltage (Vabc)(per-unit) and V (per-unit) (base voltage= 25kV).
Figure 11. Overcurrent protection system for wind power plant
Figure 12. Monitores protection parameters – MATLAB
Figure 13. String design wind power plant with AC fault
Figure 14. Three-phase AC fault parameters
Figure 15. Wind power plant simulation results without fault
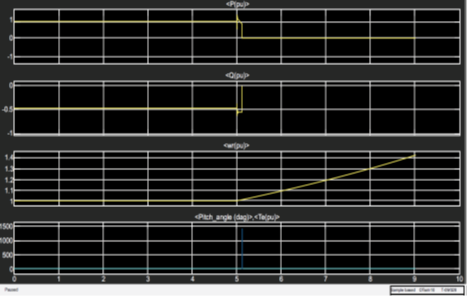
After applying the AC fault in the system, the output of the wind power plant will be shown in Figure 16. Which again this explains the effectiveness of the implemented control strategy in the system.
Figure 16. The simulation result of the wind power plant with AC fault
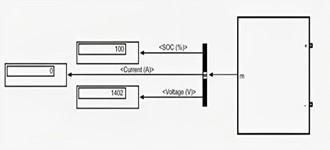
4.6 Batteries simulation using MATLAB
Designing an entire city to run on renewable energy sources calls for a storage system. Where the importance of having a storage system comes from, storing the surplus energy and using it when it is needed. Because it is known that these sources have volatile productivity as they depend on the surrounding environmental conditions. A 626 MWh battery system which represents 20% of the total Ma’an city demand has been designed using MATLAB. Figure 17 depicts the storage system scheme that has been implemented in this study as a secondary source of energy for emergency loads and to enhance the proposed system’s reliability. As integrating REs may cause insecurity of supply so, having a battery bank could solve this challenge.
Figure 17. The batteries scheme-MATLAB
Converting into the smart grid will add many advantages to the grid’s sustainability, however it is considered to be a complicated process. MISO converter is contributed to easing the process of mixing renewable energy sources. Although the high initial cost of renewable energy sources, will reduce the operating cost and will save millions of tons of harmful gases emissions. Due to high solar irradiation in Ma’an, PV stations have been proposed to cover 60% of the total energy demand in the city. These stations will produce 336.66 GWh per year. The system cost will be returned in 14 months, with a low LCOE of 14.41 JD/MWh. In addition, wind farm has been designed to cover the remained 40% of total demand, where 234.78 GWh will be produced every year. This result demonstrates the ability of the electricity grid to evolve towards smart grids. Also, in order to increase the reliability of the proposed system and integrating renewable energy sources based on smart grid a storage battery system has been suggested to cover 20% of the total energy demand, which will be used alongside renewable sources in case of emergency. Both systems of solar and wind will make high revenue, where they are expected to save about 80 million JD. PV stations and wind power plant are simulated using MATLAB-Simulink, taking the factors affecting the production rate in our concern. In addition, PID controller has been implemented and tested under faulty conditions. Where the system will be tripped off within 5 seconds of the fault detection. In conclusion, it is recommended to expand the targeted area to cover the whole kingdom demand with renewable energy sources to be integrated to the smart grid.
It is recommended to expand this work by simulating the proposed mix of renewable energy sources with MISO converter in the case of various input sources with different voltage levels. Also to test the ability of the system to adapt when the output energy of each source changed based on the weather conditions.
This work is supported by Zarqa’a University and is fully funded by this institution.
|
SG |
Smart grid |
|
RESs |
Renewable energy sources |
|
DOSs |
Distributed System Operators |
|
LES |
Local Energy Source |
|
LCOE |
Levilized Cost of Energy |
|
EPV |
PV energy |
|
EWT |
Wind turbine energy |
|
WTs |
Wind turbines |
|
CF |
Capacity factor |
|
MPPT |
Maximum power point tracking |
[1] What the duck curve tells us about managing a green grid. California ISO, Folsom. https://www.caiso.com/documents/flexibleresourceshelprenewables_fastfacts.pdf.
[2] Beck, H.P., Hesse, R. (2007). Virtual synchronous machine. In 2007 9th International Conference on Electrical Power Quality And Utilisation, Barcelona, Spain, pp. 1-6. https://doi.org/10.1109/EPQU.2007.4424220
[3] Saha, S., Saleem, M.I., Roy, T.K. (2023). Impact of high penetration of renewable energy sources on grid frequency behaviour. International Journal of Electrical Power & Energy Systems, 145: 108701. https://doi.org/10.1016/j.ijepes.2022.108701
[4] Irmak, E., Kabalci, E., Kabalci, Y. (2023). Digital transformation of microgrids: A review of design, operation, optimization, and cybersecurity. Energies, 16(12): 4590. https://doi.org/10.3390/en16124590
[5] Liang, X.D. (2016). Emerging power quality challenges due to integration of renewable energy sources. IEEE Transactions on Industry Applications, 53(2): 855-866. https://doi.org/10.1109/TIA.2016.2626253
[6] Phadke, A.G., Wall, P., Ding, L., Terzija, V. (2016). Improving the performance of power system protection using wide area monitoring systems. Journal of Modern Power Systems and Clean Energy, 4(3): 319-331. https://doi.org/10.1007/s40565-016-0211-x
[7] Rahman, M.M., Saha, S., Majumder, M.Z.H., Suki, T.T., Rahman, M.H., Fahmida, A., Haque, M.A.S., Hossain, M.K. (2022). Energy conservation of smart grid system using voltage reduction technique and its challenges. Kyushu University, 9(4): 924-938. https://doi.org/10.5109/6622879
[8] Nikkhah, S., Rabiee, A., Soroudi, A., Allahham, A., Taylor, P.C., Giaouris, D. (2023). Distributed flexibility to maintain security margin through decentralised TSO–DSO coordination. International Journal of Electrical Power & Energy Systems, 146: 108735. https://doi.org/10.1016/j.ijepes.2022.108701
[9] Muqeet, H.A., Liaqat, R., Jamil, M., Khan, A.A. (2023). A state-of-the-art review of smart energy systems and their management in a smart grid environment. Energies, 16(1): 472. https://doi.org/10.3390/en16010472
[10] Escobar, J.J.M., Matamoros, O.M., Padilla, R.T., Reyes, I.L., Espinosa, H.Q. (2021). A comprehensive review on smart grids: Challenges and opportunities. Sensors, 21(21): 6978. https://doi.org/10.3390/s21216978
[11] Wilms, H., Mildt, D., Cupelli, M., Monti, A., Kjellen, P., Fischer, T., Panic, D., Hirst, M., Scionti, E., Schwarz, S., Kessler, P. (2018). Microgrid field trials in sweden: Expanding the electric infrastructure in the village of simris. IEEE Electrification magazine, 6(4): 48-62. https://doi.org/10.1109/MELE.2018.2871295
[12] Khan, K.A., Quamar, M.M., Al-Qahtani, F.H., Asif, M., Alqahtani, M., Khalid, M. (2023). Smart grid infrastructure and renewable energy deployment: A conceptual review of Saudi Arabia. Energy Strategy Reviews, 50: 101247. https://doi.org/10.1016/j.esr.2023.101247
[13] Lund, H., Andersen, A.N., Østergaard, P.A., Mathiesen, B.V., Connolly, D. (2012). From electricity smart grids to smart energy systems–A market operation based approach and understanding. Energy, 42(1): 96-102. https://doi.org/10.1016/j.energy.2012.04.003
[14] Rangarajan, S.S., Raman, R., Singh, A., Shiva, C.K., Kumar, R., Sadhu, P.K., Collins, E.R., Senjyu, T. (2023). DC microgrids: A propitious smart grid paradigm for smart cities. Smart Cities, 6(4): 1690-1718. https://doi.org/10.3390/smartcities6040079
[15] Kabeyi, M.J., Olanrewaju, OA. (2022). The use of smart grids in the energy transition. In 2022 30th Southern African Universities Power Engineering Conference (SAUPEC), Durban, South Africa, pp. 1-8. https://doi.org/10.1109/SAUPEC55179.2022.9730635
[16] Wang, R.J. (2023). Enhancing energy efficiency with smart grid technology: A fusion of TCN, BiGRU, and attention mechanism. Frontiers in Energy Research, 11. https://doi.org/10.3389/fenrg.2023.1283026
[17] Shahzad, S., Abbasi, M.A., Ali, H., Iqbal, M., Munir, R., Kilic, H. (2023). Possibilities, challenges, and future opportunities of microgrids: A review. Sustainability, 15(8): 6366. https://doi.org/10.3390/su15086366
[18] Dorji, S., Stonier, A.A., Peter, G., Kuppusamy, R., Teekaraman, Y. (2023). An extensive critique on smart grid technologies: Recent advancements, key challenges, and future directions. Technologies, 11(3): 81. https://doi.org/10.3390/technologies11030081
[19] Kojonsaari, A.R., Palm, J. (2023). The development of social science research on smart grids: A semi-structured literature review. Energy, Sustainability and Society, 13: 1. https://doi.org/10.1186/s13705-023-00381-9
[20] Butt, O.M., Zulqarnain, M., Butt, T.M. (2021). Recent advancement in smart grid technology: Future prospects in the electrical power network. Ain Shams Engineering Journal, 12(1): 687-95. https://doi.org/10.1016/j.asej.2020.05.004
[21] Alzgool, M., Nouri, H., Toomer, C., Alzghoul, G. (2016). A novel multi-inputs-single-output DC transformer topology. In 2016 51st International Universities Power Engineering Conference, Coimbra, Portugal. https://doi.org/10.1109/UPEC.2016.8114139
[22] Alzgool, M., Nouri, H. (2017). Design, control and modelling of a novel Multi-Input-Multi-Output Boost Converter hub. In 2017 10th Jordanian International Electrical and Electronics Engineering Conference, Amman, Jordan, pp. 1-7. https://doi.org/10.1109/JIEEEC.2017.8051399
[23] Serkan, D., Xiong, L., Bilal, A. (2016). A new multi input three-level de/de converter. IEEE Transactions on Power Electronics, 31(2): 1230-1240. https://doi.org/10.1109/TPEL.2015.2424246
[24] Eltamaly, A.M., Mohamed, M.A., Al-Saud, M.S., Alolah, A.I. (2016). Load management as a smart grid concept for sizing and designing of hybrid renewable energy systems. Engineering Optimization, 49(10): 1813-1828. https://doi.org/10.1080/0305215X.2016.1261246
[25] Phadke, A.G., Wall, P., Ding, L., Terzija, V. (2016). Vladimir, improving the performance of power system protection using wide area monitoring systems. Journal of Modern Power Systems and Clean Energy, 4(3): 319-331. https://doi.org/10.1007/s40565-016-0211-x
[26] NEPCO national electrical power, the world energy demands. https://www.nepco.com.jo/en/Default.aspx, accessed on Dec. 25, 2023.
[27] Family and population surveys directorate department of population and social statistics. https://dosweb.dos.gov.jo/population/population-2/, accessed on Dec. 25, 2023.
[28] Photovoltaic geographical information system (PVGIS). https://re.jrc.ec.europa.eu/pvg_tools/en/, accessed on Dec. 25, 2023.
[29] Global wind atlas. https://globalwindatlas.info/en, accessed on Dec. 25, 2023.
[30] Vestas V90-3.0 turbine. https://en.wind-turbine-models.com/turbines/603- vestas-v90-3.0, accessed on Dec. 25, 2023.
[31] Global solar atlas. https://globalsolaratlas.info/map, accessed on Dec. 25, 2023.