Aanandsundar Arumugam![]() | Bernardo Buonomo
| Bernardo Buonomo![]() | Mario Luiso
| Mario Luiso![]() | Oronzio Manca*
| Oronzio Manca*![]()
© 2023 IIETA. This article is published by IIETA and is licensed under the CC BY 4.0 license (http://creativecommons.org/licenses/by/4.0/).
OPEN ACCESS
In the pursuit of optimal energy storage solutions, rechargeable batteries have gained significant attention for their applications in electric vehicles, aircraft, and satellites. This research focuses on the thermal management of lithium manganese dioxide and nickel-cadmium batteries, utilizing the lumped capacitance thermal modelling technique in the preliminary stage of analysis. The study focuses on the general lumped capacitance thermal equation to estimate battery temperature through analytical and numerical methods. The numerical approach employs the fourth order Runge-Kutta's method, which involved less computational cost, relatively stable and accurate to estimate the temperature with a variable internal resistance, a crucial factor in thermal behaviour analysis. In contrast, the analytical approach assumes a uniform temperature distribution across the battery's surface, simplifying the gradual variance between internal conductive and external convective thermal resistances. A comparative analysis against experimental data using error criterion techniques reveals that the numerical model, considering dynamic changes in internal resistance, aligns more closely with experimental findings and offers a statistically superior fit compared to the analytical model assuming constant internal resistance. This study underscores the effectiveness of the lumped capacitance thermal modelling technique in battery thermal management, emphasizing the importance for dynamic internal resistance for analysis of thermal behaviour.
analytical method, battery thermal management, energy storage, internal resistance, lumped capacitance thermal model, numerical model, Runge-Kutta method, statistical methodologies
Electric Vehicles (EVs) have been identified as a superior alternative to conventional thermodynamically driven engine vehicles, offering numerous advantages including reduced emissions of harmful gases, thereby contributing to a cleaner and more environmentally friendly atmosphere. These vehicles, characterized by fewer moving parts, demand lower maintenance costs. The scarcity and limitations of fossil fuels have prompted the necessity to embrace renewable energy sources, which can serve as a feasible means to generate energy for electrical batteries. The harnessing and storage of renewable energy in batteries have minimal effects on climatic and biotic systems. This is primarily due to the renewable energy used for the generation of electricity stored in the batteries involve processes which are more efficient, environmentally friendly, and sustainable. These sources are becoming more popular these days due to the reduced greenhouse gases emission, minimal air and water pollution, resilience to climate change and biodiversity preservation.
Batteries, serving as devices for the storage of electrochemical energy through reversible chemical reactions, play a pivotal role in the efficiency of EVs. These vehicles have been estimated to exhibit an efficiency of approximately 70%, surpassing that of thermodynamic combustible engines [1]. Initially, internal combustion engines predominantly utilized lead-acid batteries. However, the advent of lithium-ion and Lithium polymer-based batteries has led to a gradual shift, given their superior characteristics and benefits. Notably, Lithium-based batteries exhibit a high energy density (approximately 100-200 Wh/kg) and relatively low self-discharge rates (5 to 8% per month). Additionally, these batteries are recognized for their long lifespan and high voltage per cell (3.3 V for Li-ion and 3.7 V for Li-ion polymer batteries). Despite these advantages, Lithium-based batteries are sensitive to high temperatures and vulnerable to damage from overvoltage [2]. Safety concerns, particularly the risk of thermal runaway, a phenomenon often leading to explosions under high-temperature conditions, are also associated with these batteries [3]. The forecasted demand for lithium metal is expected to exceed the supply from mining by 2023-2025, highlighting the critical need for efficient recycling of Lithium-based batteries as part of a circular economy approach [4].
Nickel-cadmium batteries, in contrast, find extensive application in aircraft and Low Earth Orbit satellite systems. The performance of these batteries is influenced by factors such as charge-discharge cycle rates, temperature, and cell construction. Unlike Lithium batteries, Nickel-cadmium batteries are prone to memory effect. Standard constant current charging is preferred for these batteries, though high-current overcharging can adversely affect their operation. These batteries exhibit low internal resistance and are known for their low voltage per cell (approximately 1.2 V). However, they also demonstrate a high self-discharge rate (10-30%). Despite their sensitivity to high temperatures, Nickel-cadmium batteries offer robust operation compared to Li-ion batteries in several respects, including overload tolerance and mechanical robustness [5].
In terms of physical configuration, both Lithium and Nickel-cadmium battery cells are available in various shapes, such as cylindrical, prismatic, and pouch cells, each with distinct advantages and limitations depending on the application. Cylindrical cells, commonly used in EVs, are equipped with features like pressure relief mechanisms, positive thermal coefficients, and interruption devices for charge disconnection during malfunction. These cells are recognized for their mechanical resistance, higher energy density, and superior thermal management capabilities compared to other shapes. Particularly, the 18650 and 21700 battery pack configurations have gained popularity [6].
In the domain of Battery Management Systems (BMS), the modelling of battery cells is recognized as a crucial aspect. It is essential for analysing battery behaviour under diverse operating conditions, leading to the development of more efficient BMS designs. Moreover, such modelling assists in delineating the operational boundaries of batteries and plays a pivotal role in determining the power requirements of battery cells [7]. Given the inherent non-linear nature of battery behaviour, the design of an optimal BMS becomes imperative. Various models have been developed, considering battery attributes such as temperature, charge/discharge cycles, State of Charge (SOC), and capacity fading dynamics. Multifunctional BMS are typically employed to predict and analyse battery issues across different stages, ranging from individual cells to complete packs composed of multiple modules. Such systems ensure efficient cell function by maintaining proper communication among modules during operation.
Effective thermal management is crucial for achieving optimal operating temperatures in BMS, which, in turn, aids in mitigating excess heat and preventing thermal runaway. Various cooling techniques have been proposed for this purpose [8].
The thermal behavior of batteries is generally governed by three fundamental equations: the heat generation equation, the energy balance equation, and the boundary condition equations [9]. Based on these equations, a myriad of models has been proposed to study and estimate the thermal characteristics of battery cells. Thermal modelling of batteries is broadly classified into two categories: numerical and analytical model analysis. Both approaches use differential equations to estimate the energy balance in batteries. Numerical analysis, requiring computer software and algorithms, is employed for solving complex non-linear problems lacking analytic solutions. These models simulate the actual phenomena of processes or systems under varied operating conditions. Analytical models, on the other hand, involve mathematical modelling and computational derivations of closed-form solutions for complex problems, offering more accurate results with less computation time compared to numerical techniques, albeit not suitable for all non-linear complex problems [10].
Various researchers have reviewed, studied, and analysed modelling techniques of rechargeable batteries in relation to thermal control analysis. Parhizi et al. [3] investigated various numerical techniques to observe the thermal runaway characteristics of Li-ion batteries. Zhang et al. [11] analysed the estimation of parameters like heat transfer coefficient and specific heat capacity for a lithium-ion battery using an IR-camera and the principle of the lumped capacitance method. Comparative studies on thermal modelling techniques for lithium polymer batteries and methodologies to elaborate electrothermal features have been conducted [11]. The perspectives, mathematical approaches, and current state-of-the-art techniques of BMS for various EVs have been compared and analysed [12]. The basic electric modelling techniques for an EFEST-IMR 18650 Li-polymer battery, considering applications in EVs, were compared with experimental results [13]. Changes in internal resistance during discharge processes were also estimated and compared with experimental analyses. The thermal control of Li-ion batteries using metal foams partially filled with PCM was numerically modelled to understand the cooling characteristics of electric batteries [14]. Discussions on the limitations of existing cathode materials, like Layered lithium cobalt oxide in Li batteries, and potential replacements for better performance were detailed [15].
This study aims to analyse the lumped capacitance thermal model for two battery cells, namely lithium manganese dioxide and nickel cadmium cells, of cylindrical structure extensively used in vehicular applications. Prototypes of single cells of both chemistries were experimentally tested. Both numerical and analytical approaches of the lumped model were considered for the modelling process, and their thermal characteristic responses were compared with experimental results and analysed using various statistical techniques.
The lumped capacitance thermal model, commonly utilized in transient heat flow problems, presumes a uniform temperature throughout the system, varying solely with time t. The model is assumed and designed generally considering that the body is divided into several finite numbers of well-defined nodes, each of them treated as a separate element. It is postulated that the temperature gradient within the system is negligible, implying that the internal thermal resistance due to conduction is almost insignificant in the heat transfer process. However, the heat transfer arising from convection is considered a significant factor, suggesting infinite thermal conductivity of the system and a comparatively small heat transfer coefficient. The properties of the body considered are assumed to be homogeneous in nature.
Envision a system with volume V, surface area A, density ρ, and an initial uniform temperature Ti. At time t=0, this system is introduced into a medium at temperature Tm, initiating a heat transfer process between the system and its surroundings, characterized by a heat transfer coefficient h. Under the lumped system model assumption, the temperature within the system is considered uniform throughout and varies only with time t. The heat transfer between the system and its surroundings is governed by an energy balance equation, represented as Eq. (1):
Heat transfer inside/ outside of the system during the period dt = Change in the system’s energy during dt.
$h A\left(T_m-T\right) d t=m c_p d T$ (1)
where, T corresponds to the temperature of the system as a function of time in (K), m denotes the mass of the system in (kg), cp corresponds to the specific heat capacity of the system in (kJ/kg K). During a period dt, the differential energy of the system corresponding to the rise in temperature is given by Eq. (2).
$d T=d\left(T-T_m\right)$ (2)
The mass of the system is fundamentally related to its volume and density as delineated in Eq. (3).
$m=\left(\frac{\rho}{V}\right)$ (3)
where, m represents the mass of the material in (kg), ρ denotes the density of the material in (kg/m3) and V corresponds to the volume of the body in (m3).
Substituting Eq. (2) and Eq. (3) into Eq. (1)
$\frac{d\left(T-T_m\right)}{\left(T-T_m\right)}=\left(-\frac{h A}{\rho V c_p}\right) d t$
Integrating the resultant equation from an initial time of t=0 to any given time ‘t’ yields Eq. (4).
$\ln \left(\frac{T(t)-T_m}{T_i-T_m}\right)=\left(-\frac{h A}{\rho V c_p}\right) t$ (4)
Taking exponential on both sides, $\left(\frac{T(t)-T_m}{T_i-T_m}\right)=e^{-\left(\frac{h A}{\rho V c_p}\right) t}$ .
On reducing the above equation, it results in Eq. (5).
$\left(\frac{T(t)-T_m}{T_i-T_m}\right)=e^{-\alpha t}$ (5)
where, $\alpha=\left(\frac{h A}{\rho V c_p}\right)$ is termed as the reciprocal of time constant. The applicability of the lumped capacitance model to a system is contingent upon the characteristic length (m) of the system L, defined in Eq. (6).
$L=\left(\frac{V}{A}\right)$ (6)
This length must satisfy the criterion outlined in Eq. (7).
$\left(\frac{L}{K}\right)<<\left(\frac{1}{h}\right)$ (7)
where, K corresponds to the thermal conductivity of the system in (W/m K) and h represents the heat transfer coefficient in (W/m2/K). The dimensionless Biot number Bi, defined for any given lumped system, should fulfill the condition stipulated in Eq. (8).
$B i=\left(\frac{h L}{K}\right)$ (8)
Bi quantifies the heat transfer between the surface and the interior of the system. The lumped capacitance model's fundamental assumption of uniform temperature distribution during the heat transfer process is valid when Bi is less than 0.1. Values exceeding 0.1 imply non-uniform temperatures within the system, rendering the lumped capacitance model inapplicable. Various researchers have proposed the lumped capacitance model to formulate battery systems, adhering to specific assumptions:
(1) The battery system is considered to have a uniform temperature distribution profile with the absence of gradients.
(2) The physical and thermal properties of the battery cells are completely independent of the temperature profile.
(3) The battery cell core and module are characterized with an isothermal heat transfer phenomenon.
(4) The battery cell system is thermally homogeneous with a low thermal mass of the case in which the battery is placed [9, 16].
In the analytic approach to the lumped capacitance model, a focus is placed on rapidly determining the thermal behavior of battery cells. It has been established that during charging and discharging at various C-rates, the heat generated in the battery cells arises predominantly from Joule's heating loss, entropic phenomena, and polarization effects [17, 18], as indicated by Eq. (9). Among these, Joule's ohmic losses, associated with the internal resistance of the battery cell, have been identified as the principal contributor to the heating effect [19]. Consequently, the general heat balance equation for the battery cell is formulated as Eq. (10) [20, 21].
$m C_p\left(\frac{d T}{d t}\right)=Q_P-Q_B+Q_S$ (9)
$m C_p\left(\frac{d T}{d t}\right)=i^2 R_0-h A\left(T-T_{a m b}\right)$ (10)
where, $Q_P$ represents ohmic heat loss, $Q_S$ denotes entropic loss, and $Q_B$ refers to heat loss to the environment through convection, as per Newton's law of cooling. At the initial time $t=0$, the system temperature $T(0)$ is assumed to be the ambient temperature $T_{a m b}$. The current flow in the battery $i(\mathrm{A})$, the internal resistance of the battery cell $R_0$ (ohm), and the ambient temperature $T_{a m b}(\mathrm{K})$ are defined respectively.
Employing the energy balance equation and assuming constant properties for the battery cell system simplifies Eq. (9) to Eq. (11).
$h A\left(T-T_{a m b}\right)+\rho V C_p\left(\frac{d T}{d t}\right)=0$ (11)
Further assumption $\left(T-T_{a m b}\right)=\mu$ lead to the transformation of Eq. (11) to Eq. (12).
$\begin{aligned} m C_p \frac{d\left(T-T_{a m b}\right)}{d t} & =-h A\left(T-T_{a m b}\right) \\ m C_p \frac{d \mu}{d t} & =-h A \mu\end{aligned}$ (12)
Further assumption $\frac{m C_p}{h A}=\tau_c$ lead to the transformation of Eq. (12) to Eq. (13).
$\frac{d \mu}{\mu}=-\left(\frac{\mu}{\tau_c}\right)$ (13)
Integrating Eq. (13) on both sides, $\mu(t)=\left(e^{-\left(\frac{t}{\tau_c}\right)}\right) K$.
Considering steady state conditions, Eq. (10) can be simplified, leading to $-h A \mu+i^2 R_0=0$, and the deduction of a specific value $\mu$ as delineated in Eq. (14).
$\mu=\frac{i^2 R_0}{h A}$ (14)
From the aforementioned equations, Eq. (10) is further reduced to a more concise form $\mu(t)=K e^{-\left(\frac{t}{\tau_c}\right)}+\frac{i^2 R_0}{h A}$. Assuming an initial temperature at time t=0, the constant K is derived as shown in Eq. (15).
$K=\frac{-i^2 R_0}{h A}$ (15)
Subsequently, substituting the value of K into the equation results in $\mu(t)=\frac{i^2 R_0}{h A}\left(1-e^{-\left(\frac{t}{\tau_c}\right)}\right)$. Hence, the final form of the analytical approach equation of the lumped capacitance model is presented as Eq. (16).
$T(t)=T_{a m b}+\frac{i^2 R_0}{h A}\left(1-e^{-\left(\frac{t}{\tau_c}\right)}\right)$ (16)
The final form of the analytic approach equation of the lumped capacitance thermal model is presented as Eq. (16), illustrating that temperature is a function of time t, with negligible spatial temperature variation. The heat transfer is attributed solely to external convection, where the battery cell is situated in an external medium. The specific heat capacity Cp during battery discharge is assumed constant over the relevant temperature range, with average values for nickel cadmium and lithium manganese dioxide assumed as 1.131kJ/kg/K [22] and 0.823kJ/kg/K [23], respectively. The average specific heat capacity of a cell usually does not significantly vary with the weight, size of the cell considered, the capacity of the cell used and the direction of measurements [22]. Moreover, while considering the modeling of the lumped capacitance model, it is assumed as the physical and chemical properties of the body considered generally is assumed constant as they are independent of the temperature characteristics. The discharge duration t was experimentally determined, with the battery discharged from a full state of charge 4.2V to a cut-off voltage of 2.5V. During the experimental phase, the discharge duration of the battery was meticulously recorded. The depth of discharge was methodically measured in increments of 10%, ranging from 100 to 0. This granular data collection was pivotal in the development of the theoretical models. The time variable ‘t’, corresponding to these depth of discharge values, was integrally factored into the model design process. The thermal conductivity of the lithium polymer and nickel cadmium batteries were assumed to be 8.9 W/(m K) [24] and 4.3 W/(m K) respectively, with a heat transfer coefficient in the range of 10 W/(m2K) [25]. The calculated Biot numbers for lithium manganese dioxide and nickel cadmium batteries were 0.072 and 0.053, respectively, validating the application of the lumped capacitance model for these batteries. As mentioned before, the lumped capacitance model assumes a uniform temperature distribution, which is valid when the Bi is less than 0.1. However, a value greater than 0.1 indicates non-uniform temperature within the system, making the lumped system inappropriate for such scenarios.
In this study, the estimation of the internal resistance of the battery was conducted based on an analytic method developed by Tremblay et al. [26]. This approach involved establishing a relationship that correlates the rated capacity and nominal voltage of the chosen battery with its efficiency parameter. This analytical relation emerged from extensive empirical testing, involving more than 30 trials on a standard 1.2V battery cell. The results of these tests led to the conclusion that the initial internal resistance R0 of the battery could be accurately determined using this relation. Crucially, this relation has been demonstrated to align the model's discharge curves with those provided in the datasheets by the battery manufacturers. From these empirical tests, the efficiency ƞ of the battery was deduced to be approximately 99.5%. Consequently, based on these assumptions, the internal resistance of the battery cell was calculated using the formula presented in Eq. (17).
$R_0=V_{\text {nominal }}\left(\frac{1-\eta}{0.2 Q_{n o m i n a l}}\right)$ (17)
where, $V_{\text {nominal}}$ refers to the nominal voltage of the battery cell in (V) and $Q_{\text {nominal}}$ refers to the nominal capacity of the battery cell in (Ah). The model is based on various assumptions as proposed by the authors. The internal resistance of the cell is considered constant both during the process of charging and discharging of the battery cells. The parameters of the model were estimated during the process of discharge and assumed to be similar even during charging. The temperature does not affect the model's behavior. The selfdischarge and memory effect is absent. The Peukert's effect is absent.
In this study, the thermal behavior of battery cells was assessed using the numerical approach, specifically employing the fourth order Runge-Kutta method. Recognized for its computational intensity, the numerical approach’s accuracy hinges significantly on the volume and precision of data input into the mathematical algorithm. This approach is adept at predicting and simulating the behavior of systems under various operational conditions. The fourth order Runge-Kutta method, selected for this analysis, stands out for several advantages over alternative methods. Notably, it obviates the need for computing higher-order derivatives, which is a requisite in Taylor’s series method [27]. Additionally, compared to Euler’s method [28], this method requires smaller step sizes to achieve accurate solutions, enhancing its computational efficiency. In terms of accuracy, the fourth order Runge-Kutta method demonstrates superior precision relative to its lower-order counterparts. The technique has quite several benefits as compared to its counterparts in terms of accuracy, as the thermal behavior of the battery is generally considered to be a complex characteristic and precision is highly considered to capture the subtle changes in temperature over time. The method is numerically stable, as it can be applied for various time steps and initial boundary conditions. The method is generally said to converge relatively quicker to the solution, this making it efficient and superior for solving differential equations. The application of this method for thermal analysis in the current study is encapsulated in Eqs. (18) to (22), which detail the step-by-step process of temperature estimation during the battery discharge cycle.
$k 1=f(x i, y i)$ (18)
$k 2=f(x i,+12 h s, y i+12 k 1 h s)$ (19)
$k 3=f(x i,+12 h s, y i+12 k 2 h s)$ (20)
$k 4=f(x i,+h s, y i+k 3)$ (21)
$y i+1=y i+1~6(k 1+2 k 2+2 k 3+k 4) h s$ (22)
where, $h s$ signifies the sampling time for iterations, set at 0.1 for this analysis, and $y i+1$ is the final estimated result which corresponds to the estimated temperature in the study, $f$ ($x i$, $y i)$ represents the primary derivative of the temperature variable $y i . x i$ denotes the time based on which the variable $y i$ changes. The slope increments $k 1, k 2, k 3$ and $k 4$ are calculated at the beginning, middle, and end of the intervals during the iterations [29]. Although the Runge-Kutta method has been adopted in this study, the method must be chosen carefully considering few limitations such as when the system encounters discontinuities during the process, adaptive timestepping, accuracy trade-off and computational cost respectively.
Differing from the analytic approach, this numerical methodology accounts for the variation in the internal resistance of the battery cell, which fluctuates in response to temperature changes during charging and discharging cycles. The model for estimating the change in internal resistance during the discharge process was adopted from study [30]. When current flows through the initial internal resistance R0, Joule's heating effect is observed, leading to an increase in the overall temperature of the battery. This temperature rise, coupled with the thermal mass, heat transfer coefficient, and heat dissipation to the external environment, forms the basis of a differential equation. The relationship between the change in internal resistance and the battery cell temperature is articulated in Eq. (23).
$R(T)=R_0 \exp b_1 T+b_2 T^2 \pm \gamma$ (23)
where, $R(T)$ represents the thermal resistance, a function of temperature $T$, and $\gamma$ signifies the offset parameter.
To evaluate the thermal responses predicted by the analytical and numerical approaches of the lumped capacitance model, an experimental setup was established. This experiment focused on the charging and discharging processes of two types of battery cells: a lithium manganese dioxide (LiMnO2) cell and a nickel-cadmium (Ni-Cd) cell. These specific cells were selected due to their prevalent use in EVs. The characteristics of these battery cells had huge applications in electric vehicles as compared to other different chemistries. The low self-discharge, no or less memory effect and better energy and power densities provided a better option to choose these cells over others.
The experimental procedure involved charging and subsequently discharging the LiMnO2 and Ni-Cd cells at different C-rates. For the LiMnO2 cell, C-rates of 0.5C and 1C were applied, while for the Ni-Cd cell, the rates were set at 0.4C and 0.65C. The charging and discharging processes were facilitated using an ITECH IT6054B-1500-120 regenerative power system, which functioned as both a source and a load. This system was connected to a computer via an IEEE 488 GPIB bus. The lithium polymer-based battery was discharged for almost 2 and 1 hour respectively, whereas the nickel-cadmium battery was discharged for 2.5 hours and 1.5 hours respectively. The battery was usually charged for two hours using 0.5C as the C-rate to reach the maximum voltage for both the chemistries of the battery cells. Voltage and current measurements were recorded using SIGLENT SDM-3055SC multimeters. The zero and span calibration of the instruments was done to improve the accuracy and sensitivity of the instruments. The dc voltage measurement range of these instruments are from 200 mV to 1000 V and the dc current measurement range varies between 200 µA to 10 A respectively. Temperature monitoring was performed by affixing a J-type thermocouple to the surface of each battery which was calibrated before the initialization of the experiment. These thermocouples, based on Seebeck's effect and composed of Iron and Constantan, operate within a temperature range of -40℃ to +750℃. They exhibit a high static characteristic sensitivity of approximately 50 µV/℃ [31]. Data acquisition for temperature readings was conducted through a NI-based DAQ system, integrated with the experimental setup. The measurements, along with the settings of the power system and multimeters, were remotely logged and controlled using LabVIEW software. The physical dimensions of the prototype cells, specifically volume and density, were determined using a vernier caliper. The least count of the vernier caliper was 0.1mm for the study. The vernier caliper was calibrated initially using different positions to accurately determine the parameters for the purpose of the study. The additional details of the battery prototypes, including their specifications, were sourced from their respective datasheets. The specifications of the batteries utilized in the experiment are presented in Table 1.
Table 1. Specifications of the batteries
|
Battery Parameters |
Specifications of Different Chemistries |
|
LiMnO2 / Ni-Cd |
|
|
Battery type |
Efest IMR 18650 / Extracell-SC- NI-CD |
|
Nominal capacity (mAh) |
3000/ 2000 |
|
Nominal voltage (V) |
3.7/ 1.2 |
|
Maximum discharge current (A) |
20/10 |
|
Item weight (g) |
46.1/ 47 |
|
Cell height (m) |
0.0649/ 0.043 |
|
Cell diameter (m) |
0.0183/ 0.023 |
|
Cut-off voltage (V) |
2.5/ 1 |
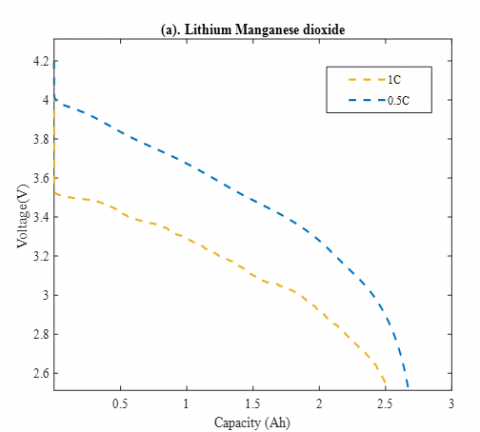
The study's findings align with the observations noted in researches [32, 33], indicating a significant decline in battery performance as the depth of discharge approaches 80% of capacity. This decline manifests as a fading life of the capacity in both LiMnO2 and Ni-Cd cells, confirming the phenomenon of capacity fading over time. Prior to life-cycle testing, the capacity of these battery prototypes was at its maximum, gradually decreasing with successive parametric checks, thus evidencing a reduction in performance over the battery's lifespan. The discharge curves of the LiMnO2 and Ni-Cd prototype cells are depicted in Figure 1 and Figure 2, respectively.
Figure 1. Discharge curve of LiMnO2 battery
Figure 2. Discharge curve of Ni-Cd battery
In the initial phase of analysis, the lumped capacitance thermal model's applicability was ascertained using the Biot number, with values in both cases being less than 0.1. Subsequently, the analytical and numerical approaches of the lumped capacitance model were implemented within the set constraints.
For the numerical approach, internal resistance was estimated in accordance with Eq. (23). The Generalized Reduced Gradient (GRG) method of non-linear curve fitting was employed to determine the variation in internal resistance relative to the depth of discharge and voltage. The objective function, chosen for minimization in the GRG algorithm, was the sum of squared deviations between the model, derived using Eq. (24), and the experimental voltage readings.
$V(t, T)=E(t)-i(t) * R(T)$ (24)
where, V represents the terminal voltage (V) obtained through the numerical approach, and E denotes the open circuit voltage (V). A smooth curve fitting facilitated the estimation of various parameters in Eqs. (23) and (24). The fourth order Runge-Kutta method was then applied in Matlab to predict the temperature corresponding to each depth of discharge. Figure 3 illustrates the comparative temperature profiles of the numerical approach against the experimental models for both the lithium polymer and nickel-cadmium cells. Additionally, Figure 4 presents the comparison of voltages obtained from experimental tests with those predicted by the model using the GRG method. Figure 5 showcases the variation in internal resistance relative to the depth of discharge of the batteries.
Figure 3. Comparison of thermal characteristics of Numerical approach models with the experimental models for different battery chemistries
Figure 4. Comparison of Voltage characteristics of Numerical approach models with the experimental models for different battery chemistries
Figure 5. Estimation of internal resistances for different battery chemistries
Figure 6. Comparison of thermal characteristics of Analytical approach models with the experimental models for different battery chemistries
The internal resistance for the Analytical approach model was deduced using Eq. (17), while the battery cell temperatures were estimated with Eq. (16). It was assumed that the convective heat transfer coefficient during the discharge process remained within 10W/m2 K. Surface areas of the selected batteries were calculated to be 0.0042m2 for the LiMnO2 cell and 0.0039m2 for the Ni-Cd cell. Ambient conditions were maintained throughout the experiment, with the initial temperature set to ambient levels for both approaches. The specific heat capacities for the Lithium polymer and Nickel Cadmium batteries were determined to be 0.823kJ/kg K and 1.13kJ/kg K, respectively. Upon analyzing the temperature responses from both the numerical and analytical approaches and comparing them with the experimental results, a notable correlation was observed. The numerical approach model showed a closer alignment with the experimental data compared to the analytical approach. This higher accuracy in the numerical approach can be attributed to the dynamic estimation of internal resistance throughout the discharge process, a factor considered critical in designing the lumped capacitance model of the batteries. As per existing literature [20, 22], the specific heat capacity was assumed to be constant, given its minimal variation during the discharge period. In contrast, the analytical approach model exhibited less precision in temperature prediction compared to the numerical approach with the experimental results as shown in Figure 6, primarily due to the assumption of constant internal resistance. The accuracy of the Numerical model when compared with the experimental results, was relatively better, however the results were not perfectly accurate match with the experimental results, due to the various assumptions of the parameters as constants. Moreover, if in case the parameters are determined for various intervals based on experiments or using look-up tables, the results will have much better accuracy. To enhance the understanding of temperature analysis using both models, statistical methodologies were applied and discussed below in detail.
6.1 Evaluation of the performances of two approaches based on statistical methodologies
In evaluating the performance of the analytical and numerical approaches against experimental results, an extensive analysis was conducted using various statistical methodologies. These methodologies, represented by Eqs. (25) to (29) [34-36], included mean absolute error (MAE), root mean square error (RMSE), correlation ratio (H), Willmott's index of agreement (d), and relative error (RE). The following error criterion techniques were chosen because they serve as the objective function for the process of optimization. They can be hyper tuned and help in decision making process based on the decision variables. These techniques help in validating the model with the reference variables. On comparison, they provide a clear feedback loop on the data with respect to the reference variables thereby providing a clear understanding of the techniques studied.
Mean Absolute Error (MAE) $=\sum_{i=1}^n \frac{\left|\left(x_p-x_o\right)\right|}{n}$ (25)
Root Mean Square Error (RMSE) $=\sqrt{\sum_{i=1}^n \frac{\left(x_p-x_o\right)^2}{n}}$ (26)
Correlation Ratio $H=\sqrt{1-\frac{\sum_{i=1}^n\left(x_o-x_p\right)^2}{\sum_{i=1}^n\left(x_i-\bar{x}\right)^2}}$ (27)
Willmott’s index of agreement
$d=1-\frac{\sum_{i=1}^n\left(x_p-x_o\right)^2}{\sum_{i=1}^n\left(\left|x_p-\bar{x}\right|+\left|x_o-\bar{x}\right|\right)^2}$ (28)
Relative Error $R E=\frac{R M S E}{\bar{x}}$ (29)
where, $x_p$ corresponds to the estimated values using the two approaches, $x_0$ represents the observed experimental data, $\bar{x}$ denotes the mean of the experimental data and $n$ represents the number of observations.
From the data in Table 2, it is evident that the numerical approach model exhibits superior performance compared to the analytical approach model. The statistical indicators clearly indicate the enhanced accuracy of the Numerical model in aligning with the experimental data.
Table 2. Comparison of the battery models using statistical indices
|
Model Approach |
Battery Type & C-Rate |
Statistical Performance and Error Estimation |
||||
|
MAE (K) |
RMSE (K) |
H (%) |
d |
RE |
||
|
Numerical Approach |
LiMnO2 (1C) |
0.32 |
0.46 |
0.99 |
0.99 |
0.001 |
|
LiMnO2 (0.5C) |
0.26 |
0.31 |
0.97 |
0.98 |
0.001 |
|
|
Nickel-Cd (0.4C) |
0.29 |
0.31 |
0.98 |
0.93 |
0.001 |
|
|
Nickel-cadmium (0.65C) |
0.30 |
0.36 |
0.98 |
0.98 |
0.001 |
|
|
Analytical Approach |
LiMnO2 (1C) |
0.68 |
0.80 |
0.98 |
0.97 |
0.002 |
|
LiMnO2 (0.5C) |
0.73 |
1.20 |
0.81 |
0.65 |
0.004 |
|
|
Nickel-Cd (0.4C) |
1.23 |
1.34 |
0.98 |
0.43 |
0.004 |
|
|
Nickel-cadmium (0.65C) |
1.32 |
1.58 |
0.94 |
0.60 |
0.005 |
|
This investigation has methodically explored two distinct approaches within the lumped capacitance parameter model for thermal management of cylindrical batteries, predominantly utilized in EVs: the analytical and numerical approaches. These methodologies were rigorously compared with experimental data to assess their efficacy. In the numerical approach, the internal resistance of the battery was dynamically estimated at varying depths of discharge, utilizing the GRG optimization algorithm. Conversely, the analytical approach, predicated on the assumption of static internal resistance, offered a less complex model but did not approximate the experimental data as closely as the Numerical approach. Despite the greater computational complexity of the numerical approach, its enhanced accuracy in aligning with experimental observations underscores its utility in battery thermal management modeling. While this study concentrated on two specific battery chemistries, it is recommended that future research extends to encompass a broader range of battery chemistries.
|
Acronyms |
|
|
BMS |
Battery Management System |
|
DAQ |
Data Acquisition Card |
|
DOD |
Depth of Discharge |
|
EV |
Electric Vehicles |
|
GRG |
Generalized Reduced Gradient method |
|
Li-ion |
Lithium-ion |
|
MAE |
Mean Absolute Error, K |
|
Ni-Cd |
Nickel-cadmium |
|
RE |
Relative Error |
|
RMSE |
Root Mean Square Error, K |
|
SOC |
State of Charge |
|
Symbols |
|
|
A |
Surface area of battery, m2 |
|
Bi |
Biot’s number, dimensionless |
|
cp |
Specific heat capacity of battery, kJ/kg K |
|
d |
Willmott’s index, dimensionless |
|
E(t) |
Open circuit voltage, V |
|
h |
Heat Transfer coefficient, W/ m2 K |
|
H |
Correlation coefficient, % |
|
hs |
Sampling time during the iteration |
|
i |
Current flow, A |
|
K |
Thermal conductivity, W/ m K |
|
L |
Length of the system, m |
|
M |
mass of the battery, kg |
|
N |
Number of experimental data |
|
Qnominal |
Nominal capacity, V |
|
R0 |
Internal resistance, $\Omega$ |
|
T |
Time, s |
|
Tamb |
Ambient temperature, K |
|
Ti |
Initial Temperature, K |
|
Tm |
Temperature of medium, K |
|
V |
Volume of battery, m3 |
|
Vnominal |
Nominal Voltage, V |
|
V(T) |
Terminal voltage, V |
|
xo |
Experimental values, K |
|
xp |
Predicted values using models, K |
|
Greek symbols |
|
|
$\alpha$ |
Inverse of time constant, s-1 |
|
$\gamma$ |
Offset parameter, m$\Omega$ |
|
$\eta$ |
Efficiency, % |
|
$\rho$ |
Density of battery, kg/ m3 |
[1] Sanguesa, J.A., Torres-Sanz, V., Garrido, P., Martinez, F., Marqez-Barja, F.J. (2021). A review on electric vehicles: Technologies and challenges. Smart Cities, 4(1): 372-404. https://doi.org/10.3390/smartcities4010022
[2] Marin-Garcia, G., Vazquez-Guzman, G., Sosa, J.M., Lopez, A.R., Martinez-Rodriguez, P.R., Langarica, D. (2020). Battery types and electrical models: A review. In 2020 IEEE International Autumn Meeting on Power, Electronics and Computing (ROPEC), Ixtapa, Mexico, pp. 1-6. https://doi.org/10.1109/ROPEC50909.2020.9258711
[3] Parhizi, M., Jain, A., Kilaz, G., Ostanek, J.K. (2022). Accelerating the numerical solution of thermal runaway in Li-ion batteries. Journal of Power Sources, 538: 231531. https://doi.org/10.1016/j.jpowsour.2022.231531
[4] Mossali, M., Picone, N., Gentilini, L., Rodriguez, O., Perez, J.M., Colledani, M. (2020). Lithium-ion batteries towards circular economy: A literature review of opportunities and issues of recycling treatments. Journal of Environmental Management, 264: 110500. https://doi.org/10.1016/j.jenvman.2020.110500
[5] Zahran, M., Atef, A. (2006). Electrical and thermal properties of NiCd battery for low earth orbit satellite’s applications. In Proceedings of the 6th WSEAS International Conference on Power Systems, Lisbon, Portugal, pp. 122-130.
[6] Castiglia, V., Miceli, R., Ala, G., Romano, P., Viola, F., Giglia, G., Imburgia, A., Schettino, G. (2019). Modelling, simulation and characterization of Li-Ion battery cell. In 2019 IEEE 5th International forum on Research and Technology for Society and Industry (RTSI), Florence, Italy, pp. 1-6. https://doi.org/10.1109/RTSI.2019.8895554
[7] Tamilselvi, S., Gunasundari, S., Karuppiah, N., Razak RK, A., Madhusudan, S., Nagarajan, V.M., Sathish, T., Shamim, M.Z.M., Saleel, C.A., Afzal, A. (2021). A review on battery modelling techniques. Sustainability, 13(18): 10042. https://doi.org/10.3390/su131810042
[8] Kumar, P., Chaudhary, D., Varshney, P., Varshney, U., Yahya, S.M., Rafat, Y. (2020). Critical review on battery thermal management and role of nanomaterial in heat transfer enhancement for electrical vehicle application. Journal of Energy Storage, 32: 102003. https://doi.org/10.1016/j.est.2020.102003
[9] Shabani, B., Biju, M. (2015). Theoretical modelling methods for thermal management of batteries. Energies, 8: 10153-10177. https://doi.org/10.3390/en80910153
[10] Denis, B. (2020). An overview of numerical and analytical methods for solving ordinary differential equations. arXiv Preprint, arXiv: 2012.07558. https://doi.org/10.48550/arXiv.2012.07558
[11] Zhang, X., Klein, R., Subbaraman, A., Chumakov, S., Li, X., Christensen, J., Linder, C., Kim, S.U. (2019). Evaluation of convective heat transfer coefficient and specific heat capacity of a lithium-ion battery using infrared camera and lumped capacitance method. Journal of Power Sources, 412: 552-558. https://doi.org/10.1016/j.jpowsour.2018.11.064
[12] Herrera, E.P., Calderon-Munoz, W.R., Orchard, M., Jaramillo, F., Medjaher, K. (2020). Thermal modeling approaches for a LiCoO2 lithium-ion battery-A comparative study with experimental validation. Batteries, 6(3): 40. https://doi.org/10.3390/batteries6030040
[13] Arumugam, A., Cipolletta, G., Delle Femine, A., Gallo, D., Landi, C., Luiso, M. (2022). Comparative analysis and validation of basic battery models for electric vehicles applications. In 2022 IEEE 12th International Workshop on Applied Measurements for power Systems (AMPS), Cagliari, Italy, pp. 1-6. https://doi.org/10.1109/AMPS55790.2022.9978895
[14] Buonomo, B., Manca, O., Menale, F., Nardini, S. (2022). Thermal control of lithium-ion batteries for electric cars by metal foam partially filled with phase change material. Journal of Physics Conference Series, 2385: 012058. https://doi.org/10.1088/1742-6596/2385/1/012058
[15] Soge, A.O., Willoughby, A.A., Dairo, O.F., Onatoyinbo, O.O. (2021). Cathode Materials for Lithium-ion Batteries: A brief review. Journal of New Materials for Electrochemical Systems, 24(4): 229-246. https://doi.org/10.14447/jnmes.v24i4.a02
[16] Cengel, Y.A., Cimbala, J.M., Turner, R.H. (2016). Fundamentals of Thermal-Fluid Sciences. Mc-Graw-Hill Education, New York.
[17] Sato, N. (2001). Thermal behavior analysis of lithium-ion batteries for electric and hybrid vehicles. Journal of Power Sources, 99(1-2): 70-77. https://doi.org/10.1016/S0378- 7753(01)00478-5
[18] Onda, K., Ohshima, T., Nakayama, M., Fukuda, K., Araki, T. (2005). Thermal behavior of small lithium-ion battery during rapid charge and discharge cycles. Journal of Power Sources, 158(1): 535-542. https://doi.org/10.1016/j.jpowsour.2005.08.049
[19] Jeon, D.H., Baek, S.M. (2011). Thermal modeling of cylindrical lithium ion battery during discharge cycle. Energy Conversion and Management, 52(8-9): 2973-2981. https://doi.org/10.1016/j.enconman.2011.04.013
[20] Vega, D.H., Kelouwani, S., Boulon, L. (2015). Efficient internal resistance and specific heat identification of li-ion battery at low temperature conditions. In 2015 IEEE Vehicle Power and Propulsion Conference (VPPC), Montreal, Quebec, Canada, pp. 1-6. https://doi.org/10.1109/VPPC.2015.7352939
[21] Tang, Y., Li, T., Cheng, X. (2018). Review of specific heat capacity determination of lithium-ion battery. Energy Procedia, 158: 4967-4973. https://doi.org/10.1016/j.egypro.2019.01.671
[22] Liebert, C.H. (1971). Heat-transfer experiments on a 34-ampere-hour nickel-cadmium cell. NASA Technical Memorandum.
[23] Roth, E.P. (2005). Final report to NASA JSC: Thermal abuse performance of MOLI, Panasonic and Sanyo 18650 li-ion cells. Sandia Report, SAND2004-6721. Sandia National Laboratories, California, USA. https://doi.org/10.2172/921604
[24] Yang, H., Savory, C.N., Morgan, B.J., Scanlon, D.O., Skelton, J.M., Walsh, A. (2020). Chemical trends in the lattice thermal conductivity of Li (Ni, Mn,Co) O2 (NMC) battery cathodes. Chemistry of Materials, 32(17): 7542-7550. https://doi.org/10.1021/acs.chemmater.0c02908
[25] The Engineering ToolBox (2003). Convective Heat Transfer.https://www.engineeringtoolbox.com/convective-heat-transfer-d_430.html, accessed on Mar. 18, 2023.
[26] Tremblay, O., Dessaint, L.A., Dekkiche, A.I. (2007). A generic battery model for the dynamic simulation of hybrid electric vehicles. In 2007 IEEE Vehicle Power and Propulsion Conference, Arlington, USA, pp. 284-289. https://doi.org/10.1109/VPPC.2007.4544139
[27] Gadisa, G., Garoma, H. (2017). Comparison of higher order Taylor’s method and Runge-Kutta methods for solving first order ordinary differential equations. Journal of Computer and Mathematical Sciences, 8(1): 12-23.
[28] Romeo, G. (2020). Elements of Numerical Mathematical Economics with Excel: Static and Dynamic optimization. Academic Press, ELSEVIER.
[29] Nurhakim, A., Ismail, N., Saputra, H.M., Uyun, S. (2018). Modified fourth-order runge-kutta method based on trapezoid approach. In 2018 4th International Conference on Wireless and Telematics (ICWT), Bali, Indonesia. https://doi.org/10.1109/ICWT.2018.8527811
[30] Neumann, D.E., Lichte, S. (2011). A multi-dimensional battery discharge model with thermal feedback applied to a lithium-ion battery pack. In NDIA Ground Vehicle Systems Engineering and Technology Symposium.
[31] Mehta, S., Chatterjee, B. (2019). Efficient modelling techniques for J-Type thermocouples in electric vehicle battery temperature monitoring system. In 2019 Innovations in Power and Advanced Computing Technologies (i-PACT), Vellore, India. https://doi.org/10.1109/i-PACT44901.2019.8960251
[32] Vaideeswaran, V., Bhuvanesh, S., Devasena, M. (2019). Battery management systems for electric vehicles using lithium ion batteries. In 2019 Innovations in Power and Advanced Computing Technologies (i-PACT), Vellore, India. https://doi.org/10.1109/i-PACT44901.2019.8959965
[33] Vellucci, F., Sglavo, V., Pede, G., Pasca, E., Malvaldi, V., Scalari, S. (2014). Life cycles test on a lithium battery system. In IECON 2014 - 40th Annual Conference of the IEEE Industrial Electronics Society, Dallas, TX, USA. https://doi.org/10.1109/IECON.2014.7048957
[34] Bogawski, P., Bednorz, E. (2014). Comparison and validation of selected evapotranspiration models for conditions in Poland (Central Europe). Water Resources Management, 28: 5021-5038. https://doi.org/10.1007/s11269- 014-0787-8
[35] Arumugam, A., Kibrom, H., Gebreamlak, M., Teame, M., Mengstu, M. (2022). Comparative analysis and validation of selected explicit equation models for determination of Darcy friction factor to estimate major head loss for a pressurized flow system. Science & Technology, 27(3): 216-235. https://doi.org/10.14456/scitechasia.2022.57
[36] Arumugam, A., Subramani, S., Kibrom, H., Gebreamlak, M., Mengstu, M., Teame, M. (2021). Comparison and validation of models for the design of optimal economic pipe diameters: A case study in the Anseba region, Eritrea. TecnoLo’gicas, 24(52): 58-83. https://doi.org/10.22430/22565337.1992