Md Safiullah Kayesh*![]() | Ashma Siddiqa
| Ashma Siddiqa![]()
© 2023 IIETA. This article is published by IIETA and is licensed under the CC BY 4.0 license (http://creativecommons.org/licenses/by/4.0/).
OPEN ACCESS
In pursuit of achieving developed country status by 2041, Bangladesh is committed to comprehensive socioeconomic development—a goal intrinsically tied to the critical task of securing a reliable, uninterrupted energy supply while optimizing utilization of available energy sources. This study used 1980–2018 annual data to examine the implications of energy transition and causal relationships among economic growth, renewable energy, and natural gas consumption in Bangladesh. A rigorous two-step process investigated the causal correlations among variables. The autoregressive distributive lag (ARDL) model was used to scrutinize long-term relationships, while a vector error correction (VEC) model was used to ascertain the directionality of these causal relationships. The outcomes of the bound tests conclusively revealed the presence of a long-run equilibrium relationship among the variables. Causality analyses indicated a unidirectional causal relationship from renewable energy consumption to economic growth in the long run and from natural gas consumption to economic growth in the short run. A bidirectional causal relationship was found between natural gas and renewable energy consumption in the long run. These findings underscore the potential of energy conservation strategies to catalyze economic growth and suggest an avenue for Bangladesh to achieve its ambitious socioeconomic development goals.
autoregressive distributive lag model, economic growth, granger causality, renewable energy consumption, vector error correction model
As an indispensable component of the production process, energy significantly propels the advancement of modern civilization. Economic growth is acknowledged to have considerable impact on energy consumption [1]. Reliance on fossil fuels to drive economic growth is progressively increasing, causing a rapid acceleration in global energy consumption. As noted by the International Energy Agency (IEA) in 2019, global energy consumption experienced its most substantial surge in the decade preceding 2018, escalating by a notable 2.3% [2]. This rise has resulted in a consequential increase in greenhouse gas emissions, triggering alarming global temperature spikes. The detrimental impacts of this shift are already discernible in numerous countries, prompting 190 nations to reach a consensus under the Paris Agreement to collectively mitigate greenhouse gas emissions and tackle global warming [3].
Given the imminent depletion of non-renewable energy sources due to their finite availability, renewable energy sources have emerged as sustainable alternatives. In response, many countries are transitioning towards renewable energy as a viable substitute for traditional fossil fuels. The global landscape of renewable electricity supply is currently undergoing substantial growth, with projections indicating an increase of 50% within the next 5 years [4]. According to 2020 report by the International Renewable Energy Agency (IRENA), total global capacity for generating renewable energy increased by 7.4% in 2019, with solar energy capacity expanding by 20% and wind energy capacity by 10% [5].
Bangladesh, one of the most rapidly growing economies in the Asia-Pacific region [6], has maintained an average economic growth of over 6% in the past 15 years, as reported by the International Monetary Fund (IMF) in 2018 [7]. This significant achievement is greatly facilitated by energy, and economic expansion results in an increased demand for energy. While renewable energy currently comprises less than 2.9% of the total electricity generation mix in Bangladesh, domestic natural gas contributes approximately 48% [8]. The energy sector in Bangladesh is predominantly dependent on domestic natural gas and imported crude oil. By 2017, Bangladesh had consumed 15.22 TCF of its available natural gas reserves, leaving a total reserve of 27.12 TCF. However, Shetol et al. [9] projected that these reserves to be sufficient only for the next decade. The Japan International Cooperation Agency (JICA) [10] has stressed that the absence of new gas reserve discoveries in Bangladesh could lead to significant gas supply problems, underlining the importance of renewable energy sources for the future of Bangladesh's sustainable energy sector.
The present study aimed to examine whether a move from non-renewable to renewable energy sources impacts economic growth. Further, understanding the causal correlation between economic growth and the adoption of renewable energies is crucial for formulating energy policies that and address environmental challenges. Despite the recent surge in renewable energy use, studies investigating the correlation between renewable energy consumption and economic growth have yielded disparate results, often due to variations in socioeconomic attributes among countries and differences in analysis periods, variable selection, and methodologies employed. Hence, these studies have identified diverse causal directions.
The causal relationship between renewable energy adoption and economic growth has typically been categorized by four hypotheses [11], as discussed in detail in the literature review section. The primary goal of this study is to examine the impact of energy transition and the relationships among renewable energy consumption, natural gas use, and economic growth in Bangladesh. The autoregressive (ARDL) approach introduced by Pesaran et al. [12] was employed for this purpose. A vector error correction (VEC) model was utilized to examine causality among these variables. With these tools, this study sought to enrich the understanding of the causal relationship between renewable energy consumption and economic growth and supplement existing literature. Given the limited research in emerging developing nations, such as Bangladesh, further empirical investigation of the relationship between renewable energy consumption and economic growth is warranted. While some studies have employed bivariate causality tests, this research adopted a multivariate system incorporating natural gas consumption to mitigate potential bias arising from omitted variables.
The first section of this study serves as an introduction to the topic, and the second section provides an overview of the current state of renewable energies in Bangladesh. The third section offers a comprehensive review of existing studies on the correlation between renewable energy consumption and economic growth. The fourth section presents theoretical models and data essential for analyzing the interconnections among renewable energy, natural gas consumption, and economic growth. Finally, the fifth section presents the empirical analysis results, involving rigorous testing of cointegration and causality. The concluding section summarizes the findings and presents policy implications.
Historically, non-renewable energy sources were dominant during the 19th century [13]. As a result, the global climate is now at risk, as most developed countries use fossil fuels extensively. However, global communities are increasingly focusing on renewable sources [14]. Given Bangladesh's geophysical position, it has tremendous renewable energy potential [15]. In the total electricity production of 23,548 megawatts (MW), renewable energy contributes 635.19 megawatts (MW), which satisfies the demand of a broad spectrum of the total population, as per the statistics of the Sustainable and Renewable Energy Development Authority (SREDA) [8]. Bangladesh's predominant renewable energy sources include solar power, hydroelectricity, wind energy, biogas, and biomass (Figure 1).
Figure 1. Types of renewable energies and their share in the electricity generation (made by authors using data from [8])
Table 1. Renewable energy’s share in electricity generation
|
Types of Reneable Energy |
Off-Grid (MW) |
On-Grid (MW) |
Total (MW) |
|
Solar |
319.9 |
81.36 |
401.26 |
|
Hydro |
0 |
230 |
230 |
|
Wind |
2 |
0.9 |
2.9 |
|
Biogas |
0.63 |
0 |
0.63 |
|
Biomass |
0.40 |
0 |
0.40 |
|
Total Energy |
322.93 |
312.26 |
635.19 |
Note: Off-grid and On-grid electricity share of different renewable energies [8].
2.1 Solar energy
Solar power is the world's leading clean and sustainable energy source. Considering its geographical location, Bangladesh has a significant capacity for harnessing solar energy; Halder et al. [16] reported an average daily solar radiation ranging from 4 to 4.5 kWh/m2 per day. An estimated 401.26 megawatts (MW) of electricity are currently produced from solar energy sources, contributing 3.2% of the country's overall renewable energy production (Table 1). Off-grid solar home systems significantly contribute to the total solar electricity production. Most solar energy comes from off-grid sources. According to the report of the global energy research organization Renewable Energy Policy Network for the 21st Century [17], Bangladesh has the most extensive solar home system (SHS) globally, with more than four million SHS units across the country. Thus, the report affirms and strengthens Bangladesh's positive outlook on solar energy.
2.2 Hydro energy
At present, hydropower continues to stand out as a primary renewable energy source, holding its position of dominance in the energy sector. In 2018, the total global electricity production from hydropower was 4,210 terawatt hours (TWh), or 15.77% of 26,700 TWh of global electricity [18]. According to Liu et al. [19], the only hydroelectric power plant in Bangladesh, the Karnafuli hydroelectric power plant, was established in 1962. This power plant generates 230 megawatts (MW), or 36.2% of the renewable electricity production (Table 1). Bangladesh has more potential as a hydroelectric energy source.
2.3 Wind energy
Currently, wind power is a rapidly expanding renewable energy source. Bangladesh has the world's longest coastal belt of approximately 724 km along the Bay of Bengal and is another potential renewable energy source. Currently, the total electricity generation capacity is 2.9 megawatts (MW) and accounts for only 0.46% of Bangladesh's overall renewable energy production (Table 1). Wind energy technology is still emerging in Bangladesh and requires more investment and technological development.
2.4 Biomass energy
According to Gumartini [20], biomass energy serves as a direct or indirect energy source for approximately 80% of Bangladesh’s population. Bangladesh’s weather is favorable for generating electricity from biomass. Biomass has a significant potential for electricity generation. Many types of agricultural waste and wood are sources of biomass. Hence, biomass energy has emerged as a favorable renewable energy option, particularly for countries reliant on agriculture, such as Bangladesh [16].
2.5 Biogas energy
Biogas is the most popular renewable energy source in Bangladesh. Animal and municipal wastes are used as raw materials in biogas plants. More than 45,000 biogas plants are currently in operation in Bangladesh. Usually, cow dung is used to produce gas for cooking and to generate power in households [21]. Thus, this source also has enormous prospects in the context of Bangladesh.
In the contemporary era, energy has played a paramount role as an indispensable component in the industrial sector. Although the connection between energy consumption and economic growth has been an area of scholarly inquiry for a significant duration, contemporary research and policy discourse have turned their focus toward a more detailed examination of this intricate relationship. However, conducting a comprehensive analysis of the relationship requires a meticulous evaluation of several pivotal factors. Each country typically possesses unique primary energy sources, comparative advantages, and energy policies, making it imperative to exercise caution when generalizing the energy-growth nexus. Additionally, when employing similar research methodologies, varying economic backgrounds in different countries can lead to contradictory findings.
Initially, nations tended to prioritize the exploitation of abundant and easily accessible indigenous energy sources, leading to a heavy reliance on non-renewable energy sources, such as fossil fuels. However, given this condition, projections indicate that the adoption of renewable energy sources can substantially affect the economy. Within this context, numerous scientific studies have meticulously examined the relationship between renewable energy consumption and economic growth, with an emphasis on fostering sustainable energy frameworks. Extensive research in the existing literature has been dedicated to exploring the presence of a causal link between these variables. The pioneering empirical study by Kraft and Kraft [22] was the first to investigate the energy-growth nexus in the United States, revealing unidirectional causality with economic growth influencing energy consumption. Subsequently, this area of research gained popularity among scholars, leading to an array of studies exploring the causal relationship between renewable energy consumption and economic growth, yielding diverse outcomes. The divergent findings in the literature can be attributed to disparities in datasets, time periods, variable combinations, and variations in econometric methodologies [23].
Within the current body of literature, four hypotheses can be empirically tested concerning the relationship between energy consumption and economic growth [23-26]. The first hypothesis, known as the growth hypothesis, posits that energy consumption is pivotal in promoting economic growth as a fundamental factor in the production process. According to this hypothesis, an increase in energy consumption positively impacts the real GDP. Conversely, this suggests that implementing energy conservation strategies may adversely affect economic growth [25]. The conservation hypothesis, in contrast proposes a unidirectional causal relationship between economic growth and energy consumption, indicating that economic growth drives energy demand [11]. In emerging countries with insufficient infrastructure and poor resource management, inefficiencies can lead to a notable decrease in demand for goods, services, and energy consumption, supporting the conservation hypothesis [26]. The third hypothesis, recognized as the feedback hypothesis, asserts a bidirectional causal relationship between energy consumption and economic growth, with each factor exerting influence on the other [24]. This hypothesis supports the association between energy consumption and economic growth, suggesting a complex interplay between the two factors [26]. The fourth hypothesis, the neutrality hypothesis, suggests no correlation between energy consumption and economic growth, indicating the absence of a causal relationship between these two variables [24]. As existing studies have examined these hypotheses in various countries, they can also be explicitly tested in the context of Bangladesh. Table 2 presents empirical studies that explore the relationship between economic growth and renewable energy consumption.
Table 2. A summary of the study focused on the nexus between renewable energy consumption and economic growth
|
Author |
Period and Country |
Method |
Research Findings |
|
1. Anser et al. [11] |
2003 to 2017, 8 South Asian countries |
Panel Vector Error Correction Model, Dynamic OLS estimation |
Growth hypothesis REC → GDP |
|
2. Lee and Jung [27] |
1995 to 2018, SAARC Countries |
Panel Vector Error Correction Model |
Growth hypothesis REC → GDP |
|
3. Mahjabeen et al. [28] |
1990 to 2016, D-8 countries |
ARDL, FMOLS, and DOLS |
Growth hypothesis REC → GDP |
|
4. Razmi et al. [29] |
1990 to 2014, Iran |
ARDL bounds tests, Error correction model |
Growth hypothesis REC→ GDP |
|
5. Shahbaz et al. [30] |
1990 to 2018, 38 renewable consuming countries |
Dynamic ordinary least squares, Heterogeneous non-causality approach, Fully modified OLS |
Growth hypothesis REC → GDP |
|
6. Amri [31] |
1980 to 2012, Algeria |
Bounds tests, Causality test |
Growth hypothesis REC → GDP |
|
7. Magazzino [32] |
1970 to 2007, Italy |
Toda -Yamamoto causality test |
Growth hypothesis REC → GDP |
|
8. Khawlah and Abdallah [33] |
1986 to 2012, Jordan |
Johanson cointegration test, Error correction model, Causality test |
Growth hypothesis REC → GDP |
|
9. Rahman and Velayutham [34] |
1990 to 2014, 5 South Asian countries |
Pedroni and Koe test, Panel Fully modified OLS, Dynamic OLS estimation techniques, Dumitrescu-Hurlin panel causality test |
Conservation hypothesis REC ← GDP |
|
10. Ocal and Aslan [35] |
1990 to 2010, Turkey |
ARDL bounds test, Toda-Yamamoto Granger causality test |
Conservation hypothesis REC ← GDP |
|
11. Eren et al. [36] |
1971 to 2015, India |
Dynamic OLS, Vector error correction model, Granger causality test |
Feedback hypothesis REC $\leftrightarrow$ GDP |
|
12. Khobai [37] |
1990 to 2014, Indonesia |
ARDL bounds tests, Vector error correction model |
Feedback hypothesis REC $\leftrightarrow$ GDP |
|
13. Ibrahiem [38] |
1980 to 2011, Egypt |
ARDL bounds tests, Granger causality test |
Feedback hypothesis REC $\leftrightarrow$ GDP |
|
14. Pao and Fu [39] |
1980 to 2010, Brazil |
Cointegration test, Error correction model, Granger causality test |
Feedback hypothesis REC $\leftrightarrow$ GDP |
|
15. Mahmoodi and Mahmoodi [40] |
1985 to 2007 7 Asian developing countries |
Panel causality test |
Feedback hypothesis REC $\leftrightarrow$ GDP |
|
16. Apergis and Pyne [24] |
1985 to 2005, 20 OECD countries |
Panel cointegration test, Panel Granger causality test |
Feedback hypothesis REC $\leftrightarrow$ GDP |
|
17. El-Karimi and EI Ghini [41] |
1980 to 2016, Morocco |
Toda-Yamamoto causality test |
Neutrality hypothesis REC X GDP |
|
18. Yildirim et al. [42] |
1949 to 2010, USA |
Toda-Yamamoto and Hatemi-J causality test |
Neutrality hypothesis, Growth hypothesis REC X GDP REC → GDP |
Note: REC and GDP denote renewable energy consumption and economic growth, respectively. Where as the symbol → and ← indicate unidirectional causality, whereas $\leftrightarrow$ and X imply bidirectional causality and no causality, respectively.
Source: Author own compilation
4.1 Data
This study employs data from 1980 to 2018 to examine the relationship between economic growth and energy consumption, focusing specifically on renewable energy and domestic natural gas in Bangladesh. The data sources were World Development Indicators (WDI) [43], The U.S. Energy Information Administration (EIA) [44], and British Petroleum (BP) [45] collect data on Gross Domestic Product (GDP) (constant 2010 US$), renewable energy consumption (quadrillion Btu), and natural gas consumption (mtoe).
4.2 Model specification
This study utilizes a multivariate regression model to examine the correlation between renewable energy consumption and economic growth in Bangladesh, allowing for an analysis of both the short- and long-term dynamics between these variables. The model is specified in the following manner:
$R E C_t=\beta_1+\beta_2 G D P_t+\beta_3 N G C_t+\varepsilon_t$ (1)
The log form of the Eq. (1) as:
$\operatorname{LnREC}_t=\beta_1+\beta_2 \operatorname{LnGDP}_t+\beta_3 L n N G C_t+\varepsilon_t$ (2)
where, variables are in natural logarithm form. $L n R E C_t$ represents renewable energy consumption, $L n G D P_t$ represents real GDP, $\operatorname{LnNGC}_t$ represents natural gas consumption and $\varepsilon_t$ represents the error term. In the first stage of the analysis, the long-run relationships among the variables are investigated through the ARDL method developed by Pesaran et al. [12]. The second step of the analysis involved investigating the causal relationships among the variables using the Vector Error Correction (VEC) model-based Granger causality test.
4.3 Cointegration analysis (Autoregressive Distributive Lag)
Pesaran and Shin [46] introduced the Autoregressive Distributive Lag (ARDL) bounds testing method, which was later refined and expanded upon by Pesaran et al. [12]. This method is widely utilized to examine the relationships between variables and has proven to be a valuable analytical approach. Compared with other commonly used cointegration tests, this method offers several advantages. This method can be used independently of the order of integration of the series, regardless of whether they are integrated with order zero (I(0)) or order one (I(1)). This suggests that there is no need for unit-root pre-testing in the ARDL approach. Second, this method can use a small sample, whereas larger samples require other conventional cointegration tests. Finally, this approach allows different variables to have different lags than those in other conventional cointegration tests [23].
4.4 Unit root test
The application of the ARDL method is contingent on the integrated order of the series, which should be either I(0), I(1), or a combination of both I(0) and I(1). However, unit-root pretesting does not require the ARDL method for cointegration. It is crucial to ascertain that none of the variables exhibits an integrated order of two (I(2)) before proceeding with the analysis. Augmented Dickey-Fuller (ADF) [47] and Phillips-Perron (PP) [48] tests were conducted to assess the stationarity and integration order of all series, and these tests help evaluate the characteristics of stationarity and integration exhibited by the series being examined. Moreover, the robustness of the results was verified using both tests.
4.5 Cointegration test
The following equations express the ARDL model using a cointegration relationship:
$\begin{aligned} & \Delta L n R E C_t=\alpha_0+\sum_{i=1}^p \alpha_{1 i} \Delta L n R E C_{t-i} \\ & +\sum_{i=0}^q \alpha_{2 i} \Delta L n G D P_{t-i} \\ & +\sum_{i=0}^r \alpha_{3 i} \Delta L n N G C_{t-i} \\ & +\alpha_4 \operatorname{LnREC_{t-1}}+\alpha_5 \operatorname{LnGDP_{t-1}} \\ & +\alpha_6 L n N G C_{t-1}+u_t \\ & \end{aligned}$ (3)
$\begin{aligned} & \Delta L n G D P_t=\beta_0+\sum_{i=1}^p \beta_{1 i} \Delta L n G D P_{t-i} \\ & +\sum_{i=0}^q \beta_{2 i} \Delta L n N G C_{t-i} \\ & +\sum_{i=0}^r \beta_{3 i} \Delta \operatorname{LnREC_{t-i}} \\ & +\beta_4 \operatorname{LnREC}_{t-1}+\beta_5 \operatorname{LnGDP_{t-1}} \\ & +\beta_6 L n N G C_{t-1}+u_t \\ & \end{aligned}$ (4)
$\begin{aligned} & \Delta L n N G C_t=\gamma_0+\sum_{i=1}^p \gamma_{1 i} \Delta L n N G C_{t-i} \\ & +\sum_{i=0}^q \gamma_{2 i} \Delta \operatorname{LnREC_{t-i}} \\ & +\sum_{i=0}^r \gamma_{3 i} \Delta L n G D P_{t-i} \\ & +\gamma_4 L n R E C_{t-1}+\gamma_5 \operatorname{LnGDP_{t-1}} \\ & +\gamma_6 L n N G C_{t-1}+u_t \\ & \end{aligned}$ (5)
where, each variable is expressed in its natural logarithmic form. LnREC, LnGDP, and LnNGC are renewable energy consumption, real GDP, and natural gas consumption respectively. $u_t$ is the error term, and $\Delta$ is the first difference operator. We determined the proper lag for the study using the Akaike Information Criterion (AIC).
The cointegration analysis employs the bounds test, which relies on the combined F-statistic. The null hypothesis of no cointegration in Eqs. (3)-(5) can be expressed as H0: αk = 0, βk = 0, γk = 0 for k = 4, 5 and 6, respectively. Cointegration was determined using two sets of critical values. The null hypothesis was rejected when the test statistic exceeded the corresponding critical value and cannot be rejected if the test statistic is lower than the critical value. If the test statistic falls within the critical range, the co-integration test does not yield definitive evidence and is considered inconclusive. We examined the error correction term within the ARDL model to confirm the existence of cointegration among the variables. Two sets of critical values obtained from different sources were used for assessment. Pesaran et al. [12] specify critical values for sample sizes of 500 and 1000 observations, while Narayan [49] offers critical values that cover a range of sample sizes from 30 to 80 observations. Critical values were to use the sign and statistical significance of the error-correction. This study was based on a dataset comprising annual data, with a limited sample size. Hence, this study employs the critical values from Narayan [49], assuming that one variable in the ARDL model is I(0), whereas the remaining variables are assumed to be I(1). When cointegration exists among the variables, the long-term model and short-term dynamics can be described as follows:
Long-run models
$\begin{aligned} \operatorname{LnREC}_t=\alpha_0+ & \Sigma_{i=1}^p \alpha_{1 i} \operatorname{LnREC}_{t-i} \\ & +\sum_{i=0}^q \alpha_{2 i} \operatorname{LnGDP}_{t-i} \\ & +\sum_{i=0}^r \alpha_{3 i} \operatorname{LnNGC}_{t-i}+v_t\end{aligned}$ (6)
$\begin{aligned} \operatorname{LnGDP}_t=\beta_0+ & \sum_{i=1}^p \beta_{1 i} \operatorname{Ln} G D P_{t-i} \\ & +\sum_{i=0}^q \beta_{2 i} \operatorname{Ln} N G C_{t-i} \\ & +\sum_{i=0}^r \beta_{3 i} \operatorname{LnREC}_{t-i}+v_t\end{aligned}$ (7)
$\begin{aligned} \operatorname{LnNGC}_t=\gamma_0+ & \Sigma_{i=1}^p \gamma_{1 i} \operatorname{LnNGC}_{t-i} \\ & +\sum_{i=0}^q \gamma_{2 i} \operatorname{LnREC}_{t-i} \\ & +\sum_{i=0}^r \gamma_{3 i} \operatorname{LnGDP}_{t-i}+v_t\end{aligned}$ (8)
Short-run models
$\begin{aligned} \Delta \operatorname{LnREC}_t=\alpha_0+ & \sum_{i=1}^p \alpha_{1 i} \Delta \operatorname{LnREC}_{t-i} \\ & +\sum_{i=0}^q \alpha_{2 i} \Delta \operatorname{LnGDP}_{t-i} \\ & +\sum_{i=0}^r \alpha_{3 i} \Delta \operatorname{LnNGC}_{t-i}+\delta_1 \epsilon_{t-1} \\ & +e_t\end{aligned}$ (9)
$\begin{aligned} \Delta \operatorname{LnGDP}_t=\beta_0+ & \sum_{i=1}^p \beta_{1 i} \Delta \operatorname{LnGDP}_{t-i} \\ & +\sum_{i=0}^q \beta_{2 i} \Delta \operatorname{LnNGC}_{t-i} \\ & +\sum_{i=0}^r \beta_{3 i} \Delta \operatorname{LnREC}_{t-i}+\delta_2 \epsilon_{t-1} \\ & +e_t\end{aligned}$ (10)
$\begin{aligned} \triangle L n N G C_t=\gamma_0+ & \sum_{i=1}^p \gamma_{1 i} \Delta \operatorname{LnNGC}_{t-i} \\ & +\sum_{i=0}^q \gamma_{2 i} \Delta \operatorname{LnREC}_{t-i} \\ & +\sum_{i=0}^r \gamma_{3 i} \Delta \operatorname{LnGDP}_{t-i}+\delta_3 \epsilon_{t-1} \\ & +e_t\end{aligned}$ (11)
where, $\delta$ is the coefficient of error-correction term $\left(\epsilon_{t-1}\right)$ acquired from the long-run equilibrium model. It provides the indication of the rate at which variables move towards equilibrium, and the coefficient with a negative sign is expected to have a statistically significant value, as highlighted by Kremers et al. [50].
4.6 Causality analysis
ARDL cointegration was employed to ascertain long-run relationship between the variables. Engle and Granger [51] proposed that the cointegration between variables indicates a possible causal relationship in at least one direction. Granger causality refers to the concept that if the previous values of a time series, $X_t$ precede the value of another time series, $Y_t$, then $X_t$ is considered to have a Granger-causal relationship with $Y_t$. Nonetheless, the ARDL model does not provide information regarding the causal direction between variables. Furthermore, conducting a causality analysis using a vector model with an error term confirms the existence of a causal relationship, even if the estimated coefficients of the lagged variables of interest are not statistically significant. The VEC model is employed to investigate the presence of Granger causality in both the short and long terms between pairs of variables. The Eqs. (12)-(14) of the VEC model were reformulated to incorporate the relationships described in Eqs. (9)-(11).
$\begin{aligned} \triangle \operatorname{LnREC}_t=c_1+ & \sum_{i=1}^n \beta_{11 i} \Delta \operatorname{LnREC}_{t-i} \\ & +\sum_{i=1}^n \beta_{12 i} \Delta \operatorname{LnGDP}_{t-i} \\ & +\sum_{i=1}^n \beta_{13 i} \Delta \operatorname{LnNGC}_{t-i}+\lambda_1 \epsilon_{t-1} \\ & +\omega_{1 \mathrm{t}}\end{aligned}$ (12)
$\begin{aligned} \Delta {LnGDP}_t=c_2+ & \sum_{i=1}^n \beta_{21 i} \Delta \operatorname{LnREC}_{t-i} \\ & +\sum_{i=1}^n \beta_{22 i} \Delta \operatorname{LnGDP}_{t-i} \\ & +\sum_{i=1}^n \beta_{23 i} \Delta \operatorname{LnNGC}_{t-i}+\lambda_2 \epsilon_{t-1} \\ & +\omega_{2 t}\end{aligned}$ (13)
$\begin{aligned} \Delta {LnNGC}_t=c_3+ & \sum_{i=1}^n \beta_{31 i} \Delta {LnREC}_{t-i} \\ & +\sum_{i=1}^n \beta_{32 i} \Delta {LnGDP}_{t-i} \\ & +\sum_{i=1}^n \beta_{33 i} \Delta {LnNG}_{t-i}+\lambda_3 \epsilon_{t-1} \\ & +\omega_{3 \mathrm{t}}\end{aligned}$ (14)
Short and long-run causality can be evaluated by testing the variables in each equation. Short-term causality can be examined by considering the variables in their first differences, while long-term causality can be assessed by incorporating the error correction terms derived from the long-run models. If the null hypothesis ( $H_0: \beta_{21 i}=0$ for all i ) is rejected in Eq. (13), indicates the presence of short-run Granger causality from Renewable Energy Consumption (REC) to Gross Domestic Product (GDP). In the short term, the findings provide evidence of a causal relationship between REC and GDP. In contrast, the error correction term ($\epsilon_{t-1}$) signifies the long-term causal relationship in the equation. The coefficient values demonstrate the speed at which the system adjust deviations from the long-run equilibrium, as indicated by the error term $\epsilon_{t-1}$. Thus, long-run causalities can be found by testing $H_0: \lambda_i=0$ for all $i$ in Eqs. (12)-(14). Finally, strong causalities are examined by joint F-tests: $H_0: \beta_{12 i}=\lambda_i=0$ and $H_0: \beta_{13 i}=\lambda_i=0$ for all $i$ in Eq. (12).
5.1 Descriptive statistics
Table 3 presents a condensed overview of the variables’ descriptive statistics. The results suggest that all the variables exhibit positive average values, while their standard deviations remain comparatively low. The Jarque-Bera test, along with the overall findings, indicates that all the series follow a normal distribution.
Table 3. Descriptive statistics
|
|
LnREC |
LnGDP |
LnNGC |
|
Mean |
0.008 |
24.906 |
1.892 |
|
Median |
0.008 |
24.853 |
1.931 |
|
Maximum |
0.013 |
25.916 |
3.132 |
|
Minimum |
0.004 |
24.077 |
0.157 |
|
Std. Dev. |
0.002 |
0.543 |
0.878 |
|
Skewness |
0.349 |
0.247 |
-0.351 |
|
Kurtosis |
2.746 |
1.862 |
2.080 |
|
Jarque-Bera |
0.873a |
2.436a |
2.121a |
|
Probability |
0.646 |
0.295 |
0.346 |
|
Sum |
0.324 |
946.446 |
71.917 |
|
Sum Sq. Dev. |
0.000 |
10.938 |
28.523 |
|
Observations |
38 |
38 |
38 |
Notes: a represents the rejection of the null hypothesis at 1% level of significance.
5.2 Unit roots test results
This study uses the ADF and PP unit root tests to determine the integration order for the series under investigation, and the results of both tests are documented and presented in Table 4. To apply the ARDL approach, it is necessary for variables to exhibit either zero-order integration (I(0)) or first-order integration (I(1)). Based on the results, real GDP and natural gas consumption are found to be non-stationary at the levels, with the exception of renewable energy consumption. However, all variables show stationarity once the first difference is considered. These findings validate the series integration order and underscore the importance of determining the appropriate lag order when investigating the cointegration relationship using the ARDL approach. This study employed several lag-order approaches to figure out the appropriate lag order. AIC is specifically utilized to identify the optimal lags for the first differentiated variables in the unrestricted models and to assess the associations among the variables.
Table 4. Results of the ADF and PP unit root tests both at levels and first difference
|
Variable |
Augmented Dickey-Fuller(ADF) |
Phillips-Perron (PP) |
||||||||
|
Unit Root Tests |
Unit Root Tests |
|||||||||
|
Level |
First-differences |
Level |
First-differences |
|||||||
|
I |
T & I |
I |
T & I |
I |
T & I |
I |
T & I |
Status |
Order of integration |
|
|
LnREC |
-3.663 (0.009) |
-4.145a (0.012) |
-8.816 (0.000) |
-8.683 (0.000) |
-0.712 (0.831) |
-4.866a (0.001) |
-15.925 (0.000) |
-16.634 (0.000) |
Stationary at level |
I(0) |
|
LnGDP |
5.597 (1.000) |
0.733 (0.999) |
-1.668 (0.437) |
-8.312a (0.000) |
5.972 (1.000) |
0.859 (0.999) |
-3.842 (0.005) |
-10.649a (0.000) |
Stationary at first difference |
I(1) |
|
LnNGC |
-2.319 (0.172) |
-1.600 (0.773) |
-2.544 (0.114) |
-3.284 (0.086) |
-3.519 (0.012) |
-1.419 (0.834) |
-6.273 (0.000) |
-8.273a (0.000) |
Stationary at first difference |
I(1) |
Notes: I represents intercept, T and I represents trend and intercept; a and b show the rejection of null hypothesis at the 1 percent and 5 percent levels of significance, respectively (Author’s calculations).
5.3 Analysis of cointegration
We employed the ARDL bounds testing method and conducted an F-test in Eqs. (3)-(5) using the lag length that best fits the data. The motive for this test is to validate the presence of a long-run equilibrium among the variables. The results are presented in Table 5, which exhibit the presence of cointegrating relationships among the dependent variables, namely, renewable energy consumption, real GDP, and natural gas consumption, all at statistically significant levels of 1 percent and 5 percent.
To further confirm the presence of a long-term relationship among the variables, we examine error term’s coefficient in Table 6, following the approach proposed by Kremers et al. [50]. The objective of this analysis was to validate the presence of a long-run relationship among the variables, as stated by Kremers et al. [50]. Our findings reveal long-run relationships among the variables.
Moreover, the results demonstrate that any shocks or disturbances between the variables contribute to short-term instability. However, these short-term fluctuations are eventually corrected through short-run adjustments in the long run. The absolute value of the error correction term shows a long-run relationship between variables. Additionally, it signifies the rate at which short-run adjustments occur, ultimately facilitating the restoration of long-run equilibrium. With a coefficient of 0.685 in Table 6, it is evident that approximately 68.5 percent of the year is dedicated to the adjustment process for long-run equilibrium when external shocks lead to long-run disequilibrium among variables. This highlights the significance of understanding the dynamics of these relationships and the time it takes for a system to return to its long-term balance after any disturbance.
Table 5. ARDL bounding test for cointegration based on the model
|
Dependent Variable |
Cointegration Hypotheses |
Selected Model |
F-statistics |
Decision |
|
|
LnREC |
F(LnREC| LnGDP,LnNGC) |
(1,0,0) |
5.690b |
Cointegration |
|
|
LnGDP |
F(LnGDP| LnREC,LnNGC) |
(1,1,1) |
9.626a |
Cointegration |
|
|
LnNGC |
F(LnNGC| LnREC,LnGDD) |
(1,0,4) |
7.790b |
Cointegration |
|
|
Asymptotic critical values |
|||||
|
1% |
5% |
10% |
|||
|
I(0) |
I(1) |
I(0) |
I(1) |
I(0) |
I(1) |
|
5.15 |
6.36 |
3.79 |
4.85 |
3.17 |
4.14 |
Note: a and b indicate significance level at 1 percent and 5 percent respectively (Author’s calculations).
Table 6. Coefficients of error correction term in the ARDL model based on the model
|
Dependent Variable |
Coefficients of Error Correction Term |
t-statistics (p-value) |
|
LnREC |
-0.685a |
-4.255(0.000) |
|
LnGDP |
0.037a |
5.544(0.000) |
|
LnNGC |
-0.127a |
-5.016(0.000) |
Note: a Indicates significance level at 1 percent (Author’s calculations).
5.4 Causality test results derived from the error correction model
The findings of the comprehensive causality analysis revealed both short- and long-term relationships among the variables, as presented in Tables 7 and 8. Specifically, this study delves into the causality between GDP, REC, and NGC, examining their interconnections over time. In terms of long-term causality, the coefficients of the error correction term show statistically significant negative values at the 1 percent level. This suggests a long-term causal link from GDP and natural gas consumption (NGC) to renewable energy consumption (REC), indicating that changes in GDP and natural gas consumption substantially influence the amount of renewable energy consumption. Our initial findings underscore the existence of robust and unidirectional long-term Granger causalities originating from the real GDP, leading to an escalation in renewable energy consumption. However, our analysis does not reveal any short-term causality between these pivotal variables, indicating that the relationship is more complex and may require further investigation.
Table 7. Causality test results from the error correction model
|
Dependent Variables |
Short-Run Causality |
Long-Run Causality |
Strong Causality |
||||
|
ΔLnREC |
ΔLnGDP |
ΔLnNGC |
$\epsilon_{t-1}$ |
ΔLnREC$\epsilon_{t-1}$ |
ΔLnGDP$\epsilon_{t-1}$ |
ΔLnNGC$\epsilon_{t-1}$ |
|
|
F-statistics |
t-statistics |
F-statistics |
|||||
|
ΔLnREC |
- |
0.691 (0.509) |
2.727 (0.083) |
-3.720a (0.000) |
- |
4.860a (0.007) |
5.001a (0.006) |
|
ΔLnGDP |
0.604 (0.553) |
- |
3.532b (0.043) |
0.047 (0.962) |
0.526 (0.667) |
- |
2.556 (0.076) |
|
ΔLnNGC |
3.888b (0.032) |
1.305 (0.287) |
- |
3.098a (0.004) |
3.606b (0.026) |
4.466a (0.011) |
- |
Note: a and b indicate the significance level at 1 percent and 5 percent, respectively (Author’s calculations).
Table 8. Summary of the results of Granger causality test according to VEC Model
|
Directional of Causality |
Short-Run (F-statistics) |
Long-Run (ECTt-1) |
|
GDP causes REC |
No |
At 1% significance level |
|
NGC causes REC |
No |
At 1% significance level |
|
REC causes GDP |
No |
No |
|
NGC causes GDP |
At 5% significance level |
No |
|
REC causes NGC |
At 5% significance level |
At 1% significance level |
|
GDP causes NGC |
No |
At 1% significance level |
These empirical findings are consistent with seminal works by Lee and Jung [27], Saad and Taleb [52], Ocal and Aslan [35], and Ziramba [53], adding to the robustness of our conclusions. The conservation hypothesis has gained empirical substantiation, advocating a direct causal association between economic growth and the upswing in renewable energy consumption. Thus, energy efficiency measures might not exert significant effects on economic growth in the long run; instead, they serve as crucial measures aimed at mitigating greenhouse gas emissions.
Additionally, this study uncovered bidirectional long-term causal relationships and significant Granger causality between the consumption of natural gas and renewable energy. Moreover, we observed unidirectional short-term Granger causality from natural gas consumption to renewable energy consumption. This aligns with results reported by Dong et al. [54], Sharif et al. [55], Kahia et al. [56], and Apergis and Payne [57], thus providing empirical evidence in favor of the feedback hypothesis concerning the effective link between natural gas consumption and renewable energy adoption.
From a broader perspective, renewable energy has emerged as a viable alternative to nonrenewable energy sources, including natural gas, which is currently one of Bangladesh's most affordable energy options. The extensive use of natural gas in various sectors such as industries, filling stations, and cooking households significantly influences the trajectory of renewable energy consumption. Excessive exploitation of natural gas reserves poses a risk of depletion, necessitating an inevitable transition towards renewable energy alternatives. Therefore, it is of the utmost importance to maintain an optimal energy mix that balances both sources.
Our study does not yield compelling evidence of strong and long-term Granger causality from natural gas consumption to real GDP in the linkage between NGC and real GDP. However, we observe unidirectional short-term Granger causality from natural gas consumption to GDP. This finding aligns with a previous study by Das et al. [58], Destek [59], and Shahbaz et al. [30]. Nevertheless, Asghar [60] reported an alternate perspective by observing a one-way causal relationship between these two variables in the short term. This observation highlights significance of the energy-led growth hypothesis in the short term, suggesting that conservation policies may exert limited influence on GDP over an extended period, but their impact may be more pronounced in the short term.
Therefore, this study provides valuable insights into the intricate causal relationships between GDP, natural gas consumption, and renewable energy consumption, unraveling both short- and long-term dynamics. Empirical evidence supports the conservation hypothesis and highlights the prospects of renewable energy to serve as a viable substitute for non-renewable sources, making it essential to strike an optimal balance in the energy mix for sustainable economic development and environmental preservation.
Diagnostic tests suggest that the error term conforms to normal distribution. There is no evidence of serial correlation or autoregressive conditional heteroskedasticity (ARCH) problems, as shown in Table 9.
Table 9. Diagnostic tests
|
Test |
F-statistics |
|
Breusch-Godfrey Serial Correlation test |
0.378 (0.542) |
|
Heteroskedasticity test (ARCH) |
1.788 (0.155) |
|
Normality test |
1.892 (0.388) |
Notes: The numbers in parentheses below the statistics are p-values (Authors calculation).
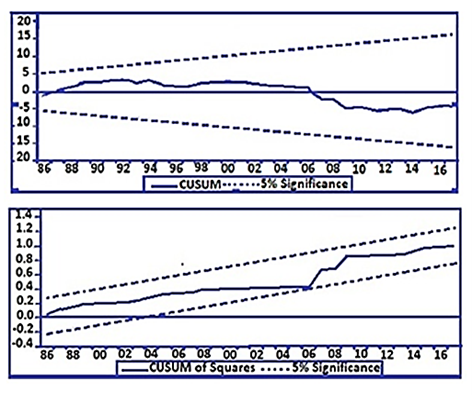
According to Pesaran and Pesaran [61], cumulative sum of recursive residuals (CUSUM) and cumulative sum of squares (CUSUMSQ) tests were applied to assess the stability of the parameters. The CUSUM test seeks to identify systematic alterations in regression coefficients, whereas the CUSUMSQ test is designed to detect sudden variations. In Figure 2, the results demonstrate that the parameters in the model are stable because both fall within the specified threshold critical bounds at a significant level over the period.
Figure 2. Plot of CUSUM and CUSUMSQ of recursive residuals
The present global energy sector is more diverse than ever before, yet non-renewable energies still dominate, and the role of fossil fuels needs to be addressed. Countries are focusing increasingly on sustainable, efficient, and renewable energy sources. Bangladesh has been increasing its use of renewable energies, which has positively impacted electrification and energy access. This study looked at the shift from conventional energy sources to sustainable energy sources and the short and long run relationship between energy consumption and economic growth in Bangladesh from 1980 to 2018. It found a robust causal association between these two variables, suggesting that an increase in the use of renewable energy stimulates economic growth or contributes to it. This finding raises a concern about policy direction regarding the changing proportion of renewable energy in the overall energy composition. Adopting renewable energy helps decrease reliance on non-renewable sources and improves environmental quality.
Whether renewable energy consumption can drive sustainable economic growth in Bangladesh remains to be seen. This study’s findings suggest a unidirectional long-term relationship and robust causal association from renewable energy consumption to economic growth, without any supporting confirmation of a short-term causal relationship between the two variables. The study affirms the credibility of the conservation hypothesis, suggesting that economic growth is a significant contributor to the increase in the use of renewable energy consumption in Bangladesh.
On the contrary, domestic natural gas consumption also has a direct impact on economic growth in Bangladesh. In the short term, an increase in natural gas consumption positively affects renewable energy consumption, while in the long term, they mutually influence and reinforce each other. This study suggests that adopting energy conservation policies in Bangladesh can lead to long-term reforms in energy consumption and foster economic growth.
The World Bank and United Nations emphasize the importance of energy conservation in sustainable development and Bangladesh's government has adopted an action plan to strengthen energy efficiency strategies. An energy conservation policy can improve mismanagement in the energy sector, save more energy, and reduce the excessive burden of domestic natural gas in Bangladesh. Further investment in sustainable energy sources in this country is necessary to promote the growth of renewable energy consumption. The private sector has contributed significantly to Bangladesh's economic development, but government investment still dominates the energy sector. Energy policy should consider energy security, cost efficiency, environmental friendliness, safety, and utilizing the country's available resources and technology.
Finally, this study acknowledges that data availability and collection circumstances may introduce bias, and including more variables can lead to more diverse conclusions. Although the primary emphasis of this research was examining the use of renewable energy and natural gas, it is crucial to consider other energy sources, such as petroleum and liquefied petroleum gas (LPG), when investigating the relationship between energy consumption and economic growth. Multidimensional research considering various factors would be a valuable reference for establishing policies.
Data available in a publicly accessible repository. The data presented in this study are openly available in websites [5, 16, 32, 44].
We thank the anonymous referees for their valuable suggestions.
[1] Ouedraogo, N. (2013). Energy consumption and economic growth: Evidence from the economic community of West African States (ECOWAS). Energy Economics, 36: 637-647. https://doi.org/10.1016/j.eneco.2012.11.011
[2] Global energy demand rose by 2.3% in 2018, its fastest pace in the last decade. (2019). International Energy Agency (IEA). https://www.iea.org/news/global-energy-demand-rose-by-23-in-2018-its-fastest-pace-in-the-last-decade, accessed on Mar. 28, 2019.
[3] Paris climate agreement: Everything you need to know (2021). NRDC. https://www.nrdc.org/stories/paris-climate-agreement-everything-you-need-know#sec-whatis.
[4] Ambrose, J. (2019). Renewable energy to expand by 50% in next five years–Report. The Guardian, International Energy Agency. https://iea.blob.core.windows.net/assets/a846e5cf-ca7d-4a1f-a81b-ba1499f2cc07/Renewables_2019.pdf.
[5] Renewable capacity highlights. (2020). International Renewable Energy Agency (IRENA). https://www.irena.org/-/media/Files/IRENA/Agency/Publication/2020/Mar/IRENA_RE_Capacity_Highlights_2020.pdf?la=en&hash=B6BDF8C3306D271327729B9F9C9AF5F1274FE30B.
[6] Emerging Market Growth Opportunities in Bangladesh, forecast to 2024 - Driven by export-led growth, robust private consumption, and high volumes of public sector investment. (2019). GlobeNewswire News Room, Bangladesh.
[7] IMF country report. (2018). Report No. 18/158, Bangladesh. https://www.imf.org/~/media/Files/Publications/CR/2018/cr18158.ashx, accessed on Jun. 8, 2018.
[8] RE Generation Mix. (2020). National database of renewable energy. https://ndre.sreda.gov.bd/index.php?id=4.
[9] Shetol, H.M., Moklesur Rahman, M., Sarder, R., Hossain, I.M., Riday, K.F. (2019). Present status of Bangladesh gas fields and future development: A review. Journal of Natural Gas Geoscience, 4(6): 347-354. https://doi.org/10.1016/j.jnggs.2019.10.005
[10] Signing of Japanese ODA loan agreement with the People’s Republic of Bangladesh. (2020). https://openjicareport.jica.go.jp/pdf/12066122_01.pdf.
[11] Anser, M.K., Shabbir, M.S., Tabash, M.I., Shah, S.H., Ahmad, M., Peng, M.Y., Lopez, L.B. (2021). Do renewable energy sources improve clean environmental-economic growth? Empirical investigation from South Asian economies. Energy Exploration & Exploitation, 39(5): 1491-1514. https://doi.org/10.1177/01445987211002278
[12] Pesaran, M.H., Shin, Y., Smith, R.J. (2001). Bounds testing approaches to the analysis of level relationships. Journal of Applied Econometrics, 16(3): 289-326. https://doi.org/10.1002/jae.616
[13] Bhuiyan, M.M. (2020). Trend in renewable energy use in Bangladesh. The Financial Express. https://thefinancialexpress.com.bd/special-issues/power-energy/trend-in-renewable-energy-use-in-bangladesh-1504082323.
[14] Teske, S., Morris, T., Nagrath, K. (2019). 100% renewable energy for Bangladesh – Access to renewable energy for all within one generation. ISF for Coastal Development Partnership. http://www.cdpbd.org/index.php/publications/167-100-percent-renewable-energy-for-bangladesh-access-to-renewable-energy-for-all-within-one-generation.
[15] Rouf, K.A. (2015). Renewable energy context, scope, application and green business in Bangladesh. Global Journal of Human-Social Science, 15(3): 12-36.
[16] Halder, P., Paul, N., Joardder, M., Sarker, M. (2015). Energy scarcity and potential of renewable energy in Bangladesh. Renewable and Sustainable Energy Reviews, 51: 1636-1649. https://doi.org/10.1016/j.rser.2015.07.069
[17] Renewables 2020 global status report. (2020). https://www.ren21.net/wp-content/uploads/2019/05/gsr_2020_full_report_en.pdf.
[18] Center for climate and energy solutions. (2020). https://www.c2es.org/content/renewable-energy/.
[19] Liu, H., Masera, D., Esser, L. (2013). World Small Hydropower Development Report 2013. United Nations Industrial Development Organization, International Center on Small Hydro Power, China. https://www.unido.org/sites/default/files/files/2020-08/WSHPDR_2013_Executive_Summary_English.pdf?_token=303792015.
[20] Gumartini, T. (2009). Biomass energy in the Asia-pacific region: current status, trends, and future setting (APFSOS II/WP/2009/26). Food and Agriculture Organization. http://www.fao.org/3/a-am621e.pdf.
[21] Masud, M., Nuruzzaman, M., Ahamed, R., Ananno, A., Tomal, A. (2019). Renewable energy in Bangladesh: Current situation and prospect. International Journal of Sustainable Energy, 39(2): 132-175. https://doi.org/10.1080/14786451.2019.1659270
[22] Kraft, J., Kraft, A. (1978). On the relationship between energy and GNP. The Journal of Energy and Development, 3(2): 401-403. http://www.jstor.org/stable/24806805
[23] Ozturk, I. (2010). A literature survey on energy-growth nexus. Energy Policy, 38(1): 340-349. https://doi.org/10.1016/j.enpol.2009.09.024
[24] Apergis, N., Payne, J.E. (2009). Energy consumption and economic growth: Evidence from the Commonwealth of Independent States. Energy Economics, 31(5): 641–647. https://doi.org/10.1016/j.eneco.2009.01.011
[25] Omri, A. (2015). An international literature survey on energy-economic growth nexus: Evidence from country-specific studies. Renewable and Sustainable Energy Reviews, 38: 951-959. https://doi.org/10.1016/j.rser.2014.07.084
[26] Squalli, J. (2007). Electricity consumption and economic growth: Bounds and causality analyses of OPEC members. Energy Economics, 29(6): 1192-1205. https://doi.org/10.1016/j.eneco.2006.10.001
[27] Lee, S., Jung, Y. (2018). Causal dynamics between renewable energy consumption and economic growth in South Korea: Empirical analysis and policy implications. Energy & Environment, 29(7): 1298-1315. https://doi.org/10.1177/0958305X18776546
[28] Mahjabeen, Shah, S.Z., Chughtai, S., Simonetti, B. (2020). Renewable energy, institutional stability, environment and economic growth nexus of D-8 countries. Energy Strategy Reviews, 29: 100484. https://doi.org/10.1016/j.esr.2020.100484
[29] Razmi, S.F., Bajgiran, B.R., Behname, M., Salari, T.E., Razmi, S.M.J. (2020). The relationship of renewable energy consumption to stock market development and economic growth in Iran. Renewable Energy, 145: 2019-2024. https://doi.org/10.1016/j.renene.2019.06.166
[30] Shahbaz, M., Tiwari, A.K., Nasir, M. (2013). The effects of financial development, economic growth, coal consumption and trade openness on CO2 emissions in South Africa. Energy Policy, 61: 452-1459. https://doi.org/10.1016/j.enpol.2013.07.006
[31] Amri, F. (2017). The relationship amongst energy consumption (renewable and non-renewable), and GDP in Algeria. Renewable and Sustainable Energy Reviews, 76: 62-71. https://doi.org/10.1016/j.rser.2017.03.029
[32] Magazzino, C. (2017). Renewable energy consumption-economic growth nexus in Italy. International Journal of Energy Economics and Policy, 7(6): 119-127. https://econjournals.com/index.php
[33] Khawlah, A.A., Abdallah, S. (2016). Renewable energy consumption, CO2 emissions and economic growth: A case of Jordan. International Journal of Business and Economics Research, 5(6): 217-226. https://doi.org/10.11648/j.ijber.20160506.15
[34] Rahman, M.M., Velayutham, E. (2020). Renewable and non-renewable energy consumption-economic growth nexus: New evidence from South Asia. Renewable Energy, 147: 399-408. https://doi.org/10.1016/j.renene.2019.09.007
[35] Ocal, O., Aslan, A. (2013). Renewable energy consumption–Economic growth nexus in Turkey. Renewable and Sustainable Energy Reviews, 28: 494-499. https://doi.org/10.1016/j.rser.2013.08.036
[36] Eren, B.M., Taspinar, N., Gokmenoglu, K.K. (2019). The impact of financial development and economic growth on renewable energy consumption: Empirical analysis of India. Science of the Total Environment, 663: 189-197. https://doi.org/10.1016/j.scitotenv.2019.01.323
[37] Khobai, H. (2018). Renewable energy consumption and economic growth in Indonesia. Evidence from the ARDL bounds testing approach. Munich Personal RePEc Archive. https://mpra.ub.uni-muenchen.de/85081/1/MPRA_paper_85081.pdf.
[38] Ibrahim, T.M. (2015). The causal link between trade openness and government size: Evidence from the five largest economies in Africa. International Journal of Business and Economic Sciences Applied Research, 8(1): 121-136.
[39] Pao, H., Fu, H. (2013). The causal relationship between energy resources and economic growth in Brazil. Energy Policy, 61: 793-801. https://doi.org/10.1016/j.enpol.2013.06.113
[40] Mahmoodi, M., Mahmoodi, E. (2018). Environmental quality, renewable energy, trade openness and economic growth: Evidence from two groups of developing countries. Asian Journal of Water, Environment and Pollution, 15(2): 177-185. https://doi.org/10.3233/ajw-180030
[41] El-Karimi, M., EI Ghini, A. (2021). Renewable energy consumption-economic growth nexus: Empirical evidence from Morocco. In Proceedings of the Fourteenth International Conference on Management Science and Engineering Management, Springer International Publishing, pp. 189-199. https://doi.org/10.1007/978-3-030-49889-4_17
[42] Yildirim, E., Saraç, Ş., Aslan, A. (2012). Energy consumption and economic growth in the USA: Evidence from renewable energy. Renewable and Sustainable Energy Reviews, 16(9): 6770-6774. https://doi.org/10.1016/j.rser.2012.09.004
[43] World Bank. (2020). World-development-indicators. https://datacatalog.worldbank.org/dataset/world-development-indicators, accessed on Sep. 1, 2023.
[44] International, U.S. Energy Information Administration (EIA). (2020). https://www.eia.gov/international/data/country/BGD.
[45] BP. (2020). Statistical review of world energy. BP Global. https://www.bp.com/en/global/corporate/energy-economics/statistical-review-of-world-energy.html.
[46] Pesaran, M.H., Shin, Y. (1999). An Autoregressive Distributed-Lag Modelling Approach to Cointegration Analysis. University of Cambridge, Cambridge, UK.
[47] Dickey, D.A., Fuller, W.A. (1979). Distribution of the estimators for autoregressive time series with a unit root. Journal of the American Statistical Association, 74(366): 427-431. https://doi.org/10.1080/01621459.1979.10482531
[48] Phillips, P., Perron, P. (1988). Testing for a unit root in time series regression. Biometrika, 75(2): 335-346. https://doi.org/10.1093/biomet/75.2.335
[49] Narayan, P. (2005). The saving and investment nexus for China: Evidence from cointegration tests. Applied Economics, 37(17): 1979-1990. https://doi.org/10.1080/00036840500278103
[50] Kremers, J., Ericsson, N., Dolado, J. (1992). The Power of Cointegration Tests. Oxford Bulletin of Economics and Statistics, 54(3): 325-348. https://doi.org/10.1111/j.1468-0084.1992.tb00005.x
[51] Engle, R.F., Granger, C.W. (1987). Cointegration and error correction: Representation, estimation, and testing. Econometrica, 55(2): 251-276. https://doi.org/10.2307/1913236
[52] Saad, W., Taleb, A. (2017). The causal relationship between renewable energy consumption and economic growth: Evidence from Europe. Clean Technologies and Environmental Policy, 20(1):127-136. https://doi.org/10.1007/s10098-017-1463-5
[53] Ziramba, E. (2013). Hydroelectricity consumption and economic growth nexus: Time series experience of three African countries. European Journal of Scientific Research, 9(1): 85-96. https://core.ac.uk/download/pdf/328023517.pdf.
[54] Dong, K., Sun, R., Hochman, G. (2017). Do natural gas and renewable energy consumption lead to less CO2 emission? Empirical evidence from a panel of BRICS countries. Energy, 141: 1466-1478. https://doi.org/10.1016/j.energy.2017.11.092
[55] Sharif, A., Baris-Tuzemen, O., Uzuner, G., Ozturk, I., Sinha, A. (2020). Revisiting the role of renewable and non-renewable energy consumption on Turkey’s ecological footprint: Evidence from Quantile ARDL approach. Sustainable Cities and Society, 57: 102138. https://doi.org/10.1016/j.scs.2020.102138
[56] Kahia, M., Ben Aïssa, M., Charfeddine, L. (2016). Impact of renewable and non-renewable energy consumption on economic growth: New evidence from the MENA Net Oil Exporting Countries (NOECs). Energy, 116: 102-115. https://doi.org/10.1016/j.energy.2016.07.126
[57] Apergis, N., Payne, J.E. (2011). Renewable and non-renewable electricity consumption–growth nexus: Evidence from emerging market economies. Applied Energy, 88(12): 5226-5230. https://doi.org/10.1016/j.apenergy.2011.06.041
[58] Das, A., MacFarlane, A.A., Chowdhury, M. (2013). The dynamics of natural gas consumption and GDP in Bangladesh. Renewable and Sustainable Energy Reviews, 22: 269-274. https://doi.org/10.1016/j.rser.2013.01.053
[59] Destek, M.A. (2016). Renewable energy consumption and economic growth in newly industrialized countries: Evidence from asymmetric causality test. Renewable Energy, 95: 478-484. https://doi.org/10.1016/j.renene.2016.04.049
[60] Asghar, Z. (2008). Energy-GDP relationship: A causal analysis for the five countries of South Asia. Applied Econometrics and International Development, 8(1): 167-180. https://www.usc.es/economet/reviews/aeid8114.pdf.
[61] Pesaran, M.H., Pesaran, B. (1997). Working with Microfit 4.0: Interactive Econometric Analysis. Oxford University Press, Oxford.