Dewi Rakhmawati*![]() | Mukhamad Murdiono
| Mukhamad Murdiono![]() | Sekar Purbarini Kawuryan
| Sekar Purbarini Kawuryan![]() | Ratna Hidayah
| Ratna Hidayah![]()
© 2025 The authors. This article is published by IIETA and is licensed under the CC BY 4.0 license (http://creativecommons.org/licenses/by/4.0/).
OPEN ACCESS
In an era when environmental issues are a major concern, it is important to understand the variations in the effectiveness of ecological citizenship teaching materials in various educational contexts to improve environmental learning outcomes scientifically. This research aims to analyze the influence of ecological citizenship teaching materials to increase environmental awareness comprehensively. The research method used was quantitative meta-analysis. The eligible criteria of the articles included: (1) must have relevant topics; (2) have empirical research results; (3) have a value of (r), (t), or (F); (4) N ≥ 20; (5) the articles utilize internationally recognized languages; (6) are indexed by Scopus, Web of Science, SINTA and Copernicus; and (7) can be searched in the online international journal search database. The software used in this research was JASP 0.8. The research results showed that (1) the heterogeneity test showed significant heterogeneity; (2) The intercept value obtained results reaching 0.814 with a strong influence category after the summary effect size test was carried out; (3) the potential for bias was not visible and there was no potential for other factors to influence the findings after the publication bias test was carried out. This study concluded that ecological citizenship teaching materials had a strong influence on increasing environmental concern attitudes.
teaching materials, ecological citizenship, environmental care, meta-analysis
One of the biggest problems humans are currently facing is the worldwide environmental crisis. Global warming has an impact on increasing greenhouse gas emissions. This causes drastic climate changes, such as increasing temperatures, melting ice sheets, and rising sea levels [1, 2]. On the other hand, illegal logging to forest burning result in a threat to the variety of living things and habitats in the environment. The dangers of pollution and water contamination are of concern and are dangerous for the ecosystem and humans. These problems cause natural resources to become increasingly limited. Clean water and land are decreasing along with population growth. Human activities are increasingly restricted. Climate effects have an impact on increasing natural disasters. Real efforts and actions are needed to ward off the environmental crisis and ensure that the Earth continues to function optimally permanently [3, 4].
Through these considerations, environmental education is crucial to increasing awareness and knowledge about environmental sustainability. Other efforts are also needed as a form of environmental sustainability and improvement of the global environmental crisis [5]. Environmental education is defined as a learning process to make someone aware and understand how to be responsive to the environment, as well as providing a provision for maximizing skills for follow-up actions [6]. The educational process includes climate change, conservation of natural resources, pollution restrictions, and species or biological varieties [7]. Environmental education's urgency includes forming a responsible generation that caring and fair to the environment. Optimizing environmental literacy is needed so that individuals can make wise decisions about the environment [8, 9]. On the other hand, environmental education facilitates active involvement as a form of conservation and ecosystem improvement. Environmental education also provides critical knowledge about the correlation between humans and the environment, along with the impact of human behavior on the earth [10, 11]. On the other hand, environmental education is believed to play a crucial role in building sustainable community resilience and preparing for global environmental challenges [12].
Environmental education is the basis for building environmental awareness. Through environmental-based learning, children can master the urgency of ecosystem stability, act actively, and be responsible in preserving nature [13, 14]. Caring for the environment is shown in the form of attitudes and full awareness of the preservation and balance of nature. The impact is that children can be responsible and wise enough to outsmart, protect, and heal the environment [15, 16]. Every human being should actively contribute to the mitigation of the negative impacts of human actions on global climate change. The complex understanding between humans, nature, and the awareness of ecosystem sustainability must be resolved to prosper all living things [17, 18]. Overall, environmental awareness involves recognizing the relationship between each element of the environment and its impact on the balance of the ecosystem [19]. Furthermore, environmental concern includes recognition of the roots of environmental problems, such as life factors that influence human actions towards nature [20, 21]. Environmental concern is characterized by awareness of environmental issues, playing a role in conservation activities, wise use of resources, and a responsive attitude in prioritizing sustainable environmental policies [22, 23].
An individual who cares about the environment is indicated by doing these things: (1) always preserving the surrounding environment, (2) not taking, cutting down, or uprooting plants, (3) not scribbling or writing on trees, rocks, roads or walls, (4) always avoiding littering, (5) not burning rubbish around housing, (6) carrying out activities to clean the environment, (7) hoarding used goods, and (8) cleaning up rubbish that clogs waterways [24-27]. Additional actions that students can take to protect the environment include re-greening, conserving energy and water, and designing eco-friendly goods that employ natural resources rather than harming the environment [28-30].
UNESCO has long attempted sustainable development in education, which includes environmental care as one of its main pillars. Through programs such as Education for Sustainable Development (ESD), UNESCO has supported member countries to integrate learning about the environment, sustainability, and global citizenship in each country's education curriculum [31, 32]. Furthermore, the Indonesian Government has also given its attention to the urgency of environmental education. Through the Ministry of Education, Culture, Research, and Technology, Indonesia has fully supported the integration of environmental materials into the formal education curriculum. The integration starts from the elementary level to the higher level [1, 3, 4]. In addition, some programs initiate environmental education. The Sustainable School Movement and Adiwiyata School are Indonesian government programs that support environmentally friendly practices and restore environmental awareness in schools. In line with that, several studies have found that environmental education has been proven to increase individual awareness of their current environment and continues to the impacts caused [5-8]. Similar findings show that students who receive environmental education have better insight into the environment, dare to act, and are responsible for nature [10-12].
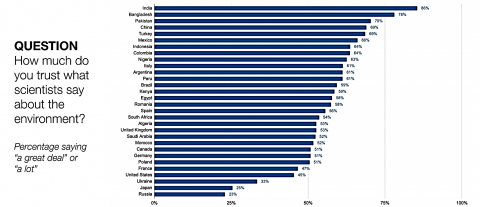
The real fact is that the majority of students have a limited understanding of environmental issues. They are also less responsive and less understanding of the impact of their different actions in preserving nature [14, 16]. Students have not participated in environmental stewardship practices, such as utilizing recycled goods, investing in planting trees, or working on environmental projects at school [18, 19]. Schools also still lack facilities and infrastructure that encourage environmental care education, such as recycling facilities, and trash cans, and a lack of initiating environmental education programs [21, 24]. The above facts are supported by the results of the global attitudes towards climate change survey conducted by the Pew Research Center. In general, there are only two countries that express high environmental concern, namely above 75%, regarding extreme climate change [28] The following are the results of the Global Attitudes towards Climate Change survey (refer to Figure 1).
Figure 1. Global attitudes towards climate change towards caring about climate change
Environmental care education aims to form individuals who are aware of their responsibilities towards the environment [33]. Environmental care education can help prepare students to become ecological citizens who are responsible and active in promoting environmental sustainability [1, 2]. Teaching materials that are integrated with environmental care education enable students to develop the skills, knowledge, and attitudes needed to participate in real action for environmental preservation [3]. One of them is through ecological citizenship teaching materials.
Ecological citizenship contains the strategic position of citizens to solve environmental problems. Ecological citizenship extends to the principles of national life. This is manifested in cooperation, collaboration, and harmonious activities [4, 5]. Furthermore, ecological citizenship also means a concept of increasing the urgency of individual active participation in introducing environmental sustainability and maintaining ecosystem balance. Through ecological citizenship, children are directed to be responsible for the environmental impact of their actions [7, 8]. This concept legitimizes that every individual plays a crucial role in maintaining the environment for everyone. Ecological citizenship also urges awareness of the global correlation between environmental challenges and the need for cross-border cooperation [10, 11]. Ecological citizenship is characterized by the formation of community groups, awards for their contributions to society, their role during environmental programs, and sensitivity in solving environmental problems [13-15].
Material on ecological citizenship is useful for making students understand the urgency of active involvement in maintaining environmental sustainability [16]. Students are called to take ownership of their daily actions, as well as their environment so that students act as delegates of improvement [17, 18]. In addition, this material also monitors the relationship between environmental challenges and cooperation in protecting the earth's ecosystem [20].
Integrating the concept of ecological citizenship into teaching materials helps strengthen students' understanding of the relationship between individuals and the environment, raising awareness of their responsibility to protect the Earth's sustainability [21, 22]. It also enables students to learn about contributive and positive actions for addressing environmental challenges [22, 23]. The integration of these concepts can support students to be proactive and selective because they are the delegates of change who must enliven sustainable practices in the environment [24, 25]. Students can optimize their skills as leaders, collaborators, and advocates needed to impact environmental policy and sustainable education [28]. This approach creates a dynamic learning environment, facilitates deep learning experiences for students, and explores ideas relevant to everyday life [30, 33].
Previous research has applied similar studies, although there is no research available with comprehensive results [3, 4, 6-10]. The novelty of this study focuses on the meta-analysis method to collect and review similar findings on the influence of ecological citizenship teaching materials on environmental awareness. The results contain a detailed description of its influence. In addition, this study also contributes significantly to mastering the dynamics between teaching materials and ecological citizenship, as well as its influence.
Based on the description above, this study is very crucial to be continued with urgent considerations on understanding the effectiveness of environmental education in forming environmental awareness attitudes. This meta-analysis describes variations in previous research findings that identify patterns and factors that impact the advantages and disadvantages of utilizing ecological citizenship teaching materials. Therefore, this research aims to investigate the effectiveness of ecological citizenship teaching materials in increasing awareness, knowledge, attitudes, and pro-environmental behavior in the field of education thoroughly and systematically, as well as to draw strong conclusions based on findings from various existing studies in the field of education. this field.
2.1 Research design
The quantitative meta-analysis method was adopted in this study. Quantitative meta-analysis is defined as a research method that combines and analyses various research findings on a particular study [34]. During the research process, identification, collection, and selection of relevant studies were carried out according to inclusion and exclusion criteria to maintain quality [35]. Sample size and primary outcomes were the data that were statistically analyzed to calculate the combined effect size [36]. The findings of this study conclude comprehensive data. Reliable data on the influence of independent variables on dependent variables to the identification of trends implied in individual studies [37]. The quantitative meta-analysis method was chosen because this method combines various research findings to state complete and valid conclusions so that new knowledge is obtained about the effectiveness of Ecological Citizenship teaching materials.
Publish or Perish (PoP) software is used to collect multiple articles from online databases. Several keywords were used. For example, "Ecological Citizenship", "Sustainable Citizenship", "Environmental Responsibility" and "Green Citizenship" to represent the variable of Ecological Citizenship. On the contrary, other keywords were also used. For example, "Environmental Awareness", "Environmental Concern", "Environmental Concern", "Environmental Awareness", "Environmental Responsibility", "Ecological Awareness", and "Ecological Awareness". Several articles collected through keyword searches were reviewed to obtain complete data on the influence of teaching materials on environmental awareness.
Scopus, PubMed, Web of Science, SINTA, ERIC (Education Resources Information Center), Google Scholar and Copernicus became the databases for collecting relevant articles because they are all interrelated and contain complete and comprehensive article content from various disciplines. Finally, additional article search platforms such as the Cochrane Library or JSTOR, Wiley Online Library, Taylor & Francis Online, IEEE Xplore, Emerald Insight, IGI Global, etc. As Scopus is one of the largest and most respected academic journal databases that offers many advantages for researchers in compiling literature reviews. In addition, articles indexed in Scopus have passed a strict selection process. This ensures that the articles used come from trusted and quality sources. In line with that, the process of selecting articles published in the Web of Science, SINTA, and Copernicus databases also meets a strict peer review process. These data sources calculate the impact factor in assessing journal quality. In the data search process, this study determined the range of years used from 2014 to 2023. The last 10 years were chosen because these references were considered up-to-date. In addition, the neglect of older literature is due to the culture of fast science and the measurement of researcher achievement through the number of publications and citation metrics.
2.2 Eligibility criteria
Eligibility criteria for articles reviewed in meta-analysis research are very important because they ensure that the selected articles meet certain standards that are relevant to the research objectives. Eligibility criteria help ensure that the selected articles are relevant to the research topic [38].
Table 1. Criteria for selecting research publications
|
Publication Selection Criteria |
Reasons |
|
They must discuss relevant topics |
Articles with a relevant focus make it easier for researchers to process data |
|
They have a value of (r), (t) or (F); (4) N ≥ 20 |
The recommended sample size in research is N more than 20 because this number of samples will be used to estimate population conditions and measure the average effect size [39] |
|
They have empirical research results |
Empirical research has the certainty of research results conducted through a series of field data-based studies so that the information obtained contains comprehensive results |
|
Use internationally recognized languages; |
The use of international languages has been recognized by all countries |
|
Indexed by Scopus, Web of Science, SINTA up to at least the Copernicus Index |
The database is guaranteed to have strong credibility, has a superior reputation, is internationally recognized, and has articles selected through a strict selection and evaluation process |
|
They can be searched in the online international journal search database |
The online international journal database is guaranteed to have a complex writing style, a very strict review process, and high competition from authors in various countries |
This is because articles that do not meet the eligibility criteria have the potential to produce inaccurate or biased conclusions. The criteria for selecting the research publications reviewed are shown in Table 1.
In coding this research data, a detailed description of the publication attributes used was carried out, including year of publication, sample size (N), correlation value (rxy), t value, F value, and important notes, including information related to accreditation or journal reputation. The conversion formula for values according to data coding in this study is as follows:
F=t2 (1)
t=√F (2)
r=t√t2+(N−2) (3)
Table 2. Comparison of 33 studies based on N, r, t, and F value
|
Ref. No. |
N |
r |
t |
F |
Index |
|
[23] |
4211 |
|
14.130 |
Q1 Scopus |
|
|
[21] |
180 |
|
3.561 |
Q1 Scopus |
|
|
[22] |
335 |
0.420 |
Q1 Scopus |
||
|
[19] |
66 |
|
6.417 |
Q2 Scopus |
|
|
[20] |
20 |
|
36.860 |
Q2 Scopus |
|
|
[18] |
143 |
|
3.840 |
Q2 Scopus |
|
|
[15] |
400 |
0.870 |
Q3 Scopus |
||
|
[16] |
60 |
0.617 |
Q3 Scopus |
||
|
[25] |
32 |
18.979 |
Scopus indexed proceeding |
||
|
[29] |
423 |
0,504 |
Scopus indexed proceeding |
||
|
[27] |
78 |
|
7.910 |
Scopus indexed proceeding |
|
|
[26] |
160 |
|
3.573 |
WoS indexed proceeding |
|
|
[24] |
72 |
0.720 |
WoS indexed proceeding |
||
|
[28] |
57 |
21.804 |
Non-Q Scopus |
||
|
[30] |
470 |
0.990 |
Non-Q Scopus |
||
|
[2] |
200 |
|
83.500 |
WoS ESCI |
|
|
[17] |
54 |
|
4.420 |
SINTA 2 |
|
|
[12] |
60 |
|
2.215 |
SINTA 2 |
|
|
[11] |
100 |
0.720 |
SINTA 2 |
||
|
[13] |
419 |
|
12.131 |
SINTA 2 |
|
|
[14] |
60 |
|
4.399 |
SINTA 2 |
|
|
[8] |
63 |
|
4.752 |
22.577 |
SINTA 2 |
|
[10] |
52 |
0.847 |
SINTA 2 |
||
|
[9] |
60 |
0.703 |
SINTA 3 |
||
|
[6] |
60 |
7.032 |
SINTA 3 |
||
|
[7] |
70 |
0.430 |
SINTA 3 |
||
|
[5] |
40 |
0.956 |
SINTA 3 |
||
|
[3] |
150 |
|
28.848 |
SINTA 3 |
|
|
[4] |
80 |
0.746 |
9.894 |
97,890 |
SINTA 4 |
|
[1] |
42 |
0,867 |
11.024 |
SINTA 5 |
|
|
[32] |
362 |
0.844 |
Copernicus Index |
||
|
[31] |
250 |
0.344 |
5.761 |
Copernicus Index |
|
|
[33] |
1250 |
0.419 |
16.307 |
Copernicus Index |
This aims to provide a clear picture of the characteristics of each publication analyzed, ensure that the data used is of high quality, and facilitate accurate and comprehensive interpretation of the results of the meta-analysis carried out [40]. Table 2 shows the data coding results for 33 studies in this meta-analysis article.
2.3 Data analysis technique
The data analysis process in meta-analysis has a sequential flow, starting with searching and collecting relevant articles, labeling data, converting effect sizes, testing for heterogeneity, calculating summary effect sizes, testing for publication bias, and interpreting data. The JASP 0.8 4.0 tool was used in this study. Random effects models were applied to calculate statistical methods of data. Cohen's Effect Size Criteria was adopted to assess the combined effect size derived from research findings [41]. With Cohen's effect size, researchers can easily predict the significance of analysis findings and draw detailed conclusions about the topic being explored (refer to Table 3).
Table 3. Cohen's effect size criteria [42]
|
Value |
Criteria |
|
< 0 + / -.1 |
Weak effect |
|
< 0 + / -.3 |
Modest effect |
|
< 0 + / -.5 |
Moderate effect |
|
< 0 + / -.8 |
Strong effect |
|
≥0 + / -.8 |
Very strong effect |
2.4 Research procedure
The Preferred Reporting Items for Systematic Reviews and Meta-Analyses (PRISMA) guidelines were adopted in this study with the intention that the findings obtained could be arranged systematically and the results presented according to the correct and complete stages. The overall goal of the PRISMA statement is to increase the transparency and scientific merit of reported systematic reviews or meta-analyses. The stages passed were as follows. First, identification by collecting relevant research articles through the Harzing's Publish or Perish (PoP) software application. The databases used are Scopus, Web of Science, SINTA, and Copernicus. Second, the article screening stage includes the selection of research articles that have been collected by involving the use of a quality article checklist to exclude articles that do not match the research topic. This selection process is carried out in stages by considering the inclusion criteria. Third is the stage of examining articles that have been collected in full. Fourth, checking duplicate articles and the use of the specified language. Fifth, the assessment of the feasibility of the research articles was assessed using the research article quality checklist items. Sixth, a critical review of articles to analyze research objectives. Figure 2 is a PRISMA flowchart that provides a visual overview of the stages of a meta-analysis study.
3.1 Description of research data
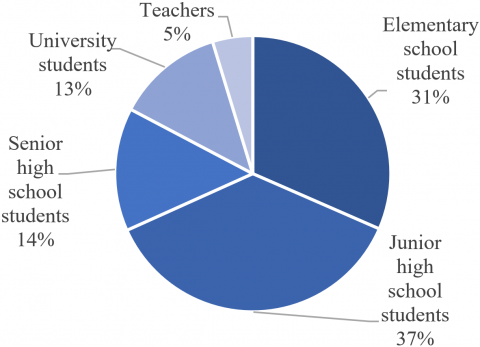
33 articles have been collected and distributed. The results of the collection were reviewed in depth. The study showed that junior high school students were the most dominant with a total of 3,243 students or 37% of all articles, while teachers were the minority as a sample of this study with a result of 5% or 416 teachers. The second group with an acquisition of 31% was filled by elementary school students with a total of 2,785 students. Meanwhile, high schools got a percentage of 14 with a total of 1,275 students. The contribution of the number of students was only 13% with a total of 1,110 students. This data shows that research on ecological citizenship teaching materials was mostly focused on middle and elementary-level students. The detailed information on the research sample is depicted in Figure 3.
Figure 2. PRISMA flowchart
Figure 3. Description of article data based on research samples
Figure 3 shows the distribution of articles based on education level, which is dominated by junior high school students. The level of education is something that needs to be discussed in a study because an attitude of environmental concern needs to be possessed by every student. Every student at any level of education has an important role to protect the environment. Teachers are also representative research samples to describe the role models of teachers in optimizing environmental concern.
The description of this study has limitations in that the sample is not comprehensive at each level of education, for example, there is no research with samples of preschool students, madrasahs, and student sample specifications. A more specific sample would be better for obtaining more general data. Thus, future researchers can focus research on a wider sample of madrasahs, early childhood, and students (for example, students from various study programs).
Furthermore, based on the 33 articles analyzed in the research, the distribution of research methods used is depicted in a diagram. The majority of articles used the Quantitative Quasi-Experimental method, namely 15 articles with a percentage of 46%, showing a strong preference for this method in research on ecological citizenship teaching materials. Quantitative Survey Methods were used in 7 articles or 21% of the total articles, while Research and Development (RnD) covered 6 articles, or 18% of the total articles studied. Comparative Quantitative and Correlational Quantitative Methods were each used in 6% or 2 articles, and the Mixed Methods method was only used in 1 article or 3% of the total research articles reviewed. The complete distribution of the research methods from the analyzed articles is presented in Figure 4.
Figure 4. Description of article data based on research methods
Figure 4 shows the type of quantitative research with the experimental type being the majority, while mixed research is the minority in this study. It is not surprising that quantitative research is the most dominant because the potential of researchers is almost rare in this type of research. In addition, the results obtained also present general and broad findings that describe the population. Quantitative research represents clear and objective conclusions to determine further decisions and follow-up related to education policy.
On the other hand, mixed research is the least used research method. This method tends to require more time and resources, especially in data collection and analysis. Researchers who focus on mixed methods research must be proficient in both methods during the data analysis process. In line with that, development research also takes a long time. The process of completing this method requires skill and precision to produce quality products. The products developed must also be scientifically tested to solve problems. The complexity of mixed and development research is the reason for the lack of research.
The large number of quantitative studies in this study reduces the number of studies of other types. Further researchers can select more strictly to choose development research methods and mixed methods in balance with quantitative methods. The balance of various research methods will produce findings that can be generalized.
Based on the analysis of 33 articles reviewed, the diagram shows the distribution of countries of origin for research on ecological citizenship teaching materials. The majority of articles originated from Indonesia, accounting for 73% of the total articles, indicating a significant focus on research in this country. The others are spread evenly with 3% each coming from the following countries: United States, China, Turkey, Spain, Slovenia, Philippines, Pakistan, Nigeria, and Malaysia. The complete distribution of the research countries of origin for the analyzed articles can be seen in Figure 5.
Figure 5. Description of article data based on research setting country
The geographical area of the study is depicted in Figure 3. Indonesia is the most dominant country, while other countries are still limited. Research on ecological citizenship teaching materials is often a topic of discussion by researchers in Indonesia. This is because Indonesia is a country that is geographically large and formed from an even natural landscape. The environment is an inseparable part of students and society in general. In addition, the education government also recommends that teachers apply a contextual approach to learning. One of them is by utilizing the surrounding environment. This is the basis for researchers in Indonesia to use similar topics.
In general, this research is dominated by Indonesia. Research that is only dominated by one country tends to produce flat findings or there is no strong comparison from other countries. Thus, further researchers are recommended to select literature from other countries that generalize the conditions of developing and developed countries. The variation of countries in the literature review will be a comparison of findings with more comprehensive discussion results.
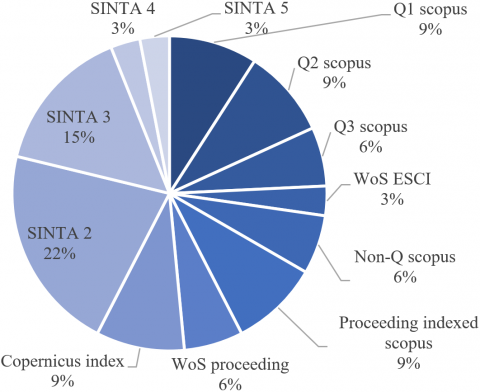
Figure 6. Description of article data based on indexing
The description of research data based on indexing in Figure 6 shows that the largest percentage of articles studied were indexed by SINTA 2 with a percentage of 22% and SINTA 3 with a percentage of 15%. They were evenly distributed with a percentage of 9% each, namely articles indexed by Scopus Q1, Scopus Q2, Scopus Proceedings, and Copernicus. The distribution of research data was 6%, namely articles indexed by Scopus Q3, No-Q Scopus, and WoS Proceedings. The others were spread evenly with a percentage of 3% each, namely articles indexed by WoS ESCI, SINTA 4, and SINTA 5.
Factors such as diversity of research samples, research methods, research setting countries, and indexing of study articles identified in a meta-analysis can help increase the statistical power of each representative study [36]. This diversity can also help in identifying significant sources of variation and inform future research. Furthermore, diversity in meta-analysis studies can also make the research findings more widely generalizable [35].
3.2 Heterogeneity test
In meta-analysis research, heterogeneity refers to variations in results caused not only by random error but also by real differences between the studies analyzed. Table 4 shows that the results from testing the fixed and random effects models in a study were estimated using the Restricted Maximum Likelihood, or Restricted ML, method. The omnibus test results show a χ² value of 73.009 with 1 degree of freedom and p < .001, indicating that the overall model coefficient was statistically significant. The residual heterogeneity test showed a χ² value of 3284.625 with 32 degrees of freedom and p < .001, indicating the presence of significant heterogeneity in the residual data, indicating variability that was not explained by the model. The heterogeneity test table can be seen in Table 4 and Table 5.
Table 4. Fixed and random effects
|
Model Test |
Q |
df |
p |
|
Omnibus Test of Model Coefficients |
73.009 |
1 |
<.001 |
|
Test of Residual Heterogeneity |
3284.625 |
32 |
<.001 |
Note. p -values were approximate
The model was estimated using the Restricted ML method
Table 5. Residual heterogeneity estimates
|
Variable |
Estimate |
|
τ² |
0.287 |
|
τ |
0.535 |
|
I² (%) |
98.631 |
|
H² |
73.026 |
Table 5 presents the estimates of residual heterogeneity in the meta-analysis model. A τ² (tau-squared) value of 0.287 indicated variance between studies that were not explained by random effects. The τ (tau) value of 0.535 was the square root of τ², indicating the degree of variation between studies. The I² index of 98.631% indicated that almost all of the observed variation (98.631%) was due to actual heterogeneity rather than random error. Finally, an H² value of 73.026 indicated the level of total heterogeneity in the model, where a value greater than 1 indicated the presence of significant heterogeneity. Thus, it can be concluded that there was a very high degree of heterogeneity in the studies analyzed, with almost all of the observed variation due to real differences between studies rather than random error. In meta-analysis research, the random effects model is used when the results of the studies analyzed show significant heterogeneity.
Heterogeneity in meta-analyses reflects variation among the studies analyzed. This variation can be caused by differences in research designs such as experiments, quasi-experiments, or surveys, which have different levels of variable control. Varying sample characteristics, such as education level, also influence study results. Different measurement methods are used to evaluate educational outcomes, creating variations in reported outcomes [42, 43]. Additionally, variations in reported effect sizes suggest that educational interventions have nonuniform impacts across contexts or populations [44].
3.3 Summary effect size test
This study analyzed the summary effect size using the Wald test method, which was explained in Table 6. The results show that the intercept had an estimate of 0.814 with a standard error of 0.095. A z value of 8.545 indicated that the intercept was statistically significant (p < .001). The data above shows that there was a significant effect in the study tested, with an intercept value of 0.814 which can be categorized as a strong effect. The summary of the effect size test can be seen in Table 6.
Table 6. Summary effect size test
|
|
Estimate |
Standard Error |
z |
p |
|
intercept |
0.814 |
0.095 |
8.545 |
< .001 |
Note. Wald test
Effect size tests are used to estimate the magnitude of the intervention effect from the collected research findings. Effect size informs about the significance of the effect which is important for estimating the results in general [41]. The findings of various studies are collected and the effect sizes are measured according to Cohen's criteria. The use of effect sizes allows comparisons between studies despite differences in methods and sample sizes [45]. Effect size also establishes the consistency of research findings and marks moderating factors that impact the results. Thus, the effect size clearly describes the impact of the variables studied as a whole [37, 46].
Next, the summary effect size test was conducted through the Wald test measurement. The results are presented in the form of a forest plot visualization to show the distribution of research results. A forest plot is defined as a visualization method in meta-analysis that illustrates the findings of several studies with similar effects. Figure 7 visualizes the random effects model (RE Model) of 0.81 as the midpoint with a 95% confidence interval. The results are shown by the vertical line connecting the lower limit interval of 0.63 and the upper limit interval of 1.00. The actual effect is between 0.63 and 1.00. The complete results are presented in Figure 7.
3.4 Publication bias test
3.4.1 Funnel plots
The suspected publication bias was measured in this study through the illustration of a funnel diagram. This technique was applied to confirm the asymmetry of the distribution of study results. The funnel diagram is defined as a graphical tool in meta-analysis studies to read the potential publication bias [47]. Through the distribution pattern of points on the funnel diagram, conclusions are drawn. The results show significant asymmetry. This means that there is a potential for publication bias or other factors that influence the research results [48]. The results of the publication bias test are presented in Figure 8.
Figure 7. Forest plot
Figure 8. Funnel plot
Table 7. Rank correlation test for funnel plot asymmetry
|
|
Kendall's τ |
p |
|
Rank test |
0.262 |
0.033 |
Table 7 shows that Kendall's τ value is 0.262, which is greater than the significance value of p = 0.033. This significance value is sufficient to show a difference from the usual (p 0.05). This means that the null hypothesis is rejected or there is no publication bias. The resulting τ value shows a relationship between effect size and precision in the funnel diagram, but it is not very strong. In addition, the results of this correlation test do not fully support the existence of publication bias, even though asymmetry is indicated in the funnel diagram. Therefore, it can be concluded that the existence of publication bias in this meta-analysis is not strongly proven.
3.4.2 Egger test
Although the rank correlation test can provide an initial indication of the asymmetry presence in a funnel plot, the Egger test is also often used in meta-analyses to more quantitatively evaluate the presence of publication bias. The Egger test allows researchers to specifically test whether the presence of asymmetry in the distribution of points on the funnel plot is related to the sample size of the studies. The Regression test results for funnel plot asymmetry or Egger test are shown in Table 8.
Table 8. Regression test for funnel plot asymmetry ("Egger's test")
|
|
z |
p |
|
sei |
1.543 |
0.123 |
Table 8 shows that in Egger's test for funnel plot asymmetry, the z-value was 1.543 with a p-value of 0.123. These results show no significant evidence for asymmetry in the distribution of points on the funnel plot, indicating that there was no measurable tendency for publication bias in the analysis. The Egger test was used in the meta-analysis to detect publication bias, which was the tendency to only publish studies with significant or positive results. The main function of the Egger test is to provide a formal statistical test of funnel plot asymmetry, which is an indication of potential publication bias [49].
3.4.3 Fail-Safe N
Although Egger's test indicates the presence of asymmetry in the funnel plot, the Fail-Safe N test can provide additional insight into the stability of meta-analysis results against potential publication bias. The Fail-Safe N test calculates the number of null studies required to convert a significant result to a non-significant one. Thus, this test can provide information about how strong or weak the existing evidence is for the relationships observed in a meta-analysis, as well as how susceptible the results are to potential publication bias or other factors that influence study results. The Fail-Safe N test results can be seen in Table 9.
Table 9. File drawer analysis
|
|
Fail-safe N |
Target Significance |
Observed Significance |
|
Rosenthal |
38313.000 |
0.050 |
<.001 |
Table 9 shows that in the file drawer analysis based on the Rosenthal method, the number of null studies required (Fail-safe N) to change the results to insignificant was 38313,000. Although the target significance was 0.050, the observed significance value was much lower (< .001), indicating that there was strong evidence for the significance of the effects observed in the meta-analysis. The fail-safe function of N in meta-analysis research is to assess how robust the meta-analysis results are to potential publication bias [50]. Fail-safe N indicated the number of “zero” studies or studies that did not show a significant effect necessary to eliminate or reduce the effect found in a meta-analysis to non-significance [51].
Based on the results of the publication bias test through Funnel Plot analysis, Egger Test, and Fail-safe N test, it is indicated that this meta-analysis study has obtained accountable results. Publication bias is an important thing in the meta-analysis research analysis process. Bias is influenced by the results obtained. Previous researchers tend to follow the research flow with results that have no significant effect.
Ecological citizenship-based teaching materials emphasize learning resources that lead to optimizing student awareness of the environment. Ecological citizenship is suitable for educating students about environmental conservation. Ecological citizenship-based teaching materials are an innovation in learning resources to strengthen environmental awareness [7]. In the application of this Ecological citizenship, there are four focuses, namely knowledge, skills, attitudes, and participation in the environment [52]. Ecological citizenship-based teaching materials contain materials, methods, limitations, and how to evaluate learning related to procedures, ethics, and morals of citizens towards the environment. For example, being responsible and wise, being fair, having a complete understanding and awareness of the environment, having sustainability in managing the environment, and participating in environmental protection efforts.
The influence of ecological citizenship teaching materials on attitudes of caring for the environment has great potential because the teaching materials contain behavioral content or awareness of the environment [24]. This content can shape students' behavior and attitudes to pay attention to the environment around them. Optimizing these teaching materials in learning can provide new knowledge for students and provide a clear picture of environmental conservation efforts [25]. Everyone in society (community leaders), families (parents), and schools (teachers) need to show their concern for the environment so that the examples shown can be models for students to imitate this behavior. Thus, through ecological citizenship teaching materials, students will have the opportunity to have a sharper awareness of their environment [10, 12].
Important implications are obtained from these findings, especially for environmental education/Adiwiyata organizers because it has been proven to have a significant effect on the existence of Ecological Citizenship teaching materials on the level of environmental awareness. This study is a reference for teachers to combine traditional learning resources with modern sources such as ecological citizenship-based teaching materials in learning. No less important, policy makers need to re-discuss to include an affirmation of the importance of ecological citizenship-based teaching materials in learning as a learning resource in the curriculum used. This is a priority for policy makers and educators by considering the availability of relevant evidence that is useful for facing environmental challenges effectively. Other contributions are in the form of educational practices and policies regarding the processes obtained after using ecological citizenship-based teaching materials that influence students' environmental awareness attitudes.
Several limitations were found, such as the possibility that there are still relevant studies that have not been reviewed in this study. This is due to limitations in the database used and the selection of inclusion criteria that have been set. If future researchers will conduct similar research, they are recommended to update relevant empirical data with a larger amount. In addition, there are also limitations in interpretation even though this study has visualized the results on the effectiveness of ecological citizenship-based teaching materials. However, the verified conclusions still consider the quality and characteristics of the study, as well as the interpretation of the researcher's point of view. Further researchers are recommended to examine the results from various perspectives of factors that influence the research findings. In addition, further researchers can qualitatively examine the analysis of factors that influence the effectiveness of ecological citizenship-based teaching materials or conduct longitudinal studies to assess the long-term impact of the availability of ecological citizenship-based teaching materials on students' environmental awareness and behavior.
Additionally, there are limitations to certain language exclusions. Language limitations in literature searches can lead to the exclusion of relevant studies published in certain languages (only search for articles in English), which can affect the global representation of meta-analysis results because there may be articles on the same topic but not written in English. Thus, future researchers are advised to use screening and evaluation applications for the eligibility of collected articles, such as the Review Manager (RevMan) software.
Based on the results and discussion of the study, it can be concluded that there is a strong influence of civic ecology teaching materials to increase environmental awareness. This influence is indicated by the results of significant heterogeneity tests, summary effect size tests with strong effect results, and the absence of potential publication bias or other factors that influence the results of the study.
Based on the research findings, teachers, lecturers, and educational practitioners are recommended to carry out action research at the classroom level to evaluate the implementation of Ecological Citizenship teaching materials in everyday learning. Besides, policymakers are encouraged to ensure that Ecological Citizenship is well and effectively integrated into formal education and to support the development and research of teaching materials that focus on strengthening environmental awareness and responsibility at all levels of education. Future researchers can continue this research by deepening the analysis of the moderating factors that influence the effectiveness of Ecological Citizenship teaching materials, as well as conducting longitudinal studies to evaluate their long-term impact on students' environmental awareness and behavior. In addition, future researchers are recommended to test the heterogeneity of study results. If heterogeneity is high, future researchers can explore other sources that are more varied.
[1] Welerubun, R.C., Wambrauw, H.L., Jeni, J., Wolo, D., Damopolii, I. (2022). Contextual teaching and learning in learning environmental pollution: The effect on student learning outcomes. Prima Magistra: Jurnal Ilmiah Kependidikan, 3(1): 106-115. https://doi.org/10.37478/jpm.v3i1.1487
[2] Božak, S., Hegediš, P.J., Hus, V. (2023). Ecological awareness among 3rd grade students of primary school. Creative Education, 14(2): 367-376. https://doi.org/10.4236/ce.2023.142024
[3] Nurwidodo, N., Wahyuni, S., Hindun, I. (2023). Enhancing environmental literacy using EMKONTAN learning for biology teacher candidates. Prisma Sains: Journal of Science Studies and Mathematics and Science Learning IKIP Mataram, 11(1): 175-189. https://doi.org/10.33394/j-ps.v11i1.6976
[4] Fetiana, N., Permanasari, A., Permana, I. (2022). Environmental literacy of junior high school students in Bogor: Contribution of knowledge to environmental attitudes and behaviors. Jurnal Penelitian Pendidikan IPA, 8(5): 2423-2429. https://doi.org/10.29303/jppipa.v8i5.1794
[5] Gustian, R., Jalal, F., Boeriswati, E. (2022). Improving student’s eco-literacy skills through the use of the eco-literacy module. Indonesian Journal of Social Research, 4(3): 178-186. https://doi.org/10.30997/ijsr.v4i3.231
[6] Fatria, E., Priadi, A., Artanti, G.D., Alhamda, S. (2024). Utilizing the geoeco-book learning package to improve eco-literacy of Z generation students in elementary schools. GeoEco, 10(1): 39-53. https://doi.org/10.20961/ge.v10i1.82151
[7] Vikram, M., Riandi, R., Solihat, R. (2023). Development of inquiry-based teaching materials on environmental pollution to improve high school students' environmental literacy skills. Jurnal Paedagogy, 10(4): 982-989. https://doi.org/10.33394/jp.v10i4.8781
[8] Wijaya, N., Yani, A., Nandi, N. (2023). The development of microlearning-based on teaching materials to increase students’ ecoliteracy. Journal of Education, Teaching, and Learning, 8(2): 155-163. https://doi.org/10.26737/jetl.v8i2.3568
[9] Firdausi, A., Wulandari, F.E. (2021). Development of web-based science learning module in improving the students’ understanding of eco-literacy. Jurnal Penelitian dan Pengkajian Ilmu Pendidikan: e-Saintika, 5(3): 241-252. https://doi.org/10.36312/esaintika.v5i3.426
[10] Vioreza, N., Supriatna, N., Hakam, K.A. (2022). Development of digital teaching materials based on betawi local food to increase ecoliteracy in elementary school students. Al Ibtida: Jurnal Pendidikan Guru MI, 9(2): 402-416. https://doi.org/10.24235/al.ibtida.snj.v9i2.11888
[11] Rubini, B., Pursitasari, I.D., Suriansyah, M.I., Ramadhanti, G.N., Rachman, I. (2023). Improving students' eco-literacy through the development of electronic interactive teaching materials on climate change. Jurnal Penelitian dan Pembelajaran IPA, 9(2): 288-308. https://doi.org/10.30870/jppi.v9i2.20051
[12] Arga, H.S.P., Rahayu, G.D.S. (2019). Influence of environment-based learning materials to improve the eco-literacy of PGSD students. Mimbar Sekolah Dasar, 6(2): 208-218. https://doi.org/10.17509/mimbar-sd.v6i2.17521
[13] Hartono, R. (2020). Evaluating sustainable education using eco-literacy. Habitat, 31(2): 78-85. https://doi.org/10.21776/ub.habitat.2020.031.2.9
[14] Kuswendi, U., Arga, H.S.P. (2020). Developing primary school students' environmental literacy by utilizing scraps. Mimbar Sekolah Dasar, 7(2): 198-215. https://doi.org/10.17509/mimbar-sd.v7i2.26497
[15] Osunji, O. (2021). Relationship between consciousness about environmental education concepts in secondary school chemistry curriculum and attitude of students towards environment. Science Education International, 32(1): 80-84. https://doi.org/10.33828/sei.v32.i1.9
[16] Wilujeng, I., Dwandaru, W.S.B., Rauf, R.B.A. (2019). The effectiveness of education for environmental sustainable development to enhance environmental literacy in science education: A case study of hydropower. Jurnal Pendidikan IPA Indonesia, 8(4): 521-528. https://doi.org/10.15294/jpii.v8i4.19948
[17] Kasirah, I., Abbas, H. (2022). The effectiveness of environmental education learning strategy teaching materials (SPPLH) in improving teachers' cognitive flexibility. Jurnal Penelitian dan Pengembangan Pendidikan, 6(3): 483-491. https://doi.org/10.23887/jppp.v6i3.56831
[18] Safitri, D., Lestari, I., Maksum, A., Ibrahim, N., Marini, A., Sudrajat, A., Zahari, R., Iskandar, R. (2022). Ecolabel with augmented reality on the website to enhance student environmental awareness. International Journal of Ecology, 2022(1): 8169849. https://doi.org/10.1155/2022/8169849
[19] Aliman, M., Mutia, T. (2021). The effect of digital eco-learning in student worksheet flipbook to environmental project literacy and pedagogic competency. JOTSE: Journal of Technology and Science Education, 11(2): 357-370. https://doi.org/10.3926/jotse.1175
[20] Ren, H., Zhao, L. (2023). Demonstration and suggestion on the communication efficiency of new media of environmental education based on ideological and political education. International Journal of Environmental Research and Public Health, 20(2): 1569. https://doi.org/10.3390/ijerph20021569
[21] Wibowo, N.A., Sumarmi, S., Utaya, S., Bachri, S., Kodama, Y. (2023). Students’ environmental care attitude: A study at Adiwiyata public high school based on the New Ecological Paradigm (NEP). Sustainability, 15(11): 8651. https://doi.org/10.3390/su15118651
[22] Sprague, N.L., Okere, U.C., Kaufman, Z.B., Ekenga, C.C. (2021). Enhancing educational and environmental awareness outcomes through photovoice. International Journal of Qualitative Methods, 20: 16094069211016719. https://doi.org/10.1177/16094069211016719
[23] Sánchez-Llorens, S., Agulló-Torres, A., Del Campo-Gomis, F.J., Martinez-Poveda, A. (2019). Environmental consciousness differences between primary and secondary school students. Journal of Cleaner Production, 227: 712-723. https://doi.org/10.1016/j.jclepro.2019.04.251
[24] Septiani, F., Sriyati, S. (2020). The implementation of teaching materials based on local agricultural wisdom in binjai to improve student environmental literacy. In International Conference on Educational Psychology and Pedagogy, pp. 80-85. https://doi.org/10.2991/assehr.k.200130.086
[25] Suryanti, D., Sinaga, P., Surakusumah, W. (2018). Improvement of students’ environmental literacy by using integrated science teaching materials. IOP Conference Series: Materials Science and Engineering, 306(1): 012031. https://doi.org/10.1088/1757-899X/306/1/012031
[26] Sari, H.L., Muryani, C., Prihadi, S. (2023). Development of Mobile-based Learning Applications to Increase Environmental Awareness for Students. In 6th International Conference on Learning Innovation and Quality Education, pp. 770-779. https://doi.org/10.2991/978-2-38476-114-2_72
[27] Noviana, E., Kurniaman, O., Salwa, N., Hermita, N., Afendi, N., Zufriady, Z., Munjiatun., Misliati, M. (2019). Ecological knowledge of elementary school students through the use of ecoliteracy teaching materials in curriculum 2013. Journal of Physics: Conference Series, 1351: 012071. https://doi.org/10.1088/1742-6596/1351/1/012071
[28] Aliman, M., Astina, I.K. (2019). Improving environmental awareness of high school students in Malang City through earth-comm learning in the geography class. International Journal of Instruction, 12(4): 79-94. https://doi.org/10.29333/iji.2019.1246a
[29] Wahyuni, N., Maryani, E., Kastolani, W. (2022,). The contribution ecoliteracy in environmental care behavior students of state high school in the city of Medan. IOP Conference Series: Earth and Environmental Science, 1089(1): 012058. https://doi.org/10.1088/1755-1315/1089/1/012058
[30] Aminrad, Z., Zakariya, S.Z.B.S., Hadi, A.S., Sakari, M. (2013). Relationship between awareness, knowledge, and attitudes towards environmental education among secondary school students in Malaysia. World Applied Sciences Journal, 22(9): 1326-1333. https://doi.org/ 10.5829/idosi.wasj.2013.22.09.275
[31] Asio, J.M.R. (2021). Determinants of environmental sustainability among tertiary students during the COVID-19 pandemic. Aquademia, 5(2): ep21011. https://doi.org/10.21601/aquademia/11444
[32] Zeeshan, M., Qureshi, N. (2023). Development of a scale to measure environmental consciousness of pre-service teachers in Punjab, Pakistan. Journal of Social Sciences Review, 3(1): 768-781. https://doi.org/10.54183/jssr.v3i1.199
[33] Ergen, A., Baykan, B.G., Turan, S.G. (2015). Effect of materialism and environmental knowledge on environmental consciousness among high school students: A study conducted in Istanbul province. Journal of Human Sciences, 12(1): 511-526. https://doi.org/10.14687/ijhs.v12i1.3130
[34] Ahn, E., Kang, H. (2018). Introduction to systematic review and meta-analysis. Korean Journal of Anesthesiology, 71(2): 103-112. https://doi.org/10.4097/kjae.2018.71.2.103
[35] Chamdani, M., Yusuf, F.A., Salimi, M., Fajari, L.E.W. (2022). Meta-analysis study: The relationship between reflective thinking and learning achievement. Journal on Efficiency and Responsibility in Education and Science, 15(3): 181-188. https://doi.org/10.7160/eriesj.2022.150305
[36] Yusuf, F.A., Fajari, L.E.W. (2022). Key success factors of various quality assessment institutions and quality of higher education services: A meta-analysis study. Eurasian Journal of Educational Research, 98(98): 184-202. https://doi.org/10.14689/ejer.2022.98.012
[37] Hidayah, R., Wangid, M.N., Wuryandani, W., Salimi, M. (2023). The influence of teacher efficacy on education quality: A meta-analysis. International Journal of Educational Methodology, 9(2): 435-450. https://doi.org/10.12973/ijem.9.2.435
[38] Romadiah, H., Dayurni, P., Fajari, L.E.W. (2022). Meta-analysis study: The effect of android-based learning media on student learning outcomes. International Journal of Asian Education, 3(4): 253-263. https://doi.org/10.46966/ijae.v3i4.300
[39] Valentine, J.C., Pigott, T.D., Rothstein, H.R. (2010). How many studies do you need? A primer on statistical power for meta-analysis. Journal of Educational and Behavioral Statistics, 35(2): 215-247. https://doi.org/10.3102/1076998609346961
[40] Fajari, L.E.W., Dayurni, P., Rahayu, A. (2023). Meta-analysis study: The effect of augmented reality on student learning outcomes. International Journal of Asian Education, 4(1): 49-57. https://doi.org/10.46966/ijae.v4i1.301
[41] Correll, J., Mellinger, C., McClelland, G. H., Judd, C. M. (2020). Avoid Cohen’s ‘small’, ‘medium’, and ‘large’ for power analysis. Trends in cognitive sciences, 24(3): 200-207. https://doi.org/10.1016/j.tics.2019.12.009
[42] Sedgwick, P. (2015). Meta-analyses: What is heterogeneity? British Medical Journal, 350: h1435. https://doi.org/10.1136/bmj.h1435
[43] Imrey, P.B. (2020). Limitations of meta-analyses of studies with high heterogeneity. JAMA Network Open, 3(1): e1919325. https://doi.org/10.1001/jamanetworkopen.2019.19325
[44] Higgins, J.P. (2008). Commentary: Heterogeneity in meta-analysis should be expected and appropriately quantified. International Journal of Epidemiology, 37(5): 1158-1160. https://doi.org/10.1093/ije/dyn204
[45] Chaokromthong, K., Sintao, N. (2021). Sample size estimation using Yamane and Cochran and Krejcie and Morgan and green formulas and Cohen statistical power analysis by G* Power and comparisons. APHEIT International Journal of Interdisciplinary Social Sciences and Technology, 10(2): 76-86.
[46] Chamdani, M., Salimi, M., Fajari, L.E.W. (2022). Perceptions of first-year students in online lectures in the Covid-19 pandemic era viewed from learning motivation. Pegem Journal of Education and Instruction, 12(2): 179-192. https://doi.org/10.47750/pegegog.12.02.18
[47] Palmer, T.M., Sutton, A.J., Peters, J.L., Moreno, S.G. (2008). Contour-enhanced funnel plots for meta-analysis. The STATA Journal, 8(2): 242-254. https://doi.org/10.1177/1536867x0800800206
[48] Sedgwick, P. (2013). Meta-analyses: How to read a funnel plot. BMJ, 346: f1342. https://doi.org/10.1136/bmj.f1342
[49] Shi, X., Nie, C., Shi, S., Wang, T., Yang, H., Zhou, Y., Song, X. (2017). Effect comparison between Egger’s test and Begg’s test in publication bias diagnosis in meta-analyses: evidence from a pilot survey. International Journal of Research Studies in Biosciences, 5(5): 14-20. https://doi.org/10.20431/2349-0365.0505003
[50] Lin, L., Chu, H. (2018). Quantifying publication bias in meta-analysis. Biometrics, 74(3): 785-794. https://doi.org/10.1111/biom.12817
[51] Yang, S., Berdine, G. (2021). Publication bias in meta-analysis. The Southwest Respiratory and Critical Care Chronicles, 9(41): 67-70. https://doi.org/10.12746/swrccc.v9i41.945
[52] Salimi, M., Susiani, T.S., Hidayah, R., Karsono, K., Fauziah, M. (2023). The profile ecoliteracy of students at Adiwiyata school. SAR Journal, 6(3): 188-195. https://doi.org/10.18421/SAR63-07