Siti Zulaikah*![]() | Hamdi Rifai
| Hamdi Rifai![]() | Iis Nurhasanah
| Iis Nurhasanah![]() | Aditya Pratama
| Aditya Pratama![]() | Nordiana Mohd Muztaza
| Nordiana Mohd Muztaza![]() | Hanif Izzuddin Zakly
| Hanif Izzuddin Zakly![]() | Muhammad Fathur Rouf Hasan
| Muhammad Fathur Rouf Hasan![]()
© 2025 The authors. This article is published by IIETA and is licensed under the CC BY 4.0 license (http://creativecommons.org/licenses/by/4.0/).
OPEN ACCESS
Rare earth elements (REEs) are element that has valuable potential as a raw material for modern industry. This research aims to determine the REE content of volcanic material using inductively coupled plasma-optical emission spectrometry (ICP OES) and magnetic susceptibility measurements. This research uses 13 samples of volcanic material from Mount Semeru. The measurement data were then statistically analyzed, which can be used as proxy indicators of the presence of REE in Semeru’s volcanic material. The results show the dominant REE contents are, on average, La (31.83 ppm), Ce (24.81 ppm), Gd (15.42 ppm), Pr (10.12 ppm), Nd (9.14 ppm), Tb (7.58 ppm), Sm (5.16 ppm), Eu (3.78 ppm), Y (1.75 ppm), and Dy (1.75 ppm). The average total REE content is 97.51 ppm. Each REE shows a significant correlation with the others, which means that the existence of one REE can become a clue to the existence of another one. Magnetic susceptibilities range from 340.75 to 2232.63 × 10-8 m3/kg with an average of 1028.71 × 10-8 m3/kg and have a significant correlation with Pr (R = -0.808 with P < 0.01), La (R = -0.650 with P < 0.05), Gd (R = -0.788 with P < 0.01), Nd (R = -0.680 with P < 0.05), Ce (R = -0.740 with P < 0.01), Sm (R = -0.623 with P < 0.05), Tb (R = 0.906 with P < 0.01), total REE (R = -0.741 with P < 0.01), and total LREE (R = -0.740 with P < 0.01). This correlation indicates that magnetic susceptibility can be used as a proxy indicator of existing Pr, La, Gd, Nd, Ce, Sm, Tb, total REE, and total LREE.
magnetic susceptibility, rare earth elements (REEs), Semeru, volcanic materials
Rare earth elements (REEs) are a multifunctional material with broad uses, ranging from indicators of geological processes, proxies for geological data, and extensive contributions to technology, the environment, agriculture, health, and modern industry [1]. The series of Lanthanide elements plus Scandium and Yttrium is up-and-coming and has many functions, so it has become the center of attention of researchers. The existence of rare earth elements and their use continue to be explored. This research focuses on REE studies of Mount Semeru volcanic material, which aims to provide specific information on the presence of REE in volcanic material. Tracing rare earth elements in Indonesia by the Ministry of Energy and Mineral Resources is still generally carried out in certain samples [2]. This paper specifically presents a study of rare earth elements in volcanic materials to estimate their quantity in the Mount Semeru area in East Java. This estimate was carried out by integrating geochemical data, magnetic susceptibility, and geological maps. From information on the presence of REEs in volcanic materials, which so far have only been used as indicators of geological events, it is hoped that this will provide a stimulus for wider use, especially in the industrial sector.
REEs can be found in volcanic areas, commonly used as indicators of hydrothermal alteration, brines, soil, coal, deep-sea sediment, and beach sand, which are widely reported in India [3]. REEs are widely used in industry, geological activities, agriculture, medicine, etc. The use of REEs in the industrial world has reached a global market vortex where America and China are the main producers [4]. The use of REEs can be seen from changes in hydrothermal processes, which can change the distribution pattern and content of REEs such as Ce, Eu, La, Lu, Nd, Sm, and Y [5]. By knowing changes in the concentration of REE content, it is thought that we can determine reservoir zones and geothermal [6]. Determination of REE elements has more resolving properties. For example, if the Eu and Ce anomalies are positive, total water heating occurs due to the direct interaction of water and the heating source rock. If the anomaly for both elements is negative, then the interaction of hot water mixes with surface groundwater [7]. These basic principles can be used in determining upflow and outflow. The presence of REEs in volcanic systems is usually used to trace the temperature of geothermal reservoirs. Recently, the presence of REEs in an environment has also been used to determine pollution [8] and to understand the process of soil genesis [9].
The results of REE studies in previous research showed their presence in several places, such as laterite soil, carried out by the Ministry of Energy and Mineral Resources [2]. REE research in volcanic system environments has been carried out [8-13] and found Ce, Dy, Er, Eu, Gd, Ho, La, Lu, Nd, Pr, Sm, Tb, Tm, Y, and Yb [14]. Information on the presence of REE in volcanic environments in Indonesia has been researched on Mount Merapi and the mountains located in Bandung, such as Mount Wayangwindu, Pangalengan, and Lembang [15-17]. REE in Boiled Fluid from Basalt rock-based geothermal environments has been studied previously [14]. REE extraction from Geothermal brine is also carried out [12].
Tracking the presence of REEs is generally carried out using geochemical methods. Geochemical methods are often combined with rock magnetism methods in understanding environmental changes. Magnetic properties can be a differentiating source of pollutants and heavy metals in industrial areas [18-20]. In some previous research, REE determination can be used for mapping land polluted with heavy metals and can be measured by high magnetic susceptibility values [21-24]. Furthermore, magnetic susceptibility can identify rock changes in hydrothermal systems and alteration zones in volcanic systems. The decrease in the low-frequency magnetic susceptibility (![]() ) value with depth is proportional to an increase in reservoir temperature and hydrothermal alteration, as well as a decrease in Fe-Mg silicate and opaque minerals [25, 26]. The difficulty of mapping REE abundance can be resolved by combining geochemical methods and the magnetism of the constituent rocks, and combining them with geological maps.
) value with depth is proportional to an increase in reservoir temperature and hydrothermal alteration, as well as a decrease in Fe-Mg silicate and opaque minerals [25, 26]. The difficulty of mapping REE abundance can be resolved by combining geochemical methods and the magnetism of the constituent rocks, and combining them with geological maps.
The sample collection location is situated in the Mount Semeru area. Mount Semeru is the highest mountain on the island of Java, located in the same area as Mount Bromo, forming the Bromo-Tengger-Semeru mountain range (BTS). Mount Semeru is one of the Quaternary volcanoes, with volcanic activity still active on Mount Semeru [27, 28]. The selection of Mount Semeru as the sampling site is based on the numerous studies that have been conducted in this location, but mapping of rare earth elements (REEs) is still very rarely done. One of the geochemistry studies conducted on Mount Semeru was the investigation of Europium (Eu) and the comparison of the Arjuno-Welirang elements with Bromo-Semeru [29, 30].
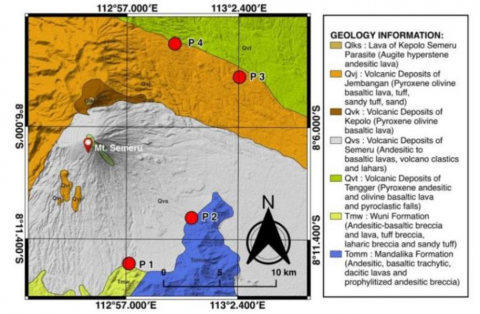
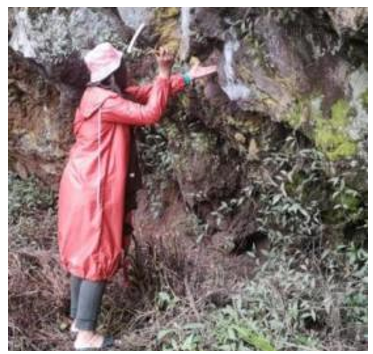
The samples in this study were volcanic material, including andesite, sand, sandy soils, and volcanic ash taken from the Semeru area, with four sampling points, with a total of 13 samples used in this research. The details of the sampling points are as follows: P1 (consisting of samples PS 1.2, PS 1.3, and PS 1.5), P2 (consisting of samples PS 2.1, PS 2.2, PS 2.3, PS 2.4, and PS 2.5), P3 (consisting of samples PS 3.1, PS 3.2, and PS 3.3), and P4 (consisting of samples PS 4.1 and PS 4.2) (see Figure 1). Geologically, Mount Semeru is dominated by pyroclastic, igneous rock and andesitic lava [31]. The sample collection locations on Mount Semeru are situated within two main lithologies that make up Mount Semeru. Samples PS 1.2–PS 1.5 and PS 2.1–PS 2.5 are located in the geological formation of the Volcanic Deposits of Semeru (Qvs). Samples PS 1.2–PS 1.5 are associated with the Wuni Formation (Tmw). This sample is located on the southern slope of Mount Semeru, 11 km from the summit of Mount Semeru. Generally, the sampling location is a river that becomes a flow of lahar and lava when Mount Semeru erupts. While samples PS 2.1–PS 2.5 are associated with the Mandalika Formation (Tomm), this sample location is close to the P1 sampling site, specifically on the southeast side of the summit of Mount Semeru. Similar to the P1 sampling site, this location is a river area that becomes a flow path for lahar and lava when Mount Semeru erupts. This condition allows for the mixing of sedimentation from various geological formation due to geological formations due to erosion during eruptions, carried by the lahar [32]. Therefore, it is very possible that the samples taken not only represent the local geology but are also representative of the volcanic material from Mount Semeru. Two other sampling locations, namely PS 3.1–PS 3.3 and PS 4.1–PS 4.2, are located in the Volcano Deposits of the Jembangan formation (Qvj), with samples PS 4.1–PS 4.2 being associated with the Volcanic Deposits of the Tengger formation (Qvt) [31]. Sampling at points P3 and P4 was taken from rock outcrops that are products of volcanic activity in the Mount Semeru area (see Figure 2(a)). There are outcrops of andesite rock, which is an extrusive igneous rock. Unlike the P1 and P2 samples, which tend to be transported sedimentary material, the samples from points P3 and P4 are bedrock. Sampling at points P3 and P4 makes the collected samples representative because the rock outcrops found are the original magma products of long-standing volcanic processes. Additionally, samples from this rock outcrop are free from mixing or alteration processes caused by transported sediments from lahar or river flows.
Figure 1. Sampling location of Semeru volcanic materials
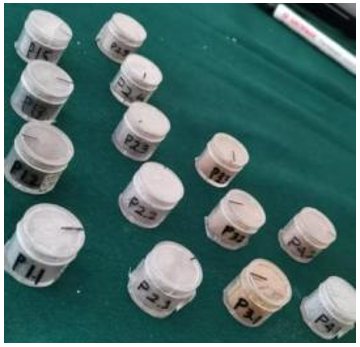
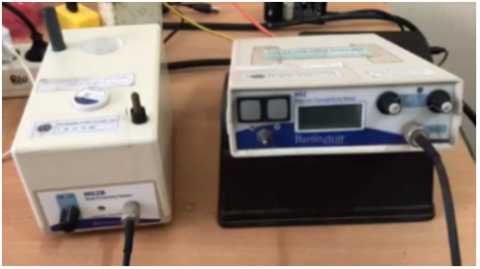
The samples taken from the field were obtained from outcrops found in the field. Then, samples were taken by 1000 g and placed in a plastic bag for transport to the laboratory (see Figure 2(a)). Each sample is then prepared in the laboratory for magnetic susceptibility measurements and sample preparation for REE determination. In the laboratory, the sample was dried at room temperature, ground into powder, and inserted into a standard cylindrical plastic holder for magnetic measurement (see Figure 2(b)). For optimal sample measurement, the grain size of the powdered sample is ensured to reach 200 mesh. Samples were weighed using a digital weight balance. The magnetic susceptibility of all samples was measured at two frequencies using the Bartington Magnetic Susceptibility Meter MS2B with frequencies of 470 Hz and 4700 Hz (see Figure 2(c)). Frequency-dependent susceptibility $\left(\chi_{f d}\right)$ is defined using the following Eq. (1):
$\chi_{f d}(\%)=\left[\frac{\chi_{470-} \chi_{4700}}{\chi_{470}}\right] \times 100 \%$ (1)
Several representative samples were prepared from the remaining powder to analyze REE elements using inductively coupled plasma-optical emission spectrometry (ICP OES). The presence of REE can be determined using Geochemical methods such as ICP OES and ICP MS [1]. REE analysis in rocks and minerals with ICP MS was also carried out by Sindern [33]. Measurement using ICP-OES has the advantage of high analytical accuracy and relatively short processing time, enabling the analysis of all elements quickly. The measurement of REE elements with ICP-OES requires the decomposition of solid samples to dissolve minerals into a solution containing metals. This process generally involves a mixture of HF, HNO3, and HClO4 acids [34]. REE measurements using ICP OES were conducted at the Laboratory for Testing of Nuclear Mineral Resources of the National Research and Innovation Agency (BRIN). Trace element analysis was conducted using a PerkinElmer ICP-OES 8300 system. The instrument features an argon plasma source, a peristaltic pump for sample introduction, and an optical emission spectrometer. Argon and Nitrogen gases were supplied via regulators, and a chiller maintained optimal operating temperatures. The instrument detection limits (IDL) for Tb are 0.9, for Pr, Gd, Nd, Ce, Sm, and Dy are 0.10, for La and Eu are 0.12, and for Y are 0.13, with a measurement uncertainty of 0.20.
For analysis, a new method was established within the Winlab 32 software. This involved selecting the target rare earth elements (REEs) and their corresponding wavelengths. Instrumental parameters were configured with a delay time of 20 seconds and a replicate count of 3 or 7. A flush time of 15 seconds was applied for the sampler and peristaltic pump. Calibration standards were prepared and introduced sequentially after blank analysis. Sample concentrations were determined by analyzing samples against the established calibration curve. All data acquisition and processing were performed using the Winlab 32 software.
Both magnetic susceptibility and geochemistry REE data were then analyzed using Pearson's correlation. This analysis is used to evaluate the linear relationship between two variables, thereby providing information on how strongly the physical and chemical parameters of volcanic material are correlated. It also serves to identify and understand correlation patterns to be used as proxy indicators. In this study, Pearson correlation analysis is applied to examine the possibility of using magnetic susceptibility data as a proxy indicator for the presence of REE in volcanic materials.
3.1 Magnetic susceptibility of Semeru
The results of magnetic susceptibility measurements at low frequency $(\chi_{l f})$, high frequency $(\chi_{h f})$, and frequencydependent susceptibility $(\chi_{f d})$ are shown in Table 1. Lowfrequency magnetic susceptibility $(\chi_{l f})$ ranges from 340.75 × 10⁻⁸ m3/kg to 2232.63 × 10-8 m3/kg with an average of 1028.71 × 10-8 m3/kg. The highest magnetic susceptibility value $(\chi_{l f})$ was found in the PS 3.3 sample (2232.63 × 10-8 m3/kg), which is an iron sand sample. This sand is a volcanic product from the eruption of Mount Semeru, carried by cold lava flows to the sample collection site. Meanwhile, the lowest magnetic susceptibility value $(\chi_{l f})$ was found in the PS 2.5 sample (340.75 × 10⁻⁸m3/kg), which is a sandy soil sample.
Magnetic susceptibility frequency dependence $(\chi_{f d})$ ranges from 0.021 (%) to 3.04 (%) with an average of 1.742 (%). According to Dearing [35], the measurement results of $\chi_{f d}$ for the Semeru samples are classified as low, with an average of <2.00%. This result indicates that the Semeru samples used in this study have almost no superparamagnetic content. Only six samples from the $\chi_{f d}$ measurements were classified as moderate ($\chi_{f d}$ = 2.00-10.00%) with the highest value in sample PS 3.1 (3.049%), where the sample type is sandy soil [35].
Table 1. Magnetic susceptibility of low frequency $(\chi_{l f})$, high frequency $(\chi_{h f})$ and the result of the calculation of the magnetic susceptibility dependence on frequency $(\chi_{f d})$ [29]
|
Sample ID |
$X_{ {lf }}$ (10-8 m3/kg) |
$\chi_{h f}$ (10-8 m3/kg) |
$\chi_{f d}$ (%) |
|
PS 1.2 |
798.85 |
785.80 |
1.633 |
|
PS 1.3 |
991.22 |
966.91 |
2.452 |
|
PS 1.5 |
787.36 |
780.12 |
0.919 |
|
PS 2.1 |
923.11 |
904.21 |
2.048 |
|
PS 2.2 |
681.94 |
664.47 |
2.562 |
|
PS 2.3 |
957.27 |
931.35 |
2.708 |
|
PS 2.4 |
1181.16 |
1159.14 |
1.864 |
|
PS 2.5 |
340.75 |
331.63 |
2.675 |
|
PS 3.1 |
1476.38 |
1431.36 |
3.049 |
|
PS 3.2 |
1422.81 |
1397.28 |
1.794 |
|
PS 3.3 |
2232.62 |
2232.16 |
0.021 |
|
PS 4.1 |
1124.54 |
1120.76 |
0.336 |
|
PS 4.2 |
455.20 |
452.55 |
0.583 |
|
Average |
1028.71 |
1012.13 |
1.742 |
3.2 Geochemistry of Semeru
The results of 13 types of rare earth elements (REEs) in samples of volcanic material (andesite, sand, and volcanic ash) show that the REE content includes the elements of Lanthanium (La), Gadolinium (Gd), and Cerium (Ce) followed by Praseodymium (Pr), Neodymium (Nd), Samarium (Sm) and Europium (Eu). The element Yttrium (Y) was only found in a few samples, as were the elements Terbium (Tb) and Dysprosium (Dy). Elements such as Holmium (Ho), Thulium (Tm), Ytterbium (Yb), and Lutetium (Lu) were not found in this sample (see Table 2). In general, the total rare earth elements (TotREEs) in the samples range from 47.9 to 174.2 ppm. The highest TotREE content is found in the PS 1.5 sample (174.2 ppm), which is an andesite sample. These results are similar to previous research where andesite samples showed TotREE content ranging from 52.7 to 257 ppm [36, 37].
Table 2. REEs content of Semeru volcanic materials
|
Sample ID |
La |
Ce |
Pr |
Nd |
Sm |
Eu |
Gd |
Tb |
Dy |
Y |
HREE |
LREE |
TotREE |
Sample Type |
|
PS 1.2 |
26.90 |
17.70 |
6.30 |
0.50 |
<IDL |
4.00 |
15.40 |
7.40 |
0.10 |
<IDL |
22.90 |
55.40 |
78.30 |
Sand |
|
PS 1.3 |
27.30 |
12.90 |
4.30 |
<IDL |
<IDL |
3.80 |
15.20 |
7.50 |
<IDL |
1.60 |
24.30 |
48.30 |
72.60 |
Sand |
|
PS 1.5 |
49.80 |
51.80 |
16.30 |
18.60 |
10.70 |
3.80 |
16.00 |
7.00 |
0.20 |
<IDL |
23.20 |
151.00 |
174.20 |
Andesite |
|
PS 2.1 |
30.40 |
25.90 |
8.40 |
6.20 |
1.20 |
3.80 |
15.70 |
7.70 |
0.50 |
1.90 |
25.80 |
75.90 |
101.70 |
Sand |
|
PS 2.2 |
45.80 |
39.90 |
11.20 |
11.30 |
1.80 |
3.80 |
16.10 |
7.50 |
<IDL |
<IDL |
23.60 |
113.80 |
137.40 |
Sand |
|
PS 2.3 |
27.60 |
13.70 |
6.30 |
1.30 |
0.30 |
3.80 |
15.70 |
7.40 |
<IDL |
<IDL |
23.10 |
53.00 |
76.10 |
Sand |
|
PS 2.4 |
32.00 |
21.90 |
9.90 |
6.10 |
2.70 |
4.00 |
15.70 |
7.40 |
1.00 |
<IDL |
24.10 |
76.60 |
100.70 |
Andesite |
|
PS 2.5 |
41.90 |
45.70 |
18.70 |
19.10 |
11.80 |
3.60 |
15.80 |
6.70 |
2.60 |
<IDL |
25.10 |
140.80 |
165.90 |
Sandy Soil |
|
PS 3.1 |
23.60 |
1.00 |
<IDL |
<IDL |
<IDL |
3.60 |
14.70 |
8.40 |
<IDL |
<IDL |
23.10 |
28.20 |
51.30 |
Sandy Soil |
|
PS 3.2 |
22.80 |
<IDL |
<IDL |
<IDL |
<IDL |
3.80 |
15.80 |
8.20 |
<IDL |
<IDL |
24.00 |
26.60 |
50.60 |
Sandy Soil |
|
PS 3.3 |
21.50 |
<IDL |
<IDL |
<IDL |
<IDL |
3.60 |
13.50 |
9.30 |
<IDL |
<IDL |
22.80 |
25.10 |
47.90 |
Sand |
|
PS 4.1 |
32.50 |
20.60 |
7.70 |
6.10 |
3.00 |
3.80 |
15.40 |
7.00 |
<IDL |
<IDL |
22.40 |
73.70 |
96.10 |
Andesite |
|
PS 4.2 |
31.70 |
21.90 |
12.10 |
13.10 |
9.80 |
3.70 |
15.50 |
7.00 |
<IDL |
<IDL |
22.50 |
92.30 |
114.80 |
Sandy Soil |
|
Average |
31.83 |
21.00 |
7.78 |
6.33 |
3.17 |
3.77 |
15.42 |
7.50 |
0.34 |
0.27 |
23.60 |
73.90 |
97.50 |
|
|
*The concentrations of REEs are in ppm. The instrument detection limits (IDL) of the concentration for Tb are 0.9, for Pr, Gd, Nd, Ce, Sm, and Dy are 0.10, for La and Eu are 0.12, and for Y are 0.13. |
||||||||||||||
Meanwhile, several dominant REEs in the Semeru sample consist of La, Ce, and Gd. La shows a range of 21.50 to 49.80 ppm with an average of 31.83 ppm. The Ce ranges from 0.00 to 51.80, averaging 21.00 ppm. Meanwhile, Gd ranges from 13.50 to 16.10, averaging 15.42 ppm. Among the three dominant rare earth elements (REEs) in the Semeru samples, two of them have the highest content in the PS 1.5 sample (La = 49.8 ppm, Ce = 51.8 ppm). Meanwhile, the highest content of Gd is found in the PS 2.2 sample (16.1 ppm), where the sample type is sand. These results clearly indicate that the REE content in rock samples is higher than in sand and volcanic ash.
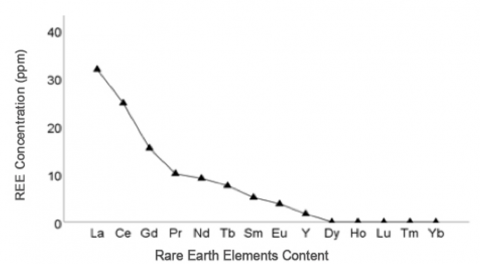
Based on the test results for the REE content in the Semeru volcanic material, it can be determined that the light REE (LREE) content of Semeru includes La, Ce, Pr, Nd, Sm, and Eu. Meanwhile, Semeru's heavy REE (HREE) includes Gd, Tb, Dy, and Y. From the entire Semeru REE data, the order of the average REE content is from largest to smallest (see Figure 3).
Figure 3. The trend of Semeru REE content from largest to smallest
Figure 3 shows that the largest element content is La, followed by Ce, Gd, Pr, Nd, Tb, Sm, Eu, and the smallest is Dy. This data provides information that LREE (average 70.12 ppm) in Semeru is more dominant than HREE in Semeru (average 27.38 ppm). This pattern is generally shared by samples originating from the Earth's mantle [38]. The same analysis of oceanic or continental arc samples, which include basalt, basaltic andesite, dacite, and rhyolite, also shows that the largest REE content is La and the smallest is Dy [39].
Figure 4. Plot Sr/Y-SiO2 shows that the two samples containing Y are in the range below the barren intrusions [40]
The sample category in the oceanic or continental arc rock type is also confirmed by the Sr/Y-SiO2 plot analysis (shown in Figure 4). There are two samples of volcanic material containing Yttrium. Figure 4 shows that two materials contain Yttrium, showing that this material is still under barren intrusion. According to Loucks [40], this volcanic material probably came from oceanic or continental arc basalt, basaltic andesite, dacite, and rhyolite rocks. It also confirmed Semeru's location, that is, in the ring of fire where subduction between the Eurasia and Indo-Australia plates exists [40].
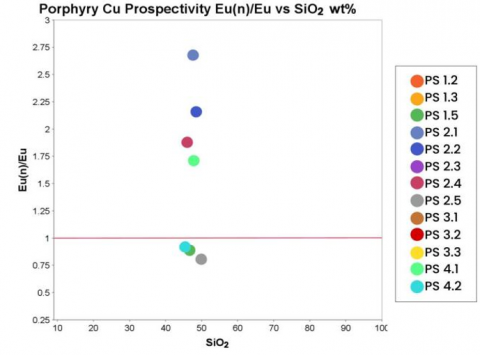
Based on the relation between Europium and Silicon oxide content in the Eu-SiO2 graph (see Figure 5), it can be seen that there are two types of distribution of Semeru volcanic material based on Eu(n)/Eu*. Europium (Eu) can generally effectively determine the possibility of sedimentary rocks acquiring REE from their parent rocks [42]. Through the anomaly of Eu normalization values, both positive and negative anomalies are produced. Positive anomalies are almost shown by most of the Semeru samples. This provides information that the Semeru samples are an accumulation of feldspar (Eu(n)/Eu*>1) [43]. Meanwhile, negative anomalies are shown by samples PS 1.5 (andesite), PS 2.5 (sandy soils), and PS 4.2 (sandy soils), indicating the presence of plagioclase/K-feldspar fractionation in the magma [44]. In general, the pattern shown in the Semeru samples on the graph (Figure 5) forms a vertical pattern with a SiO2 range of 40-50 wt%. Although based on the Eu content, this material does not show a unity, based on SiO2, this material confirms the existence of a unity.
Rocks with Eu(n)/Eu* > 1 are likely to contain a significant accumulation of feldspar or plagioclase [45]. This impacts the main factors used to identify mineral phases, whether crystallization processes or accumulation, to determine REE characteristics (both HREE and LREE) [46, 47]. Henderson [48] provided distribution coefficients indicating that clinopyroxene generally tends to accumulate HREE. Meanwhile, plagioclase tends to accumulate LREE more than HREE [48]. Additionally, plagioclase naturally and significantly fractionates Eu [49]. This phenomenon occurs because Eu easily binds as Eu2+ in feldspar [43]. Therefore, rocks enriched in plagioclase tend to show a positive Eu anomaly when accumulation occurs [43, 49]. If this is related to what happens in the Semeru sample, there is an enrichment of LREE caused by the accumulation of feldspar with a positive Eu anomaly.
Table 3. Pearson correlations between magnetic susceptibility and rare earth elements
|
Correlations |
||||||||||||||
|
$\chi_{ {lf}}$ |
La |
Ce |
Pr |
Nd |
Sm |
Eu |
Gd |
Tb |
Dy |
Y |
HREE |
LREE |
TotREE |
|
|
$\chi_{ {lf}}$ |
1 |
|||||||||||||
|
La |
-0.650* |
1 |
||||||||||||
|
Ce |
-0.740** |
0.965** |
1 |
|||||||||||
|
Pr |
-0.808** |
0.875** |
0.948** |
1 |
||||||||||
|
Nd |
-0.680* |
0.890** |
0.908** |
0.939** |
1 |
|||||||||
|
Sm |
-0.623* |
0.704** |
0.746** |
0.859** |
0.931** |
1 |
||||||||
|
Eu |
-0.197 |
0.055 |
0.103 |
0.067 |
-0.173 |
-0.265 |
1 |
|||||||
|
Gd |
-0.788** |
0.629* |
0.646* |
0.626* |
0.520 |
0.374 |
0.467 |
1 |
||||||
|
Tb |
0.906** |
-0.657* |
-0.738** |
-0.824** |
-0.670* |
-0.648* |
-0.316 |
-0.776** |
1 |
|||||
|
Dy |
-0.404 |
0.365 |
0.494 |
0.612* |
0.552 |
0.558* |
-0.172 |
0.249 |
-0.405 |
1 |
||||
|
Y |
-0.067 |
-0.142 |
-0.028 |
-0.093 |
-0.185 |
-0.250 |
0.078 |
0.031 |
0.020 |
-0.040 |
1 |
|||
|
HREE |
-0.239 |
0.142 |
0.265 |
0.235 |
0.168 |
0.047 |
0.020 |
0.336 |
-0.112 |
0.588* |
0.654* |
1 |
||
|
LREE |
-0.740** |
0.960** |
0.984** |
0.969** |
0.965** |
0.843** |
0.008 |
0.617* |
-0.744** |
0.521 |
-0.114 |
0.205 |
1 |
|
|
TotREE |
-0.741** |
0.958** |
0.986** |
0.970** |
0.964** |
0.840** |
0.009 |
0.622* |
-0.743** |
0.533 |
-0.097 |
0.229 |
1.000** |
1 |
|
*Correlation is significant at the 0.05 level (2-tailed). |
||||||||||||||
|
**Correlation is significant at the 0.01 level (2-tailed). |
||||||||||||||
Pearson's correlation analysis, shown in Table 3, explores the relation between REE and magnetic susceptibility. The relations between magnetic susceptibility and REE content in Semeru volcanic material can be used as a proxy indicator for the presence of REE. The magnetic susceptibility range of the Semeru volcanic material shows similarities with other volcanic materials, such as Bromo [50]. This result reinforces the data, as the samples used are still similar since both Bromo and Semeru are located in the same area.
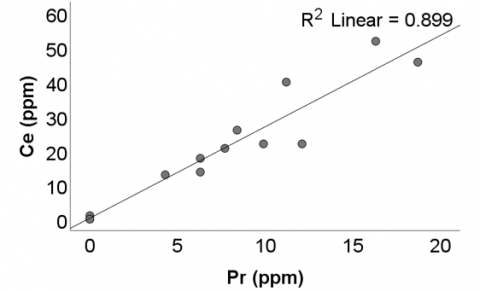
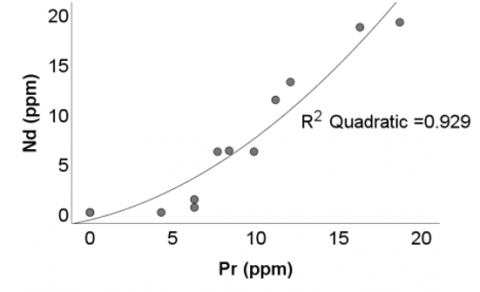
Pearson correlation analysis between REE and magnetic susceptibility shows that $\chi_{ {lf}}$ is significantly correlated with several elements such as Pr, La, Gd, Nd, Ce, and Sm. $\chi_{ {lf}}$ is also positively correlated with Tb with R 0.906 with a significance of 0.01 (See details in Table 3). Several elements are significantly correlated, for example, Ce vs Pr, La vs Pr, and Pr vs Nd. Low-frequency magnetic susceptibility $\chi_{ {lf}}$ also significantly correlates with total light REE (LREE). The correlation between $\chi_{ {lf}}$ and LREE shows a significant inverse correlation.
The significant inverse correlation between$\chi_{ {lf}}$ and LREE can be explained as follows. Based on rock classification from SiO2 content, the average SiO2 content of Semeru volcanic samples shows an average of <45 wt%, thus classified as an ultramafic rock type [29, 30]. According to Henderson [51], ultramafic rocks are not the type of rocks that carry large amounts of REE. The REE content in this type of rock naturally ranges only from 69–1455 ppm [51]. Naturally, one of the main constituents of ultramafic rocks is the mineral olivine [52]. Olivine ((Mg,Fe)2SiO4) is generally enriched in Mg and Fe as its main components, with Si <45 wt%. The REE content in olivine is very small; however, as a silicate, olivine may still be associated with REE. Some silicates associated with REE include zircon (ZrSiO4) which contains many HREE (Y, Er, Yb, Lu), titanite (CaTiSiO5) which stores large amounts of LREE (La, Ce dan Nd), allanite which is very rich in REE, and monazite ((Ce, La, Pr, Nd, Th, Y) PO4) which is not technically a silicate but in nature often associates with silicate rocks and serves as a major carrier of REE [2]. Furthermore, monazite and zircon are the main REE minerals found in Indonesia [53]. Meanwhile, those four silicates are complex silicates capable of storing large amounts of REE [54, 55]. whereas olivine is the simplest silicate, so its REE content is only small or limited [56].
The finding of an inverse correlation between $\chi_{ {lf}}$ and LREE, as well as total REE, can be interpreted as the influence of the dominance of olivine, one of the constituent minerals of ultramafic rocks. The Mg-Fe content in olivine is associated with high magnetic susceptibility values but suppresses REE and LREE concentrations, making them lower. Thus, the higher the $\chi_{ {lf}}$, the lower the total REE and LREE content. The role of olivine in the Semeru volcanic samples is supported by sampling points P3 and P4, where both points are geologically composed of pyroxene-olivine basaltic lava from the Qvj formation (see Figure 1). In addition, this is possible because the volcanic material underwent alteration, leading to a higher concentration of LREE elements due to the mobilization of hot fluids [57, 58]. This process causes the magnetic minerals to experience a dilution effect [59]. Additionally, in general, the LREE elements have paramagnetic properties, and some of them have diamagnetic properties, such as La [60, 61]. This result certainly strengthens the analysis of the Eu anomaly in the volcanic material sample from Mount Semeru, which has accumulated feldspar or plagioclase, thus showing a positive anomaly [45]. This phenomenon provides additional information: although the correlation between $\chi_{ {lf}}$ and total REE and LREE are inverse, the presence of a positive Eu anomaly indicates that plagioclase fractionation has not been significant [62].
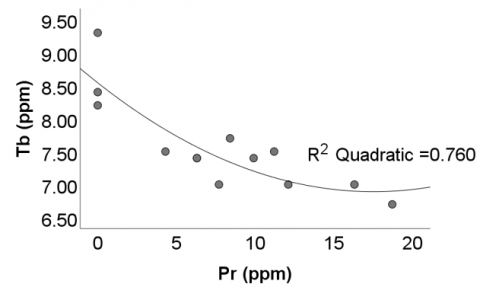
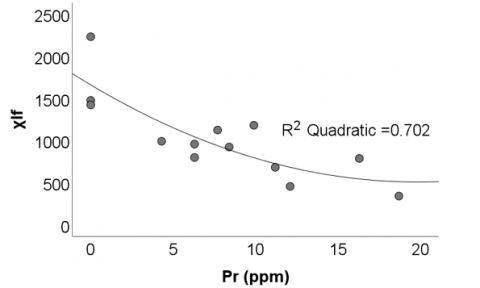
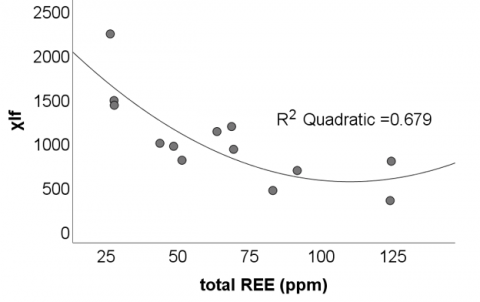
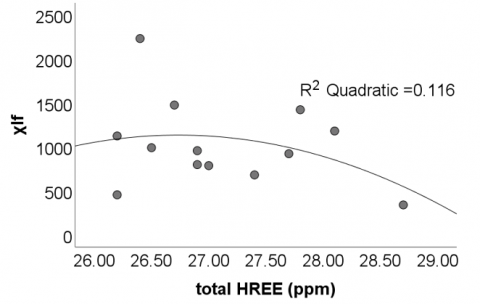
The plot of the relation between several rare earth elements and magnetic susceptibility can be seen in Figure 6. Magnetic susceptibility is not significantly correlated with heavy REE (HREE), where the greater the susceptibility, the total HREE almost does not change. Plot $\chi_{ {lf}}$ vs LREE, HREE, and the TotREE are shown in Figure 6. Based on Figures 6, which show the relationship between $\chi_{ {lf}}$ and total REE and LREE, the quadratic regression pattern reveals a consistent downward trend. This pattern reinforces the previous finding that when $\chi_{ {lf}}$ is high, the total REE and LREE concentrations decrease or remain low.
This study has limitations due to the number of sampling points obtained in the field. This results in spatial grid coverage that is still insufficiently dense for such a wide research area. However, the findings of this study can serve as an initial insight into the REE characteristics of volcanic materials in the Semeru area. Further research can be developed by increasing the number of systematically distributed sampling grid points. This is necessary to validate the REE characteristics of the Semeru area to develop a comprehensive distribution map.
Mount Semeru's volcanic deposits, represented by andesite, sand, and volcanic ash, with an ultramafic parent rock, contain REE with a predominance of Pr, La, Nd, Ce, Sm, and Tb. Several REEs significantly correlated with each other, such as La with Ce, Pr, Nd, Sm, Gd, and Tb. Magnetic susceptibility significantly correlated with Pr, La, Gd, Nd, Ce, Sm, and Tb. Statistically, a significant negative correlation is observed between low-frequency magnetic susceptibility $(\chi_{ {lf}})$ and the concentrations of Total REE (R = -0.741) and LREE (R = -0.740). This implies that high magnetic susceptibility corresponds to low REE content, and low magnetic susceptibility corresponds to high REE content. The significant negative correlation is primarily attributed to the dominance of olivine, which contains higher amounts of silicate. Based on this correlation, magnetic susceptibility measurements can be used as a proxy indicator for assessing the presence of REEs, particularly TREE and LREE, under conditions of magnetic mineral alteration and REE enrichment, provided there is strong mineralogical validation. Further mineralogical studies are required to verify this relationship. However, this must be combined with field validation to effectively guide REE mining priorities. Additionally, it is necessary to add mineralogical data, such as X-Ray Diffraction (XRD) analysis, for further analysis and identification of the presence of REE-bearing mineral phases.
This work was supported by Universitas Negeri Malang through Indonesian Research Collaboration (RKI) 2023 funding with the grant number 10.5.43/UN32.20.1/LT/2023. Some samples were taken with funding supported through Hibah Kerjasama Internasional INTERNAL 2022 with the grant No. 9.5.993/UN32.20.1/LT/2022, where the first author is the chief researcher. Thanks to Laboratory for Testing of Nuclear Mineral Resources – BRIN for measuring REE data, and we also gratefully acknowledge the Indonesian Collaboration Research Consortium.
|
REE |
Rare Earth Elements |
|
HREE |
High Rare Earth Elements |
|
LREE |
Light Rare Earth Elements |
|
TotREE |
Total Rare Earth Elements |
|
Greek symbols |
|
|
$\chi_{l f}$ |
Magnetic Susceptibility low-frequency, 10-8 m3/ kg |
|
$\chi_{h f}$ |
Magnetic Susceptibility high-frequency, 10-8 m3/ kg |
|
$\chi_{f d}$ |
Magnetic Susceptibility dependent-frequency, % |
[1] Balaram, V. (2019). Rare earth elements: A review of applications, occurrence, exploration, analysis, recycling, and environmental impact. Geoscience Frontiers, 10(4): 1285-1303. https://doi.org/10.1016/j.gsf.2018.12.005
[2] Potential of Rare Earth Metals in Indonesia. Center for Mineral, Coal, and Geothermal Resources, Geological Agency, Ministry of Energy and Mineral Resources. https://geologi.esdm.go.id/media-center/potensi-logam-tanah-jarang-di-indonesia.
[3] Kokh, M.A., Luais, B., Truche, L., Boiron, M.C., Peiffert, C., Schumacher, A. (2021). Quantitative measurement of rare earth elements in brines: Isolation from the charged matrix versus direct LA-ICP-MS measurements–A comparative study. Geostandards and Geoanalytical Research, 45(2): 341-358. https://doi.org/10.1111/ggr.12376
[4] Lintjewas, L., Setiawan, I. (2018). Mobility of rare earth element in hydrothermal process and weathering product: A review. IOP Conference Series: Earth and Environmental Science, 118(1): 012076. https://doi.org/10.1088/1755-1315/118/1/012076
[5] Shoedarto, R.M., Tada, Y., Kashiwaya, K., Kubo, T., et al. (2018). Deducing geothermal boiling zone from rare earth elements on early-stage geothermal exploration. In Proceedings 43rd Workshop on Geothermal Reservoir Engineering, pp. 1-5.
[6] Yunginger, R., Bijaksana, S., Dahrin, D., Zulaikah, S., Hafidz, A., Kirana, K., Sudarningsih, S., Mariyanto, M., Fajar, S. (2018). Lithogenic and anthropogenic components in surface sediments from Lake Limboto as shown by magnetic mineral characteristics, trace metals, and REE geochemistry. Geosciences, 8(4): 116. https://doi.org/10.3390/geosciences8040116
[7] Aide, M.T., Aide, C. (2012). Rare earth elements: Their importance in understanding soil genesis. ISRN Soil Science, 2012(1): 783876. https://doi.org/10.5402/2012/783876
[8] Brewer, A., Chang, E., Park, D.M., Kou, T., Li, Y., Lammers, L.N., Jiao, Y. (2019). Recovery of rare earth elements from geothermal fluids through bacterial cell surface adsorption. Environmental Science and Technology, 53(13): 7714-7723. https://doi.org/10.1021/acs.est.9b00301
[9] Fowler, A., Zierenberg, R. (2017). Rare earth element concentrations in submarine hydrothermal fluids (No. 985). USDOE Geothermal Data Repository (United States); University of California, Davis. https://doi.org/https://doi.org/10.15121/1419773
[10] Pambudi, N.A. (2018). Geothermal power generation in Indonesia, a country within the ring of fire: Current status, future development and policy. Renewable and Sustainable Energy Reviews, 81: 2893-2901. https://doi.org/10.1016/j.rser.2017.06.096
[11] Suharno, S., Ferra Nidya, F.N., Ahmad, Z. (2013). Characteristics of Mountain Arjuno-Welirang geothermal Jawa Timur Province, Indonesia. In Proceedings, 13th Indonesia International Geothermal Convention and Exhibition 2013, pp. 1-7. http://repository.lppm.unila.ac.id/id/eprint/8344.
[12] Smith, Y., Kumar, P., McLennan, J. (2017). On the extraction of rare earth elements from geothermal brines. Resources, 6(3): 39. https://doi.org/10.3390/resources6030039
[13] Sumotarto, U. (2018). Geothermal energy potential of Arjuno and Welirang Volcanoes area, East Java, Indonesia. International Journal of Renewable Energy Research, 8(1): 614-624. https://doi.org/10.20508/ijrer.v8i1.6690.g7336
[14] Fowler, A.P.G., Zierenberg, R.A., Reed, M.H., Palandri, J., Óskarsson, F., Gunnarsson, I. (2019). Rare earth element systematics in boiled fluids from basalt-hosted geothermal systems. Geochimica et Cosmochimica Acta, 244: 129-154. https://doi.org/10.1016/j.gca.2018.10.001
[15] Wulaningsih, T., Humaida, H., Harijoko, A., Watanabe, K. (2013). Major element and rare earth elements investigation of Merapi Volcano, Central Java, Indonesia. Procedia Earth and Planetary Science, 6: 202-211. https://doi.org/10.1016/j.proeps.2013.01.027
[16] Mulyono, A., Setiawan, I., Hidayat, E., Noviardi, R. (2024). Distribution and potential contamination assessment of rare earth elements (REE) in Indonesian volcanic soil. Ecological Frontiers, 44(1): 33-41. https://doi.org/10.1016/j.chnaes.2023.05.010
[17] Khumaeni, A., Indriana, R.D., Jonathan, F., Fiantis, D., Ginting, F.I., Idris, N., Kurniawan, H. (2025). Analysis of geochemical and mineral compositions of volcanic soil affected by Merapi eruption in Central Java Indonesia using laser-induced breakdown spectroscopy with calibration-free. Talanta, 295: 128376. https://doi.org/10.1016/j.talanta.2025.128376
[18] Wang, B., Xia, D., Yu, Y., Jia, J., Nie, Y., Wang, X. (2015). Detecting the sensitivity of magnetic response on different pollution sources – A case study from typical mining cities in northwestern China. Environmental Pollution, 207: 288-298. https://doi.org/10.1016/j.envpol.2015.08.041
[19] Zong, Y., Xiao, Q., Lu, S. (2017). Magnetic signature and source identification of heavy metal contamination in urban soils of steel industrial city, Northeast China. Journal of Soils and Sediments, 17(1): 190-203. https://doi.org/10.1007/s11368-016-1522-2
[20] Zulaikah, S., Juliansyah, A., Hasan, M.F.R., Iswanto, B.H., Mariyanto, M., Tanjung, A., Bijaksana, S., Hirt, A. M. (2023). Magnetic susceptibility and hydrogen cyanide levels as proxy indicator for gold mining pollution in river sediment. Pertanika Journal of Science and Technology, 31(6): 2689-2702. https://doi.org/10.47836/pjst.31.6.03
[21] El Baghdadi, M., Jakani, K., Barakat, A., Bay, Y. (2011). Magnetic susceptibility and heavy metal contamination in agricultural soil of Tadla plain. Journal of Materials and Environmental Science, 2: 513-519.
[22] Canbay, M., Aydin, A., Kurtulus, C. (2010). Magnetic susceptibility and heavy-metal contamination in topsoils along the Izmit Gulf coastal area and IZAYTAS (Turkey). Journal of Applied Geophysics, 70(1): 46-57. https://doi.org/10.1016/j.jappgeo.2009.11.002
[23] Salehi, M.H., Jorkesh, S., Mohajer, R. (2013). Relationship between magnetic susceptibility and heavy metals concentration in polluted soils of Lenjanat Region, Isfahan. E3S Web of Conferences, 1: 04003. https://doi.org/10.1051/e3sconf/20130104003
[24] Vodyanitskii, Y.N., Shoba, S.A. (2015). Magnetic susceptibility as an indicator of heavy metal contamination of urban soils (Review). Moscow University Soil Science Bulletin, 70(1): 10-16. https://doi.org/10.3103/S014768741501007X
[25] Pandarinath, K., García-Soto, A.Y., Santoyo, E., Guevara, M., Gonzalez-Partida, E. (2020). Mineralogical and geochemical changes due to hydrothermal alteration of the volcanic rocks at Acoculco geothermal system, Mexico. Geological Journal, 55(9): 6508-6526. https://doi.org/10.1002/gj.3817
[26] Zulaikah, S., Damayanti, C.S., Hafiz, Hapsoro, C.A., Laksono, Y.A., Iswanto, B.H., Herrin, J.S., Hasan, M.F.R. (2023). Magnetic Signature and Element Content of Upflow and Outflow Hotspring in Arjuno–Welirang Geothermal System. International Journal on Advanced Science, Engineering and Information Technology, 13(3): 1202-1209. https://doi.org/10.18517/ijaseit.13.3.18009
[27] Bachri, S., Fathoni, M.N., Sumarmi, Masruroh, H., Wibowo, N.A., Khusna, N., Billah, E.N., Yudha, L. (2023). Geomorphological mapping and landform characterization of Semeru volcano after the eruption in 2021. IOP Conference Series: Earth and Environmental Science, 1180(1): 012004. https://doi.org/10.1088/1755-1315/1180/1/012004
[28] Hariyono, E., Fahmi, M.N., Wulandari, A. (2023). Morphological identification of rocks around Ranupani Village, Mount Semeru, Lumajang, East Java. Journal of Physics: Conference Series, 2623(1): 012030. https://doi.org/10.1088/1742-6596/2623/1/012030
[29] Putra, R.S., Zulaikah, S., Hapsoro, C.A., Laksono, Y.A., Pratama, A., Fitriani, D., Muztaza, N., Mariyanto. (2025). Europium (Eu) content and magnetic susceptibility of Semeru’s volcanic materials. AIP Conference Proceedings, 3197(1): 020024. https://doi.org/10.1063/5.0242024
[30] Zakly, H.I, Zulaikah, S., Hapsoro, C.A., Maulida, S., Hasan, M.F.R. (2024). Chemical element analysis of Arjuno-Welirang igneous rocks. Environmental Science and Pollution Research, pp. 1-13. https://doi.org/10.1007/s11356-024-33495-4
[31] Geological map of Turen Quadrangle, Java (1:100 000). Geological Research and Development Centre. https://geologi.esdm.go.id/geomap/pages/preview/peta-geologi-lembar-turen-jawa.
[32] Frimberger, T., Andrade, S.D., Weber, S., Krautblatter, M. (2021). Modelling future lahars controlled by different volcanic eruption scenarios at Cotopaxi (Ecuador) calibrated with the massively destructive 1877 lahar. Earth Surface Processes and Landforms, 46(3): 680-700. https://doi.org/10.1002/esp.5056
[33] Sindern, S. (2017). Analysis of rare earth elements in rock and mineral samples by ICP-MS and LA-ICP-MS. Physical Sciences Reviews, 2(2): 20160066. https://doi.org/10.1515/psr-2016-0066
[34] Khan, K.F., Dar, S.A., Khan, S.A. (2012). Rare earth element (REE) geochemistry of phosphorites of the Sonrai area of Paleoproterozoic Bijawar Basin, Uttar Pradesh, India. Journal of Rare Earths, 30(5): 507-514. https://doi.org/10.1016/S1002-0721(12)60081-7
[35] Dearing, J.A. (1999). Environmental Magnetic Susceptibility Using the Bartington MS2 System (Second ed). Chi Publishing.
[36] Wu, C.Y., Hseu, Z.Y. (2023). Pedochemical behaviors of rare earth elements in soil profiles along a lithosequence in eastern Taiwan. CATENA, 225: 107047. https://doi.org/10.1016/j.catena.2023.107047
[37] Chapela Lara, M., Buss, H.L., Pett-Ridge, J.C. (2018). The effects of lithology on trace element and REE behavior during tropical weathering. Chemical Geology, 500: 88-102. https://doi.org/10.1016/j.chemgeo.2018.09.024
[38] Sangode, S.J., Tembhurne, S., Mahajan, R., Deenadayalan, K., Meshram, D.C., Dongre, A.N., Bhagat, A.R., Satyanarayana, K.V.V. (2022). Magnetic fabrics and magnetic mineralogical variations in Lava Channel: An example from the Deccan Volcanic Province, India. Journal of Earth System Science, 131(1): 24. https://doi.org/10.1007/s12040-021-01769-x
[39] Sholeh, A., Rastad, E., Huston, D., Gemmell, J.B., Taylor, R.D. (2016). The chahnaly low-sulfidation epithermal gold deposit, Western Makran volcanic arc, Southeast Iran. Economic Geology, 111(3): 619-639. https://doi.org/10.2113/econgeo.111.3.619
[40] Loucks, R.R. (2014). Distinctive composition of copper-ore-forming arc magmas. Australian Journal of Earth Sciences, 61(1): 5-16. https://doi.org/10.1080/08120099.2013.865676
[41] Sun, S.S., McDonough, W.F. (1989). Chemical and isotopic systematics of oceanic basalts: Implications for mantle composition and processes. Geological Society, London, Special Publications, 42(1): 313-345. https://doi.org/10.1144/GSL.SP.1989.042.01.19
[42] Wen, L., Huang, W., Zhang, Y., Jiu, B. (2024). Geochemical characteristics of rare earth elements in late Palaeozoic coals from North China. Frontiers in Earth Science, 12: 1374780. https://doi.org/10.3389/feart.2024.1374780
[43] Markl, G. (2001). REE constraints on fractionation processes of massive-type anorthosites on the Lofoten Islands, Norway. Mineralogy and Petrology, 72(4): 325-351. https://doi.org/10.1007/s007100170022
[44] Xu, J., Xia, X.P., Wang, Q., Spencer, C.J., Lai, C.K., Zhang, L. (2022). Two magma fractionation paths for continental crust growth: Insights from the adakite-like and normal-arc granites in the Ailaoshan fold belt (SW Yunnan, China). GSA Bulletin, 134(11-12): 2986-3002. https://doi.org/10.1130/B36230.1
[45] Lee, S.G., Tanaka, T., Lee, M.J. (2023). Geochemical implication of Eu isotopic ratio in anorthosite: New evidence of Eu isotope fractionation during feldspar crystallization. Geosciences Journal, 27(3): 271-284. https://doi.org/10.1007/s12303-023-0009-6
[46] Khedr, M.Z., Abo Khashaba, S.M., El-Shibiny, N.H., El-Arafy, R.A., Takazawa, E., Azer, M.K., Palin, R.M. (2022). Remote sensing techniques and geochemical constraints on the formation of the Wadi El-Hima mineralized granites, Egypt: New insights into the genesis and accumulation of garnets. International Journal of Earth Sciences, 111(7): 2409-2443. https://doi.org/10.1007/s00531-022-02237-7
[47] Sun, M., Tang, J.X., Klemd, R., Lin, B., et al. (2024). The formation of a giant post-collision porphyry copper system: A case study of the Jiama deposit, Tibet. Geological Society of America Bulletin, 136(3-4): 1675-1688. https://doi.org/10.1130/B36924.1
[48] Henderson, P. (1982). Inorganic Geochemistry (First). Pergamon Press.
[49] Dygert, N., Ustunisik, G.K., Nielsen, R.L. (2024). Europium in plagioclase-hosted melt inclusions reveals mantle melting modulates oxygen fugacity. Nature Communications, 15(1): 3033. https://doi.org/10.1038/s41467-024-47224-5
[50] Santoso, N.A., Syaifullah, K.I., Zulaikah, S., Bijaksana, S. (2019). Magnetic characterization of soil to determine the source origin. Case study: Soil around Bromo Volcano, Tengger Volcanic Complex. IOP Conference Series: Earth and Environmental Science, 311(1): 012039. https://doi.org/10.1088/1755-1315/311/1/012039
[51] Henderson, P. (1984). General geochemical properties and abundances of the rare earth elements. In Developments in Geochemistry, 2: 1-32. https://doi.org/10.1016/B978-0-444-42148-7.50006-X
[52] Downes, H. (2021). Ultramafic rocks. In Encyclopedia of Geology, pp. 69-75. https://doi.org/10.1016/B978-0-12-409548-9.12478-9
[53] Tampubolon, A., Syafri, I., Rosana, M.F., Yuningsih, E.T. (2024). Secondary enrichment of REE in weathered granite, South Bangka, Indonesia. Indonesian Journal on Geoscience, 11(1): 141-165. https://doi.org/10.17014/ijog.11.1.141-165
[54] Pal, D.C., Basak, S., McFarlane, C., Sarangi, A.K. (2021). EPMA geochemistry and LA-ICPMS dating of allanite, epidote, monazite, florencite and titanite from the Jaduguda uranium deposit, Singhbhum Shear Zone, eastern India: Implications for REE mineralization vis-à-vis tectonothermal events in the Proterozoic Mo. Precambrian Research, 359: 106208. https://doi.org/10.1016/j.precamres.2021.106208
[55] Maraszewska, M., Broska, I., Kurylo, S., Konečný, P. (2023). The composite zircon–xenotime–monazite–allanite assemblage in the leucogranite from the Low Tatra Pluton, Western Carpathians: Interplay of melts and fluids. Geologica Carpathica, 74(5): 387-406. https://doi.org/10.31577/GeolCarp.2023.23
[56] Girnis, A.V. (2023). Trace element partitioning between olivine and melt: Analysis of experimental data. Geochemistry International, 61(4): 311-323. https://doi.org/10.1134/S0016702923040055
[57] Louvel, M., Etschmann, B., Guan, Q., Testemale, D., Brugger, J. (2022). Carbonate complexation enhances hydrothermal transport of rare earth elements in alkaline fluids. Nature Communications, 13(1): 1456. https://doi.org/10.1038/s41467-022-28943-z
[58] Šegvić, B., Badurina, L., Braga, A.E., Mandic, O., Werts, K., Doyle, E., Slovenec, D., Marković, F., Slivšek, G., Demir, V. (2024). Mobility patterns of rare earth elements in diagenetically altered vitric tuff shaped by illite-smectite. Clays and Clay Minerals, 72: e14. https://doi.org/10.1017/cmn.2024.21
[59] Pandarinath, K., Shankar, R., Torres-Alvarado, I.S., Warrier, A.K. (2014). Magnetic susceptibility of volcanic rocks in geothermal areas: Application potential in geothermal exploration studies for identification of rocks and zones of hydrothermal alteration. Arabian Journal of Geosciences, 7(7): 2851-2860. https://doi.org/10.1007/s12517-013-1013-3
[60] Petrovský, E., Kapička, A., Grison, H., Kotlík, B., Miturová, H. (2020). Negative correlation between concentration of iron oxides and particulate matter in atmospheric dust: Case study at industrial site during smoggy period. Environmental Sciences Europe, 32(1): 134. https://doi.org/10.1186/s12302-020-00420-8
[61] Grison, H., Petrovsky, E., Hanzlikova, H. (2021). Assessing anthropogenic contribution in highly magnetic forest soils developed on basalts using magnetic susceptibility and concentration of elements. CATENA, 206: 105480. https://doi.org/10.1016/j.catena.2021.105480
[62] Ray, A., Patil, S.K., Paul, D.K., Biswas, S.K., Das, B., Pant, N.C. (2006). Petrology, geochemistry and magnetic properties of Sadara sill: Evidence of rift related magmatism from Kutch basin, northwest India. Journal of Asian Earth Sciences, 27(6): 907-921. https://doi.org/10.1016/j.jseaes.2005.09.006