Non-Destructive Estimation of Leaf Area in Cinchona micrantha and Cinchona pubescens Using Linear Regression Models

Franklin H. Fernandez-Zarate*![]() | Lorin Cruz
| Lorin Cruz![]() | Elena Sánchez | Mariela J. Quispe
| Elena Sánchez | Mariela J. Quispe![]() | David Coronel-Bustamante
| David Coronel-Bustamante![]() | Luis Perez-Delgado
| Luis Perez-Delgado![]() | Jerson Tantalean
| Jerson Tantalean![]() | Azucena Chavez-Collantes
| Azucena Chavez-Collantes![]() | Victor Hugo Taboada-Mitma
| Victor Hugo Taboada-Mitma![]() | Juancarlos Cruz-Luis
| Juancarlos Cruz-Luis![]() | Alejandro Seminario-Cunya
| Alejandro Seminario-Cunya![]() | Annick Estefany Huaccha-Castillo
| Annick Estefany Huaccha-Castillo![]()
© 2025 The authors. This article is published by IIETA and is licensed under the CC BY 4.0 license (http://creativecommons.org/licenses/by/4.0/).
OPEN ACCESS
Accurate quantification of leaf area is essential for ecophysiological, agronomic, and conservation studies, especially in threatened species such as Cinchona micrantha and Cinchona pubescens. This study evaluated simple, quadratic, and composite linear regression models to estimate leaf area non-destructively using morphometric measurements (length and width). A sample of n=800 leaves from 32 individuals was systematically collected and analyzed using a standardized photographic protocol with digital processing in ImageJ. The most robust models were those incorporating composite variables such as the product of length and width (L × W) and the sum squared of both dimensions ((L + W)²), reaching coefficients of determination higher than 0.97. These models consistently outperformed models based on single variables, providing higher accuracy and lower prediction error. High correlations were observed between leaf dimensions and area, and C. pubescens showed greater morphological variability. These findings establish that simple linear models based on L × W are efficient, replicable, and low-cost tools for non-destructive estimation of leaf area, which improves ecological monitoring and supports sustainable forest management, essential for the conservation of these Cinchona species, important from an ecological and medicinal point of view, in tropical ecosystems.
cinchona tree, leaf morphometry, forest conservation, allometric analysis
Non-destructive estimation of leaf area is essential for ecophysiological and agronomic studies, as it allows monitoring plant growth without altering plant integrity [1, 2]. The study was conducted in the Peruvian Andes, a critical biodiversity hotspot within the Tropical Andes, recognized as one of the world’s most diverse ecoregions, harboring unique flora and fauna adapted to its altitudinal gradients and microclimates [3]. This region plays a vital role in regulating water cycles, carbon sequestration, and supporting endemic species, making it a priority for conservation and ecological research [4]. In species of the genus Cinchona, of medical and ecological relevance, this approach acquires special importance due to their conservation status and their role in tropical ecosystems [5, 6]. The selection of Cinchona micrantha and Cinchona pubescens for this study was driven by their ecological significance as keystone species in Andean forests, contributing to ecosystem stability, and their economic value as sources of quinine, a critical antimalarial compound historically and culturally significant in Peru [5, 7]. These species are also threatened due to overexploitation and habitat loss, necessitating non-destructive methods for monitoring to support conservation efforts [8]. Traditional measurement methods, such as the use of planimeters or destructive techniques, are unfeasible for long-term studies or in threatened populations [9-12].
The relationship between leaf dimensions (length and width) and leaf area has been documented in multiple species using allometric models [13-17]. For Cinchona, however, these models are scarce, despite morphological variability between species such as C. micrantha and C. pubescens [6]. The lack of specific equations limits the precision in the quantification of biomass and primary productivity, key parameters for their sustainable management [6, 18].
Advances in non-destructive techniques, such as the use of linear regressions based on leaf dimensions, offer a balanced solution between accuracy and practicality [19, 20]. Studies in tropical tree species show that models with variables such as the product length × width (L × W) achieve high coefficients of determination [11, 12, 21, 22]. These approaches are especially useful in Cinchona, where leaf diversity requires models adapted to its morphoanatomical traits [6].
The choice of predictors in the models is critical. While some species respond best to simple linear relationships (L or W), others require composite variables (L², W², or L × W) [10, 23, 24]. In C. pubescens, for example, the elongated shape of its leaves suggests that L × W might be optimal, whereas in C. micrantha, with more rounded leaves, the use of L² might be more appropriate; this variability underscores the need to develop species-specific models [6].
In addition to accuracy, field applicability is essential. Methods based on digital photographs or handheld scanners have gained popularity, but their cost and complexity limit their use in rural areas [25, 26]. In contrast, regressions with manual measurements of L and W, combined with cross-validation, offer an affordable alternative without sacrificing scientific rigor [18].
Climate change adds urgency to these efforts. The ability to rapidly monitor leaf area allows assessment of physiological responses to water or heat stress in Cinchona; robust models would facilitate integration of these data into early warning systems for conservation [5, 6]. This study proposes to develop and validate non-destructive linear regression models to estimate leaf area in C. micrantha and C. pubescens, considering their morphological differences. The results will provide tools for ecophysiological research, agroforestry management, and restoration programs in the tropical Andes.
2.1 Location of study area
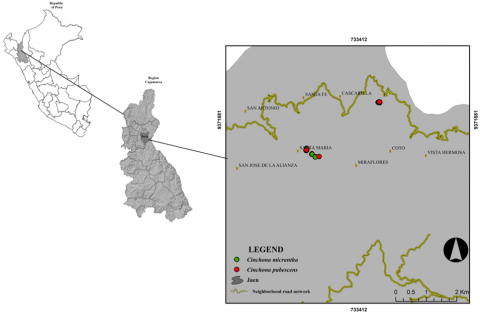
Leaf length and width data of C. micrantha and C. pubescens were collected from the jurisdiction of the community of La Cascarilla (5°40′21.12″ S and 78°53′55.65″ W) located at 1930 meters above sea level, district and province of Jaén, department of Cajamarca (Figure 1). Sampling was carried out in March 2024, and collections were made in the morning (7:00-10:00 a.m.) to avoid the midday heat and the effects of dehydration on leaf morphology [27].
Figure 1. Location of the study area
2.2 Leaf collection of Cinchona pubescens and Cinchona micrantha
Leaf collection was performed on a total of 32 individuals, corresponding to the species Cinchona pubescens and Cinchona micrantha, with the purpose of obtaining a representative sample of 800 leaves (400 leaves for each species) [12]. Individuals were selected using a stratified random sampling approach, where trees were grouped by size classes (based on diameter at breast height, DBH: small <10 cm, medium 10–20 cm, large >20 cm) to account for potential morphological variation due to tree age and size [28]. Within each size class, individuals were randomly chosen from a pre-identified population to ensure representativeness across the study area. To ensure a homogeneous distribution, the crown of each tree was segmented into five vertical strata (E1 to E5), thus allowing a systematic sampling from the base to the apex of the canopy. Five leaves in optimal phytosanitary condition were selected from each stratum, giving a total of 25 leaves per tree.
2.3 Photographic montage of the leaves
The capture of leaf images was carried out using a Redmi 12 Pro mobile device, equipped with a 50 megapixel resolution camera. To ensure standardized conditions for photographic acquisition, a 40 × 60 cm reference surface was used, on which a white background was placed, ensuring optimal contrast between the leaves and the background.
A 2 cm long reference baseline was incorporated next to each leaf, which served as a calibration scale during digital processing. In order to keep the sheets fully extended and minimize curvatures or undulations that could affect the accuracy of the measurements, a 3 mm-thick transparent glass was placed over the samples, whose dimensions coincided with those of the board. The photographs were taken from a constant height of 20 cm above the sample, taking strict care of the lighting conditions to avoid the generation of shadows or reflections that would compromise the visual quality of the images. This protocol made it possible to obtain clear and detailed photographic records, fundamental for the subsequent morphometric analysis.
2.4 Determination of leaf morphometric variables
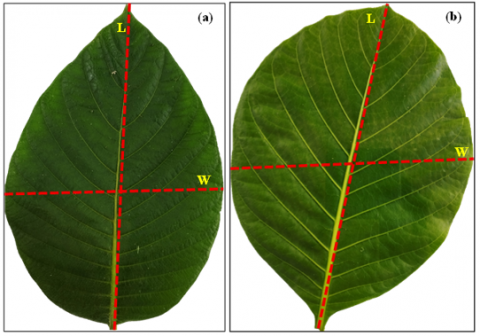
The morphometric variables, length (L), width (W) (Figure 2), and leaf area (LA) were obtained using ImageJ software, recognized for its precision in the analysis of scientific images. ImageJ version 1.53 was used, following this process: File > Open > Line Width > Analyze > Scale > Polygonal Selections > Analyze > Measure [29]. The images were processed in TIFF format to preserve resolution, with contrast adjusted to improve differentiation between leaves and background. Leaf length was defined as the distance between the leaf apex and the base of the petiole, while width was measured as the maximum transverse segment, perpendicular to the longitudinal axis of the leaf. In order to reduce individual bias and improve data reliability, measurements were performed independently by three evaluators, thus replicating a quality control criterion in morphometric analysis [6, 12].
Figure 2. Location of leaf length (L) and width (W) measurements. (a) Cinchona pubescens, (b) Cinchona micrantha
2.5 Statistical analysis
To characterize and explore the variability of the leaf morphometric variables - length (L), width (W), and leaf area (LA) - violin plots were used to simultaneously visualize the distribution of the data and their density. Subsequently, Pearson correlation coefficients were calculated between the dependent variable (LA) and the independent variables (L, W, L², W², (L + W)², and L × W), in order to identify the most significant linear associations.
Simple linear regression models were fitted using each of the aforementioned independent variables as predictors of leaf area, following the methodology proposed by Keramatlou et al. [30]. To evaluate the performance of the generated models, common statistical metrics of fit and prediction, such as root mean square error (RMSE) and Akaike's information criterion (AIC), were calculated, which allowed comparing the relative quality of the fitted models.
2.6 Model validation
To validate the predictive capacity of the developed models, the dataset (n = 800 leaves) was randomly divided into two subsets: 80% intended for model training and 20% reserved for model validation, in accordance with statistical robustness criteria [6, 12]. The selection of the optimal model was based on the combination of a higher coefficient of determination (R²) and the lowest values of MAE, MSE, RMSE, and AIC.
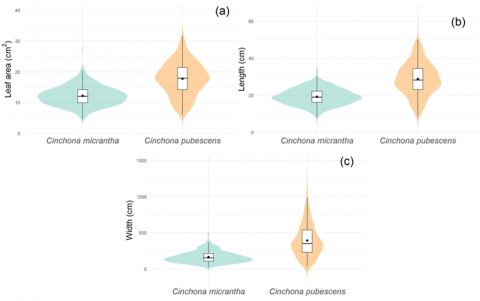
Figure 3 combines the representation of data density with an overlaid boxplot, which allows simultaneous observation of the variability, asymmetry, and outliers of the samples analyzed. Figure 3(a) shows that C. pubescens has a considerably larger leaf area range compared to C. micrantha, with a higher median and greater dispersion, evidencing larger leaves and greater intraspecific heterogeneity. Figure 3(b) shows that leaf length is also significantly greater in C. pubescens, which coincides with the trend observed for leaf area. Finally, a similar behavior is reported for leaf width, where again C. pubescens presents higher values and a wider distribution than C. micrantha (Figure 3(c)).
Figure 3. Violin plot illustrating the distribution of three leaf morphometric variables, leaf area (a), length (b), and width (c) for Cinchona micrantha and Cinchona pubescens
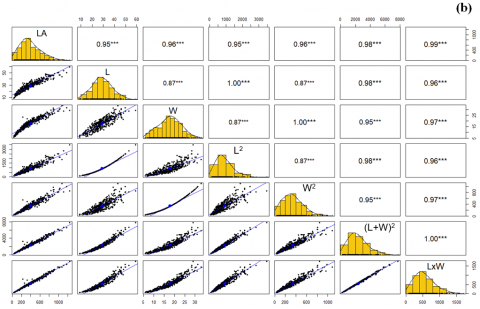
Figure 4 presents scatterplot matrices with Pearson correlation coefficients between leaf area (LA) and six derived morphometric variables: length (L), width (W), the square of length (L²), the square of width (W²), the square of the sum of length and width ((L + W)²), and the product of length and width (L × W), corresponding to leaves of Cinchona micrantha (Figure 4(a)) and Cinchona pubescens (Figure 4(b)). Each cell of the matrix shows the bivariate relationship between a pair of variables, accompanied by the value of Pearson's correlation coefficient and a univariate histogram on the main diagonal representing the distribution of each variable. Statistically significant correlations (p < 0.001) are indicated by three asterisks (***).
Figure 4. Matrix of correlation diagrams by Pearson's test between LA, L, W, L², W², (L + W)², and L × W of leaves of C. micrantha (a) and C. pubescens (b)
In both species, a high positive correlation is observed between leaf area (LA) and the derived variables, particularly highlighting the product L × W and the variable (L + W)², which reach correlation coefficients higher than 0.98, evidencing their strong predictive potential. Likewise, the variables L and W show moderately high correlations with LA (r > 0.87), although lower than those obtained with their quadratic and multiplicative transformations.
In C. micrantha, correlation coefficients reach values up to 0.99 between LA and L × W, as well as between LA and (L + W)², indicating that both composite variables can serve as highly efficient predictors of leaf area. This trend is replicated in C. pubescens, although with slight variations in absolute values, also evidencing a strong association between LA and the combined variables.
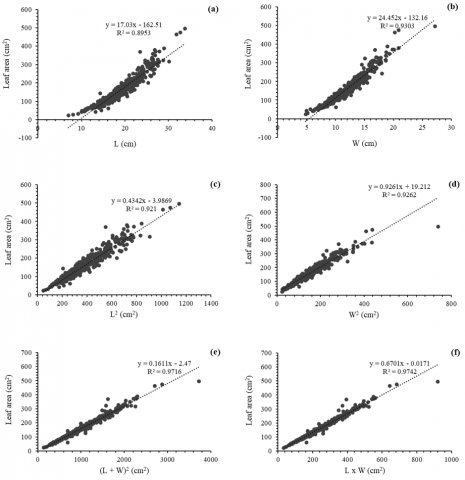
Figure 5 presents the linear regression models fitted to estimate leaf area (cm²) from different leaf morphometric variables. In Figures 5(a) and 5(b), leaf area is related to L and W, respectively, showing significant linear fits with R² values of 0.8953 and 0.9303. Although both models show good predictive capacity, width (W) shows a slightly higher correlation with leaf area.
Models based on the quadratic variables L² and W² (Figure 5(c) and 5(d)) show improved fit, with R² values of 0.921 and 0.9262, respectively. This suggests that the nonlinear transformations better capture the relationship between leaf dimension and leaf area.
The best performances are observed in the models constructed with composite variables: (L + W)² (Figure 5(e)) and L × W (Figure 5(f)), reaching coefficients of determination of 0.9716 and 0.9742, respectively. These two expressions simultaneously integrate the longitudinal and transverse dimensions of the leaf, reflecting more accurately its real area.
Figure 5. Linear regression models predicting leaf weight of C. micrantha as a function of independent variables
Table 1 summarizes the statistical indicators of fit for six linear regression models estimating leaf area (LA) from different leaf morphometric variables. It was observed that the model based on the product of length by width (L × W) presented the highest R² (0.974), followed closely by the model (L + W)² (R² = 0.972). These results confirm that composite variables that integrate both leaf dimensions, in multiplicative or quadratic form, explain leaf area variation more accurately. As for the mean absolute error (MAE), the differences between models were minimal (range: 150.684-151.592 cm²), indicating a relatively stable accuracy in the predictions. However, the model with the lowest MAE was also the (L + W)² model, reinforcing its robust performance.
Table 1. Summary of the evaluation of the six models for predicting leaf area of C. micrantha according to the training data set
|
Code |
Model |
Variable |
R2 |
MAE |
MSE |
RMSE |
AIC |
|
a |
y = 17.03x - 162.51 |
L (cm) |
0.895 |
151.592 |
28759.450 |
169.586 |
632.644 |
|
b |
y = 24.452x - 132.16 |
W (cm) |
0.930 |
151.305 |
29066.830 |
170.490 |
633.187 |
|
c |
y = 0.4342x - 3.9869 |
L2 (cm) |
0.921 |
150.777 |
28944.780 |
170.132 |
632.972 |
|
d |
y = 0.9261x + 19.212 |
W2 (cm) |
0.926 |
150.740 |
29063.700 |
170.481 |
633.181 |
|
e |
y = 0.1611x - 2.47 |
(L + W)2 (cm) |
0.972 |
150.684 |
29283.910 |
171.125 |
633.566 |
|
f |
y = 0.6701x - 0.0171 |
L × W (cm) |
0.974 |
150.733 |
29331.140 |
171.263 |
633.648 |
The mean squared error (MSE) values and its root (RMSE) did not present substantial differences between the models, although it is important to note that the lowest values were concentrated in the model based on length (L), followed by L², which could be due to a lower complexity in the univariate relationship, although with lower overall accuracy.
The Akaike Information Criterion (AIC), used to balance model fit and complexity, showed the lowest values for the L-based model (AIC = 632.644), followed closely by L² (AIC = 632.972) and W² (AIC = 633.181). However, since the differences in AIC between the models are less than 2 units, they are considered statistically equivalent [31], which allows us to prioritize R² and RMSE as deterministic criteria.
Overall, the results indicate that, although all models present acceptable levels of fit, the model based on the L × W product offers the best compromise between predictive ability (highest R²) and accuracy (competitive RMSE), which positions it as the most suitable for non-destructive estimates of leaf area in species of the genus Cinchona.
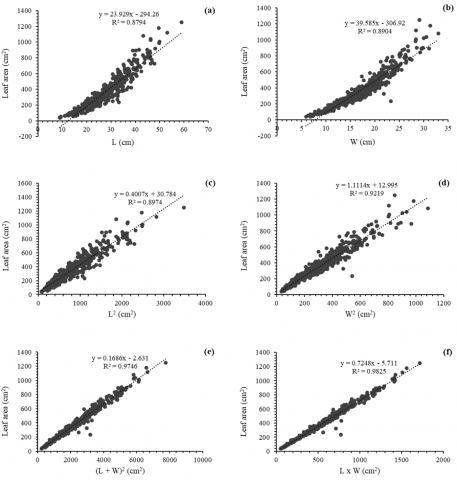
Figure 6 presents six simple linear regression models describing the relationship between leaf area (dependent variable) and various morphometric variables (independent variables) of C. pubescens leaves. Each plot represents a model fitted using different combinations of linear leaf measurements.
Figures 6(a) and (b) show models using leaf length (L) and width (W) as predictors, respectively. Both models present relatively high coefficients of determination (R² = 0.8794 and R² = 0.8904), indicating a positive and significant association between each dimension and leaf area. However, some scattering of the data is apparent at high values of L and W, suggesting a loss of prediction accuracy when leaf dimensions are extreme.
Figures 6(c) and (d) show models based on quadratic transformations of the above variables (L² and W²), which substantially improve the model fit (R² = 0.8974 for L² and R² = 0.9219 for W²). In Figure 6(e), a model using the sum of the squared areas (L + W)² is presented, which achieves a coefficient of determination of R² = 0.9746. This model integrates two key dimensions of the leaf and outperforms the previous models in predictive capacity.
Finally, the model shown in Figure 6(f), which uses the product of length and width (L × W), offers the highest explanatory power with an R² = 0.9825. This result suggests that leaf area can be estimated with high accuracy by a simple function of the product of linear dimensions, this model being the most robust and efficient for predicting leaf area of C. pubescens.
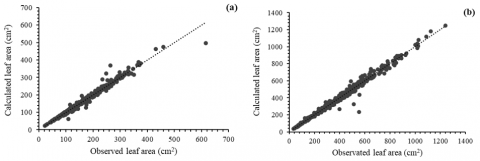
Figure 7 illustrates the scatter plots comparing observed versus estimated leaf area values for Cinchona micrantha (a) and Cinchona pubescens (b), based on the predictive model incorporating the L × W variable. Each point represents an individual observation, and the dotted line denotes the 1:1 line, which serves as a reference for perfect agreement between observed and predicted values. In panel (a), the data points are closely clustered along the 1:1 line, suggesting a high degree of concordance between measured and estimated leaf areas. The distribution of the residuals appears homoscedastic, with minor deviations at higher leaf area values, indicating slight underestimation by the model at the upper end of the range. Panel (b) shows the corresponding results for C. pubescens. The scatter pattern reveals a similarly strong alignment with the 1:1 line, with slightly higher dispersion than C. micrantha, particularly at the extremes of the observed range. Nevertheless, the model demonstrates a robust predictive capacity, with minimal systemic bias and a narrow spread of residuals.
Figure 6. Linear regression models predicting leaf weight of C. pubescens as a function of independent variables
Figure 7. Scatter plot of observed values vs. estimated values, Cinchona micrantha (a) and Cinchona pubescens (b)
Table 2. Summary of the evaluation of the six models for predicting the leaf area of C. pubescens according to the training data set
|
Code |
Model |
Variable |
R2 |
MAE |
MSE |
RMSE |
AIC |
|
a |
y = 23.929x - 294.26 |
L (cm) |
0.879 |
383.186 |
190065.000 |
435.964 |
728.953 |
|
b |
y = 39.585x - 306.92 |
W (cm) |
0.890 |
382.618 |
190483.400 |
436.444 |
729.065 |
|
c |
y = 0.4007x + 30.784 |
L2 (cm) |
0.897 |
379.805 |
191087.900 |
437.136 |
729.227 |
|
d |
y = 1.1114x + 12.995 |
W2 (cm) |
0.922 |
379.815 |
192204.200 |
438.411 |
729.524 |
|
e |
y = 0.1686x - 2.631 |
(L + W)2 (cm) |
0.975 |
379.806 |
194985.700 |
441.572 |
730.256 |
|
f |
y = 0.7248x - 5.711 |
L × W (cm) |
0.983 |
379.823 |
195386.700 |
442.026 |
730.361 |
Table 2 summarizes the comparative evaluation of six linear regression models developed to predict the leaf area of C. pubescens from different morphometric variables. The coefficients of determination (R²), mean absolute error (MAE), mean square error (MSE), root mean square error (RMSE), and Akaike information criterion (AIC), all calculated on the training data set, are presented.
Models based on individual variables such as length (model a) and width (model b) present relatively high R² values (0.879 and 0.890, respectively); however, they exhibit higher values of MSE and RMSE, indicating lower prediction accuracy. Models incorporating quadratic transformations of these dimensions (models c and d) show a progressive improvement in fit (R² = 0.897 and 0.922, respectively), suggesting that nonlinear relationships better explain leaf area variability.
Model e, which uses the sum of the squared areas of L and W, achieves an R² of 0.975 with marginal improvements in MAE, although with slight increases in MSE and RMSE values. However, model f, based on the product between length and width (L × W), stands out for presenting the best overall performance, with a coefficient of determination of R² = 0.983, the highest among all the models evaluated. Although the MSE and RMSE values are slightly higher than those of some intermediate models, its balance between precision and simplicity makes it the optimal model for estimating leaf area. This result is also reflected in the AIC value, which, although not the lowest, remains competitive considering the substantial improvement in R².
Non-destructive estimation of leaf area in tropical forest species is a crucial tool in ecophysiological and conservation studies; therefore, the length, width, and the combination of these variables of a leaf have been used in regression as predictors of leaf area for non-destructive estimation [6, 32-37]. In the case of C. micrantha and C. pubescens, species of ecological and medicinal value, allometric models based on simple morphometric variables have shown high predictive efficiency, especially when composite variables such as the product of length times width (L × W) or their sum squared ((L + W)²) are employed. This strategy has been supported by similar studies in other species such as Coffea arabica [21], Tectona grandis [15] and Jatropha curcas [13], where L × W models have explained more than 95% of the variation in leaf area, coinciding with the results of the present study for C. micrantha and C. pubescens (R² = 0.974 and R² = 0.983).
Although individual variables such as length (L) or width (W) show significant relationships with leaf area, their models tend to be less accurate at extreme ranges, as has also been observed in Arabidopsis thaliana [14] and Theobroma cacao [12]. In this study, models based solely on L or W presented lower coefficients of determination, for C. micrantha (R² = 0.895) and for C. pubescens (R² = 0.879 and 0.890, respectively), and higher errors (RMSE > 169 for C. micrantha and RMSE > 435 for C. pubescens), reflecting an inherent limitation of using univariate variables. This validates the hypothesis that models with interaction of dimensions better represent the morphological complexity of compound leaves or high intraspecific variability.
The use of quadratic transformations (L², W², (L+W)²) has proven to be an effective intermediate strategy between simple and composite models. Studies in Vitis vinifera [38], Hazelnut [10], and Citrus hystrix [22] report substantial improvements in accuracy with this approach. In the present analysis, the model with (L + W)² achieved an R² = 0.972 and R² = 0.975 for C. micrantha and C. pubescens, respectively, just below that of L × W, but with the lowest MAE recorded. This similarity in performance between models suggests that both could be useful depending on the practical objective: (L + W)² for greater accuracy, and L × W for field applications due to its operational simplicity.
Despite the high accuracy of the L × W model, there are limitations to its applicability at different stages of leaf growth. The models were developed using fully expanded mature leaves under optimal phytosanitary conditions, which may not accurately predict the leaf area of juvenile or senescent leaves due to differences in shape and size during ontogeny [39]. For example, juvenile leaves of Cinchona species may have more rounded shapes, which could reduce the predictive ability of the L × W model, as has been observed in other tropical species [40]. Future studies should incorporate leaves from various stages of development to assess the robustness of the model at different ontogenetic phases.
Climatic factors such as temperature, humidity, and precipitation can also influence the applicability of these models. The study was conducted during the wet season in the Peruvian Andes, where water is available, which may lead to larger or differently shaped leaves, potentially affecting the accuracy of the L × W model [41]. In addition, climate-induced stress, such as drought or high temperatures, can alter leaf morphology, as has been observed in other tropical trees [42]. To improve the robustness of the model, it is recommended to perform calibration across seasons and under variable climatic conditions.
From a methodological perspective, the applicability of these models in the field depends not only on their accuracy but also on the ease of implementation. Unlike methods based on digital images [25, 26], linear models such as L × W require only manual measurements with basic instruments, which facilitates their adoption in rural or hard-to-reach areas. The cross-validation of the present study, with training and testing splits (80-20%), reinforces the reliability of the selected model and follows robust methodological recommendations [6, 30].
For practical applications, the L × W model is recommended for integration into forest monitoring programs in the Peruvian Andes, particularly for Cinchona conservation and management. The model can be used to monitor phenological changes, assess responses to abiotic stressors (e.g., drought or temperature shifts), and estimate biomass for restoration projects [43]. Specifically, forest managers can employ this model in long-term ecological monitoring to track leaf area dynamics in Cinchona populations, aiding in the identification of stress indicators and informing reforestation strategies [5]. The model’s simplicity allows its use by local communities and non-specialist technicians, promoting participatory conservation efforts. Regular calibration of the model with data from different seasons and regions is advised to ensure accuracy in diverse ecological contexts [44].
Finally, the relevance of having accurate tools for non-destructive estimation of leaf area is amplified under climate change scenarios, where phenological and physiological monitoring of key species such as C. micrantha and C. pubescens allows detecting responses to abiotic stress [18]. Integrating models such as L × W in monitoring programs would contribute significantly to adaptive conservation strategies, ecological restoration, and sustainable management in the tropical Andes, where these species fulfill fundamental ecological and cultural functions.
The present study demonstrates that nondestructive estimation of leaf area in Cinchona micrantha and Cinchona pubescens can be achieved with high accuracy using linear regression models based on simple measurements of leaf length and width. In particular, the model using the product L × W is positioned as the best alternative because of its high coefficient of determination (R² > 0.97) and prediction error with root mean square error (RMSE) values of 171.263 for C. micrantha and 442.026 for C. pubescens, indicating reliable performance across both species. Low error (competitive RMSE) and ease of field implementation. Although models using quadratic transformations ((L + W)²) offer comparable results in terms of accuracy, the simplicity of the L × W model makes it a preferred tool for operational applications.
This methodology is particularly valuable in the context of climate change research, where non-destructive leaf area estimation enables continuous monitoring of phenological and physiological responses to environmental stressors such as drought, temperature fluctuations, and altered precipitation patterns. By providing a low-cost and replicable tool, the L × W model supports the assessment of Cinchona species’ adaptive capacity to climate-induced changes, contributing to early warning systems and conservation strategies in tropical Andean ecosystems. Furthermore, this methodology is especially relevant for tropical Andean ecosystems where Cinchona plays a significant ecological and cultural role, and where monitoring should be non-invasive, inexpensive and replicable. Its adoption is recommended in studies of forest dynamics, ecological restoration and evaluation of physiological responses to abiotic stress. In the context of climate change, these non-destructive tools constitute a valuable contribution to the adaptive management of native species of high strategic value. The model’s integration into climate change research can enhance the understanding of how these threatened species respond to shifting environmental conditions, supporting adaptive management and policy development for biodiversity conservation.
The authors thank the Instituto Nacional de Innovación Agraria (INIA) through the Investment Project with CUI N° 2472675 entitled: Improvement of Research Services and Transfer of Agricultural Technology at the Baños del Inca Agricultural Experimental Station, Baños del Inca, located in the district of Baños del Inca, province of Cajamarca, department of Cajamarca.
[1] Jonckheere, I., Fleck, S., Nackaerts, K., Muys, B., Coppin, P., Weiss, M., Baret, F. (2004). Review of methods for in situ leaf area index determination: Part I. Theories, sensors and hemispherical photography. Agricultural and Forest Meteorology, 121(1): 19-35. https://doi.org/10.1016/j.agrformet.2003.08.027
[2] Pérez-Harguindeguy, N., Díaz, S., Garnier, E., Lavorel, S., et al. (2013). New handbook for standardised measurement of plant functional traits worldwide, Revista Australiana de Botánica
[3] Myers, N., Mittermeier, R.A., Mittermeier, C.G., da Fonseca, G.A.B., Kent, J. (2000). Biodiversity hotspots for conservation priorities. Nature, 403(6772): 853-858. https://doi.org/10.1038/35002501
[4] Buytaert, W., Cuesta-Camacho, F., Tobón, C. (2011). Potential impacts of climate change on the environmental services of humid tropical alpine regions. Global Ecology and Biogeography, 20(1): 19-33. https://doi.org/10.1111/j.1466-8238.2010.00585.x
[5] Albán-Castillo, J., Chilquillo, E., Melchor-Castro, B., Arakaki, M., León, B., Suni, M. (2020). Cinchona L. ‘Árbol de la Quina’: Repoblamiento y reforestación en el Perú. Revista Peruana de Biología, 27(3): 423-426. https://doi.org/10.15381/rpb.v27i3.18697
[6] Huaccha-Castillo, A.E., Fernandez-Zarate, F.H., Pérez-Delgado, L.J., Tantalean-Osores, K.S., Vaca-Marquina, S.P., Sanchez-Santillan, T., Morales-Rojas, E., Seminario-Cunya, A., Quiñones-Huatangari, L. (2023). Non-destructive estimation of leaf area and leaf weight of Cinchona officinalis L. (Rubiaceae) based on linear models. Forest Science and Technology, 19(1): 59-67. https://doi.org/10.1080/21580103.2023.2170473
[7] Willcox, M., Bodeker, G., Rasoanaivo, P., Addae-Kyereme, J. (2004). Traditional Medicinal Plants and Malaria. CRC Press, Boca Raton. https://doi.org/10.1201/9780203502327
[8] Andersson, L. (1997). A Revision of the Genus Cinchona (Rubiaceae-Cinchoneae). New York Botanical Garden, Bronx, N.Y., U.S.A.
[9] Granier, C., Massonnet, C., Turc, O., Muller, B., Chenu, K., Tardieu, F. (2002). Individual leaf development in Arabidopsis thaliana: A stable thermal‐time‐based programme. Annals of Botany, 89(5): 595-604. https://doi.org/10.1093/aob/mcf085
[10] Cristofori, V., Rouphael, Y., Gyves, E.M., Bignami, C. (2007). A simple model for estimating leaf area of hazelnut from linear measurements. Scientia Horticulturae, 113(2): 221-225. https://doi.org/10.1016/j.scienta.2007.02.006
[11] Fallovo, C., Cristofori, V., de-Gyves, E.M., Rivera, C.M., Rea, R., Fanasca, S., Bignami, C., Sassine, Y., Rouphael, Y. (2008). Leaf area estimation model for small fruits from linear measurements. HortScience, 43(7): 2263-2267. https://doi.org/10.21273/HORTSCI.43.7.2263
[12] Suárez, J.C., Melgarejo, L.M., Durán, E.H., Di Rienzo, J.A., Casanoves, F. (2018). Non-destructive estimation of the leaf weight and leaf area in cacao (Theobroma cacao L.). Scientia Horticulturae, 229: 19-24. https://doi.org/10.1016/j.scienta.2017.10.034
[13] Pompelli, M.F., Antunes, W.C., Ferreira, D.T.R.G., Cavalcante, P.G.S., Wanderley-Filho, H.C.L., Endres, L. (2012). Allometric models for non-destructive leaf area estimation of Jatropha curcas. Biomass and Bioenergy, 36: 77-85. https://doi.org/10.1016/j.biombioe.2011.10.010
[14] Weraduwage, S.M., Chen, J., Anozie, F.C., Morales, A., Weise, S.E., Sharkey, T.D. (2015). The relationship between leaf area growth and biomass accumulation in Arabidopsis thaliana. Frontiers in Plant Science, 6. https://doi.org/10.3389/fpls.2015.00167
[15] Tondjo, K., Brancheriau, L., Sabatier, S.A., Kokutse, A.D., Akossou, A., Kokou, K., Fourcaud, T. (2015). Non-destructive measurement of leaf area and dry biomass in Tectona grandis. Trees, 29(5): 1625-1631. https://doi.org/10.1007/s00468-015-1227-y
[16] Kishor Kumar, M., Senthil Kumar, R., Sankar, V., Sakthivel, T., Karunakaran, G., Tripathi, P. (2017). Non-destructive estimation of leaf area of durian (Durio zibethinus) – An artificial neural network approach. Scientia Horticulturae, 219: 319-325. https://doi.org/10.1016/j.scienta.2017.03.028
[17] Liu, Z., Zhu, Y., Li, F., Jin, G. (2017). Non-destructively predicting leaf area, leaf mass and specific leaf area based on a linear mixed-effect model for broadleaf species. Ecological Indicators, 78: 340-350. https://doi.org/10.1016/j.ecolind.2017.03.025
[18] Poorter, H., Niinemets, Ü., Poorter, L., Wright, I.J., Villar, R. (2009). Causes and consequences of variation in leaf mass per area (LMA): A meta-analysis. New Phytologist, 182(3): 565-588. https://doi.org/10.1111/j.1469-8137.2009.02830.x
[19] Kumar, R. (2009). Calibration and validation of regression model for non-destructive leaf area estimation of saffron (Crocus sativus L.). Scientia Horticulturae, 122(1): 142-145. https://doi.org/10.1016/j.scienta.2009.03.019
[20] Zhang, J., Tong, X., Zhang, J., Meng, P., Li, J., Liu, P. (2021). Dynamics of phenology and its response to climatic variables in a warm-temperate mixed plantation. Forest Ecology and Management, 483: 118785. https://doi.org/10.1016/j.foreco.2020.118785
[21] Antunes, W.C., Pompelli, M.F., Carretero, D.M., DaMatta, F.M. (2008). Allometric models for non-destructive leaf area estimation in coffee (Coffea arabica and Coffea canephora). Annals of Applied Biology, 153(1): 33-40. https://doi.org/10.1111/j.1744-7348.2008.00235.x
[22] Budiarto, R., Poerwanto, R., Santosa, E., Efendi, D., Agusta, A. (2022). Comparative and correlation analysis of young and Mature Kaffir Lime (Citrus Hystrix DC) leaf characteristics. International Journal of Plant Biology, 13(3): 270-280. https://doi.org/10.3390/ijpb13030023
[23] Meng, F., Zhang, G., Li, X., Niklas, K.J., Sun, S. (2015). Growth synchrony between leaves and stems during twig development differs among plant functional types of subtropical rainforest woody species. Tree Physiology, 35(6): 621-631. https://doi.org/10.1093/treephys/tpv021
[24] Wang, Y., Jin, G., Shi, B., Liu, Z. (2019). Empirical models for measuring the leaf area and leaf mass across growing periods in broadleaf species with two life histories. Ecological Indicators, 102: 289-301. https://doi.org/10.1016/j.ecolind.2019.02.041
[25] Easlon, H.M., Bloom, A.J. (2014). Easy leaf area: Automated digital image analysis for rapid and accurate measurement of leaf area1. Applications in Plant Sciences, 2(7): 1400033. https://doi.org/10.3732/apps.1400033
[26] Qu, Y., Wang, Z., Shang, J., Liu, J., Zou, J. (2021). Estimation of leaf area index using inclined smartphone camera. Computers and Electronics in Agriculture, 191: 106514. https://doi.org/10.1016/j.compag.2021.106514
[27] Niinemets, U., Valladares, F. (2004). Photosynthetic acclimation to simultaneous and interacting environmental stresses along natural light gradients: optimality and constraints. Plant Biology (Stuttgart, Germany), 6(3): 254-268. https://doi.org/10.1055/s-2004-817881
[28] Clark, D.A., Clark, D.B. (1992). Life history diversity of canopy and emergent trees in a neotropical rain forest. Ecological Monographs, 62(3): 315-344. https://doi.org/10.2307/2937114
[29] Baker, B., Olszyk, D.M., Tingey, D. (1996). Digital Image analysis to estimate leaf area. Journal of Plant Physiology, 148(5): 530-535. https://doi.org/10.1016/S0176-1617(96)80072-1
[30] Keramatlou, I., Sharifani, M., Sabouri, H., Alizadeh, M., Kamkar, B. (2015). A simple linear model for leaf area estimation in Persian walnut (Juglans regia L.). Scientia Horticulturae, 184: 36-39. https://doi.org/10.1016/j.scienta.2014.12.017
[31] Burnham, K.P., Anderson, D.R. (2013). Model Selection and Inference: A Practical Information-Theoretic Approach. Springer Science & Business Media.
[32] Ma, L., Gardner, F.P., Selamat, A. (1992). Estimation of leaf area from leaf and total mass measurements in peanut. Crop Science, 32(2): cropsci1992.0011183X003200020036x. https://doi.org/10.2135/cropsci1992.0011183X003200020036x
[33] Serdar, Ü., Demirsoy, H. (2006). Non-destructive leaf area estimation in chestnut. Scientia Horticulturae, 108(2): 227-230. https://doi.org/10.1016/j.scienta.2006.01.025
[34] Bakhshandeh, E., Kamkar, B., Tsialtas, J.T. (2011). Application of linear models for estimation of leaf area in soybean [Glycine max (L.) Merr], Photosynthetica, 49(3): 405. https://doi.org/10.1007/s11099-011-0048-5
[35] Fascella, G., Darwich, S., Rouphael, Y. (2013). Validation of a leaf area prediction model proposed for rose. Chilean Journal of Agricultural Research, 73(1): 73-76. https://doi.org/10.4067/S0718-58392013000100011
[36] Oliveira, R.L.L., Moreira, A.R., Costa, A.V.A., Souza, L.C., Lima, L.G.S., Silva, R.T.L. (2015). Modelos de Determinação Não Destrutiva de Área Foliar de Feijão Caupi Vigna unguiculata (L.). Global Science and Technology, 8(2): 17-27. https://doi.org/10.14688/1984-3801/gst.v8n2p17-27
[37] Montelatto, M.B., Villamagua-Vergara, G.C., Castanho, F.P., Kawakami, B., Zerbinato, B., Silva, M.A., Guerra, S.P.S. (2020). Models for leaf area estimation of three forest species in a short coppice rotation. Acta Ecologica Sinica, 40(4): 263-267. https://doi.org/10.1016/j.chnaes.2020.04.003
[38] Tsialtas, J.T., Koundouras, S., Zioziou, E. (2008). Leaf area estimation by simple measurements and evaluation of leaf area prediction models in Cabernet-Sauvignon grapevine leaves. Photosynthetica, 46(3): 452-456. https://doi.org/10.1007/s11099-008-0077-x
[39] Reich, P.B., Uhl, C., Walters, M.B., Ellsworth, D.S. (1991). Leaf lifespan as a determinant of leaf structure and function among 23 Amazonian tree species. Oecologia, 86(1): 16-24. https://doi.org/10.1007/BF00317383
[40] Poorter, L., Rozendaal, D.M.A. (2008). Leaf size and leaf display of thirty-eight tropical tree species. Oecologia, 158(1): 35-46. https://doi.org/10.1007/s00442-008-1131-x
[41] Chaves, M.M., Maroco, J.P., Pereira, J.S. (2003). Understanding plant responses to drought - from genes to the whole plant. Functional Plant Biology: FPB, 30(3): 239-264. https://doi.org/10.1071/FP02076
[42] Valladares, F., Sánchez-Gómez, D. (2006). Ecophysiological traits associated with drought in Mediterranean tree seedlings: Individual responses versus interspecific trends in eleven species. Plant Biology (Stuttgart, Germany), 8(5): 688-697. https://doi.org/10.1055/s-2006-924107
[43] Chazdon, R.L., Broadbent, E.N., Rozendaal, D.M.A., Bongers, F., et al. (2016). Carbon sequestration potential of second-growth forest regeneration in the Latin American tropics. Science Advances, 2(5): e1501639. https://doi.org/10.1126/sciadv.1501639
[44] Finegan, B., Peña-Claros, M., de Oliveira, A., Ascarrunz, N., et al. (2015). Does functional trait diversity predict above-ground biomass and productivity of tropical forests? Testing three alternative hypotheses. Journal of Ecology, 103(1): 191-201. https://doi.org/10.1111/1365-2745.12346