Ali Ghazi Abdul Ali Al-Maliki*![]() | Ali Mohsen Jaafar
| Ali Mohsen Jaafar![]() | Amjad Al-Musaed
| Amjad Al-Musaed![]()
© 2025 The authors. This article is published by IIETA and is licensed under the CC BY 4.0 license (http://creativecommons.org/licenses/by/4.0/).
OPEN ACCESS
This research examines how human behavior, particularly negative student behavior such as vandalism, dismantling, and scratching, affects the aesthetic performance of finishing materials in school buildings, which is contrary to the purpose of education and teaching. It aims to help architects select materials that can better withstand such behaviors, ensuring the durability of buildings by maintaining their boundaries with the surrounding environment. Performance evaluation plays a key role in determining the suitability of finishing materials under these conditions. The research problem is the "lack of a local study addressing the impact of negative behavior on the aesthetic performance of finishing materials in school buildings." The research objective is to develop a theoretical framework to measure this impact and assess the compatibility of these materials with student behavior. The study begins by introducing the concepts of behavior and performance, followed by a review of relevant literature to construct a theoretical framework with primary and secondary concepts. Two local primary school projects were analyzed using specific analytical and measurement methods. A combination of descriptive, analytical, and experimental approaches was adopted, during which samples of finishing materials—such as granite, mosaic, paint, and ceramic—were tested. These analyses led to key findings and recommendations. The research encountered several constraints, including administrative restrictions related to school regulations, technical difficulties in installing cameras and collecting material samples, and social limitations. Notably, some female staff members were reluctant to be monitored by cameras due to cultural privacy norms prevalent in Iraqi society. The study concluded with several findings, the most significant being that finishing coating materials exhibited significantly weaker aesthetic performance against negative behaviors compared to materials like ceramic and granite. Walls were identified as the most affected surfaces, followed by floors, as both are easily accessible and often neglected due to their lower aesthetic quality. In contrast, ceilings showed no significant impact as students cannot reach them. Negative behaviors were most common in vertical circulation areas due to crowding. Accordingly, the research reached several recommendations, the most important of which are: improving the quality of finishing materials, particularly for walls and floors, to increase their resistance to negative behavior. It also suggests implementing effective strategies for managing recurring behaviors on a regular basis to enhance discipline and reduce undesirable actions over time.
student behavior, performance, finishing materials, school building, aesthetics of finishes
In modern architecture, performance is measured by the achievement of the individual or entity in reaching the desired objectives [1]. It is regarded as the ability to act, which requires attention to detail, skill, and efficiency [2]. Operationally, it is understood as a set of activities and behaviors executed with skill and efficiency [3]. The aesthetic performance of finishing materials is reflected in the retention of appearance and resistance to changes in texture (e.g., smooth or rough), color (e.g., luster or resistance to cleaning), and gloss (e.g., shiny or dull) [4]. Additionally, the expressive properties of color—such as its ability to express a sense of place, reflect cultural environments, serve educational purposes, and enhance aesthetics—are important. Color design also includes visual comfort, surface clarity, color attractiveness, and color space, which involves determining primary, group, and accent colors based on gradation values, brightness, and purity [5]. Aesthetics have been emphasized as a fundamental pillar in building design, with modern industries contributing to the development of various finishing materials. These materials have brought architectural changes and influenced aesthetic and expressive aspects. Human behavior is manifested through observable and measurable actions, such as motor activities, as well as less noticeable actions like thinking. These behaviors are influenced by environmental factors and the individual's surroundings [6]. It is a response to various stimuli or inputs, whether internal or external, conscious or unconscious, overt or covert, voluntary or involuntary [7]. The environment encompasses all external influences that support and shape behavioral mechanisms [8]. The physical environment influences the manifestation of certain types of behavior and helps direct, motivate, or discourage them [9], for example, through restrictions imposed by building designs [10]. In school buildings, negative behaviors such as vandalism may result from various factors, including physical environmental problems like noise [11]. In other words, the school’s physical environment can either encourage positive student behavior or tolerate negative behavior. This phenomenon is related to what is known as the "school mood" that is, the building may be dilapidated and the materials old, so the student neglects school and bad behavior spreads [12]. Examples of such behavioral manifestations include acts of vandalism and graffiti committed by student groups in schools [13]. Behavior is a complex activity structured around three fundamental aspects [14]:
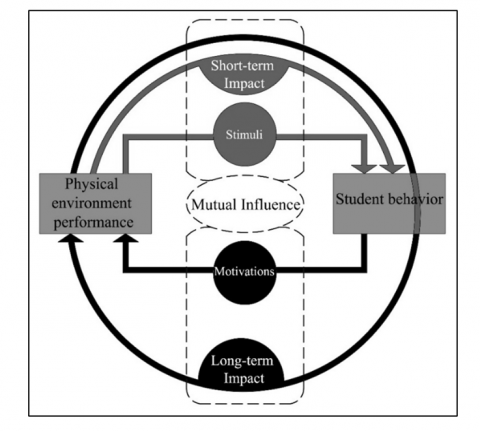
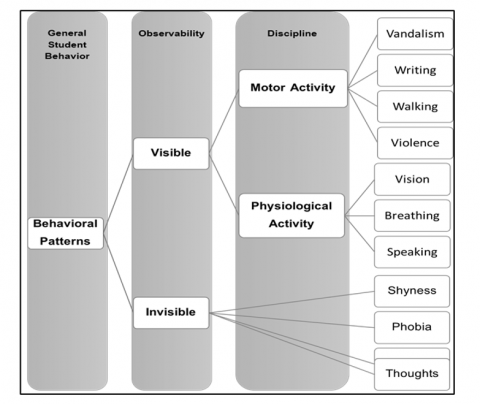
Behavior can be categorized as either visible, such as motor actions and physiological activities like breathing, or invisible, like cognitive processes such as thinking and remembering. These activities may be voluntary or involuntary and arise in response to stimuli from individuals, the environment, or systems, creating interaction. Understanding behavior generation requires analyzing these responses and interactions (Figure 1).
Cognitive processes generate actions or activities, which are accompanied by emotions that vary depending on the stimuli and the specific activity. Behavior is structured as a closed loop with three interconnected components: perception, activity, and emotions. Each component influences the others, forming an integrated system (Figure 2).
2.1 Directional influence between behavior and physical environment
The physical environment of the school building affects behavior. If the design of the internal environment is not suitable for the level of overcrowding, it results in negative impacts on student learning and behavior. This is due to the insufficient space in the building or classrooms to accommodate the number of students [15]. Students are affected by the size of the classrooms in terms of academic performance, disciplinary issues, and classroom management [16]. The acoustic performance of the school building affects student behavior due to factors such as the length and layout of corridors and excessive noise levels at peak times [15]. Additionally, maintenance factors can influence student behavior and performance in terms of meeting safety standards, cleanliness, leaking surfaces, broken windows, absence of restrooms, and lighting [17]. The school is an environment where members interact with one another, and all are affected by the surrounding environment. The human and physical elements are in constant interaction, with each influencing the other. Students are affected by the school as a physical element, including its spaces and facilities, while the school building itself can be influenced by management style, maintenance practices, and how well students take care of it [18]. Among the impacts of behavior on the physical environment are deliberate arson and window-breaking as acts of vandalism [19]. The Trait Model and the Psychodynamic Model suggest that actual behavior is primarily determined by underlying and stable traits, both of which assume that the sources of initiating and directing behavior come primarily from within the individual. In contrast, the Situational Model posits that the sources of behavior initiation and direction come mainly from external factors. The Interactional Model assumes that the sources of behavior initiation and direction arise primarily from ongoing interactions between the individual and the situations they encounter [20]. The roots of the interaction between the individual and the environment trace back to the work of Lewin [21, 22] and Murray [23], in their famous formula, B = f (p, e), states that behavior is a function of both the person and the environment, where B represents behavior, P represents the person, and E represents the environment. Behavior is not only considered a function of both the person and the environment, but the environment most influential in its behavioral consequences is viewed as inherently subjective, referred to as the perceived environment, also known as the phenomenological field or psychological state. Murray [23] described behavior as a joint outcome of both an individual's needs (person variable) and the environmental pressure or potential to satisfy those needs (situational variable). The interaction between behavior and the environment is probabilistic and reciprocal, encompassing both determinism and probabilism. Determinism posits that the environment shapes human behavior, with the individual as a passive responder and minimal opportunity to alter their surroundings. In contrast, probabilism views the person as acting within an environment that offers opportunities for understanding and perceives it as providing not only possibilities but also more choices and enhancing them [24]. The relationship between the individual and the environment is dynamic rather than static, meaning that the influences are mutual and continuously interacting [23].
It is evident from the above that the relationship between student behavior and the surrounding environment is interactive and reciprocal. This relationship can be either deterministic or probabilistic, with bidirectional influence between the environment and behavior. One direction is short-term, originating from the environment towards behavior, by creating stimuli that lead to behavior. The other direction is long-term, originating from the behavior of the individual towards the physical environment, which results from psychological, economic, and other motivations (Figure 3). For the specificity of this research, the focus will be on the second type within the scope of the study.
2.2 Behavior in the field of education
Children in schools face a variety of issues related to their activities, which can be either observable or non-observable. Observable activities include physiological and motor activities, while non-observable activities encompass thinking, creativity, and memory, among others. Behavioral problems are among the most prominent issues that children experience, whether in preschool, elementary school, or middle school settings [25]. In the context of education, students need to have role models in their teachers to see what is expected of them in terms of ideal behavior. Some behaviors are categorized as negative or problematic school behaviors, which need to be addressed and corrected comprehensively [26]. When discussing behavior within the school, it is referred to as classroom behavior, which encompasses all activities and actions exhibited by learners within the classroom or the school environment. This behavior is generally divided into two categories [27]:
Behaviors are categorized into several patterns, with verbal behavior being the most common among students, followed by motor behavior, and finally, aggressive or destructive behavior [28]. Some examples of negative school behaviors include not listening or paying attention, daydreaming, and focusing on external noises and distractions. These behaviors can be attributed to various causes, such as attention deficit hyperactivity disorder (ADHD), and are often influenced by factors like noise, external movement, or other distractions [29]. Therefore, monitoring negative behaviors in students through what is known as Functional Behavior Assessment (FBA) is essential. FBA aims to identify where, when, and why certain behaviors occur. The process of conducting a Functional Behavior Assessment involves the following steps [11]:
From the above discussion, the behaviors addressed in this research fall under the category of human behaviors, specifically focusing on students' school behaviors. We can draw the following conclusions:
Figure 4. Types of school behaviors by pattern, observability, and discipline
Source: Researchers.
2.3 Relationship between student behavior and the school building
School buildings are considered the place where school students spend most of their time [30] and are an important and primary factor in achieving the success of educational goals. The school represents the environment around which the educational process revolves, and the appearance of the school and what it requires in terms of beauty and decoration is an important element in the modern school [31]. The concept of the school building is defined as the container within which all elements of the educational and teaching process interact [18]. The school building also represents the place planned, designed and equipped with typical specifications by educational planners and specialized engineers to achieve the goals and requirements of education that target the cognitive development of the student and his social upbringing, and facilitating the student's interaction with the social and environmental environment in a comfortable and attractive atmosphere [18], as the appropriate school building environment helps in the comprehensive and balanced growth of the student from the (mental, social and psychological) perspective. School buildings are classified as follows [32]:
As for the components of school buildings, they consist of the following:
There is a relationship between the behavior of occupants in school buildings and the quality of the school buildings. The buildings have a significant impact on students' attitudes and shape their behaviors. Additionally, the behavior of teachers plays a crucial role in students' behavior, whether it is current or future [33]. The causes of student misbehavior are varied, as the school environment, with its specific characteristics, may contribute to reinforcing students' acceptance of negative behaviors. A school that struggles with student misbehavior may sometimes be influenced by external factors, as our environment has a significant impact on our behavior. For instance, an old and dilapidated school can negatively affect student behavior. Student behavior also depends on the "school mood", which refers to the prevailing culture and the way students perceive the school, their behavior, and their work within it. When the overall school climate becomes negative, the culture of misbehavior can permeate among the students [34]. Another reason for misconduct is a lack of sense of belonging to the school, a monotonous school environment, or feelings of animosity towards the school. Therefore, several measures should be implemented towards the school, including: conducting Yearly inspections of the school buildings, performing urgent maintenance on both the internal and external school facilities to ensure they meet safety and occupational health requirements, and protecting school buildings from the effects of weather conditions [35]. The study [13] showed that behaviors such as tampering with things, tearing them up and breaking them come from curiosity and love of religions, not from pure vandalism, and when the child is not mature, he grabs and pulls things and through them he enjoys causing harm to them because of his ignorance of how to deal with you, and the young child may tamper with things out of ignorance of their value, and there is no destructive behavior such as the innocent pushing destructive behavior when the student is not the one who values things and the organized curious vandalism in which children fall in an attempt to return the elements to their original composition and unconscious vandalism such as temporary touching, which destroys between the reach and falls unintentionally, as well as blowing up the element and destroying it, as well as the deliberate approach that occurs within a group that causes harm, destruction and breaking on the walls in the school, this type of vandalism, although it is deliberate, does not intend to harm for the sake of harm, and for this reason these destructive behaviors are often love. And curiosity and hyperactivity of the child [13]. The study [36] also showed the relationship between the behavior of children and the surrounding school environment, as the physical school environment must work to adapt and adjust to the child, as children in primary schools suffer from many behavioral problems, including; riots, chaotic behavior, aggression, violence, destruction of materials and graffiti behavior, etc., which led to a deterioration in the performance of the finishing materials [36]. The study [37] indicates that there is a relationship between students’ destructive behavior and the physical elements of the school that surround them, such as vandalism during play, damage to finishing materials, and graffiti, which usually occurs in unprotected or unsupervised areas, i.e. in places where the student feels safe. The reason for the emergence of these behaviors is the cleanliness of the school, its maintenance, and the safety of the surfaces [37]. Here we find a difference between the behavior of students defined by a young age group and how they deal with the building in a limited way due to their young age and lack of awareness of the behavior of occupants of buildings other than the school, which translates, for example, into how to control the building’s energy system to adapt to the internal environment, which greatly increases energy consumption in the building. The behavior of building occupants is represented by opening and closing the window and adaptive procedures [38]. There are also physical, physiological and psychological differences between occupants of the general building and the student using the school building. Users do not receive, recognize and behave in the same way, but they can adapt buildings to their thermal comfort and improve the quality of indoor air (bringing fresh air and eliminating air pollution and odor), sound (avoiding unwanted noise and vibrations), visual (by controlling lighting (brightness ratios), reflections and glare) and thermal conditions (controlling the temperature of the indoor air [39], factors contributing to the vandalism of school property include the following [40]:
Thus, the following conclusions can be inferred:
2.4 Aesthetic performance of finishing materials
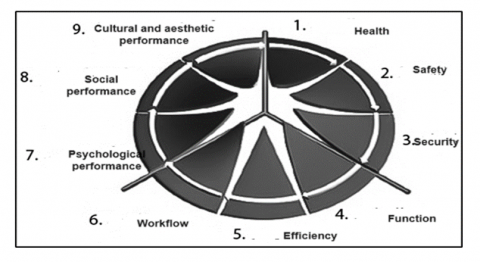
In architecture, three categories of building performance criteria were defined centuries ago by the Roman architect Vitruvius: Strength, Utility, and Beauty. This historical approach has been utilized to prioritize building performance into three main levels, as illustrated in Figure 7 [41].
Waggener [4] defines the aesthetic performance of finishing materials in terms of maintaining a well-preserved appearance and resistance to changes in texture (smooth, rough), color (color brightness, cleaning resistance), and gloss (shiny, dull). The aesthetic performance of finishing materials involves aspects such as color, texture, shape, and pattern, according to the designer's preferences [42, 43]. Huang [5] describes the aesthetic or expressive performance as encompassing color characteristics that reflect the place and cultural environment, educational support, user comfort, environmental aesthetics, and color design aspects like visual comfort, surface clarity, and color attractiveness. Additionally, aesthetic performance includes user comfort, ensuring that the color is pleasing, comfortable to the eye, and visually appealing.
2.4.1 Aesthetic performance criteria
Performance criteria specify what should be measured and why, defining success in terms of operational effectiveness and the desired outcomes. The process of selecting these criteria involves identifying the relevant dimensions and/or variables crucial for the successful operation of an organization [44]. These criteria reflect the attributes and characteristics related to assessing the achievement of specific performance levels within the scope under review. The classification of performance criteria aligns with the philosophy of categorizing performance into its primary factors. These criteria are attributed to the components of performance [45], which may be technical, functional, aesthetic, or economic standards, through which performance can be evaluated, as aesthetic performance standards are linked to the effect of material properties on the physiological and psychological aspects for human visual stimulation [5], and aesthetic standards include the following:
2.4.2 Evaluation of aesthetic performance
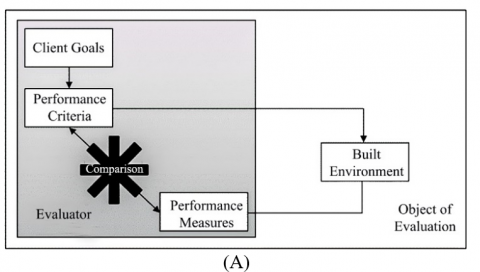
Evaluating performance is a systematic comparison of the actual performance of buildings, linking client goals with performance criteria set by professionals to measure satisfaction and performance of the built environment. This process aims to enhance the quality of management, design, and construction [47], as illustrated in Figure 8(A) [48].
Figure 8. (A). Performance evaluation process, (B). Performance evaluation process model
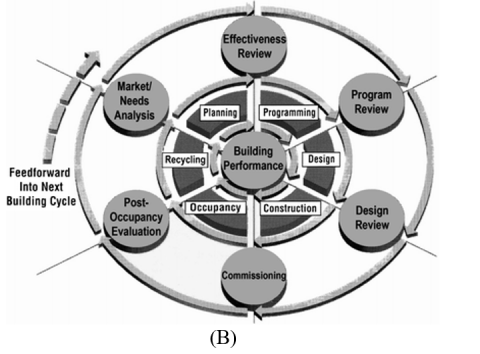
Evaluating building performance also provides essential information about user needs, preferences, and satisfaction [49]. It offers insights into the causes and effects of environmental issues related to the building, thereby informing long-term planning and product lifecycle management [50]. To achieve this, Building Performance Evaluation (BPE) acts as a valuable tool, assisting decision-making at both strategic and operational levels throughout the various elements of the building [51]. Evaluating performance is essential for making necessary changes to improve future design [52]. Preiser and Schramm proposed that performance evaluation should be considered throughout the entire building lifecycle. They developed a lifecycle model comprising six stages: strategic planning, programming, design, construction, occupancy, and finally, adaptive reuse/recycling (Figure 8(B)) [53].
Each stage in this lifecycle is an indispensable component of the building's overall process and should be considered in a circular sequence (Figure 3). To achieve a comprehensive understanding, the evaluation process is expanded to aim for continuous improvement in the quality of built elements [53].
Aesthetic Performance Evaluation includes the following aspects:
2.5 Research methodology
In this section, the research steps on which the study was designed will be explained. These steps guide the research towards the selection and analysis of samples and the practical application to obtain the key findings and recommendations, as follows:
Table 1. The main and secondary vocabulary and indicators of the theoretical framework
|
Main Vocabulary |
Secondary Vocabulary |
Indicators |
||
|
Behavioral Effect (X1) |
Aesthetic Performance Degradation (X1.1) |
Material Attractiveness (X1.1.1) |
Material Texture (X1.1.1.1) |
|
|
Surface Cleanliness (X1.1.1.2) |
||||
|
Surface Gloss (X1.1.1.3) |
||||
|
Material Color |
Color Area (X1.1.2.1) |
Main Color (X1.1.2.1.1) |
||
|
Assembly Color (X1.1.2.1.2) |
||||
|
Punctuated Color (X1.1.2.1.3) |
||||
|
Color Properties (X1.1.2.2) |
Color Brightness (X1.1.2.2.1) |
|||
|
Type of Behavior (X2) |
Negative Environmental (X2.1) |
Innocent Vandalism (X2.1.1) |
During Play (X2.1.1.1) |
|
|
Systematic Curiosity (X2.1.2) |
Dismantling of Fixtures (X2.1.2.1) |
|||
|
Unconscious (X2.1.3) |
Intense Friction (X2.1.3.1) |
|||
|
Frequent Touching (X2.1.3.2) |
||||
|
Deliberate |
Destruction of Fixtures (X2.1.4.1) |
|||
|
Surface Writing (X2.1.4.2) |
||||
|
Surface Peeling (X2.1.4.3) |
||||
|
Material Removal (X2.1.4.4) |
||||
|
Surface Soiling (X2.1.4.5) |
||||
|
Behavior Time (X3) |
Daily (X3.1) |
|||
|
Weekly (X3.2) |
||||
|
Monthly (X3.3) |
||||
|
Yearly (X3.4) |
||||
|
Behavior Location (X4) |
Building Components (X4.1) |
Classrooms (X4.1.1) |
||
|
Outdoor Courtyard (X4.1.2) |
||||
|
Sanitary Facilities (X4.1.3) |
||||
|
Indoor Courtyard (X4.1.4) |
||||
|
Vertical Circulation (X4.1.5) |
||||
|
Building Element (X4.2) |
Walls (X4.2.1) |
|||
|
Flooring (X4.2.2) |
||||
|
Ceilings (X4.2.3) |
||||
|
Behavioral Frequency (X5) |
High (X5.1) |
|||
|
Medium (X5.2) |
||||
|
Low (X5.3) |
||||
2.6 Practical application
This section will address two samples of local school buildings, which will later be analyzed according to the selected variables: the impact of behavior, type of behavior, time of behavior occurrence, location of behavior occurrence, and frequency of behavior. The main reason for selecting these two samples is the diversity of finishing materials and the extent of their damage as an aesthetic aspect due to student behaviors.
2.6.1 Al-Shaheed Al-Saeed School
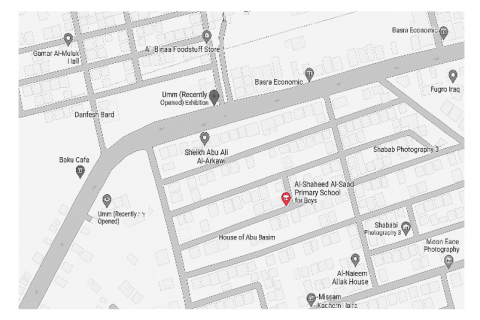
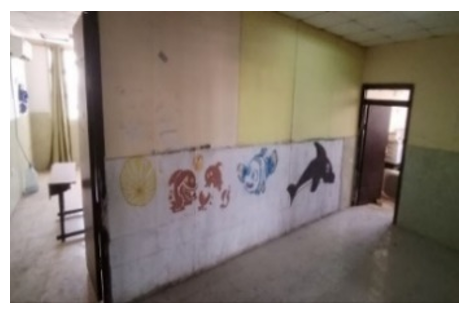
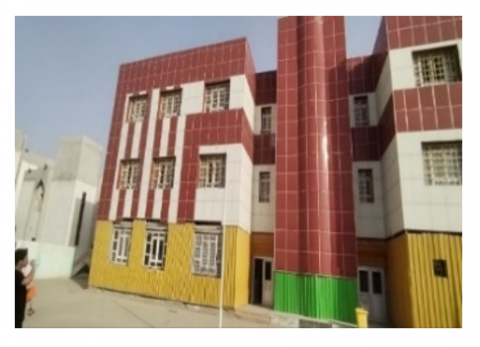
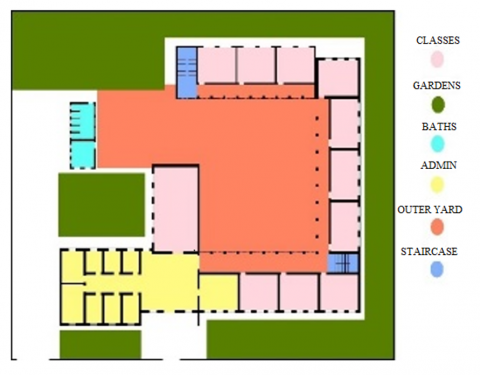
Project Description: The building consists of 12 public halls distributed over three floors, as shown in Figure 9. The building accommodates 332 students and was constructed in 2015 and last renovated in 2017. It is located in Iraq/Basra/Andalus neighborhood, as shown in Figure 10. The location of the school is within the main roads and is adjacent to beautiful houses. The social level of the area is good, as well as the general character of the economic aspect in the area. The finishing materials used in the building are shown in Table 2. Through field inspection, it was found that the aesthetic performance of the finishing materials is in poor condition, as shown in Figures 11-16, and the reason for this is the lack of maintenance compared to the frequency of use.
Figure 9. The layout of Al-Shaheed Al-Saeed School
Figure 10. The location of Al-Shaheed Al-Saeed School, along with its surrounding area
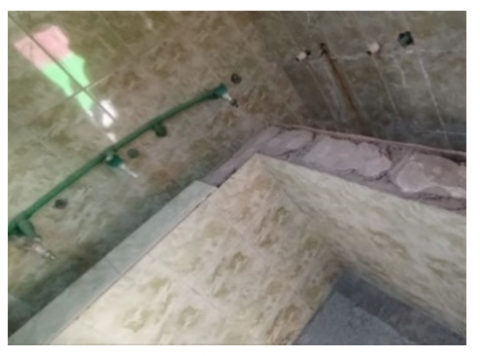
Figure 11. The condition of the finishing materials in the indoor courtyard of Al-Shaheed Al-Saeed School
Figure 12. The condition of the finishing materials in the classrooms of Al-Shaheed Al-Saeed School
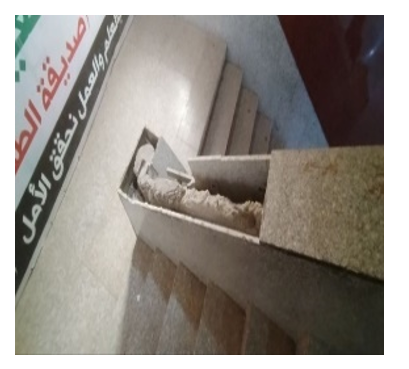
Figure 13. The condition of the finishing materials in the vertical circulation areas of Al-Shaheed Al-Saeed School
Figure 14. The condition of the finishing materials in the external courtyard of Al-Shaheed Al-Saeed School
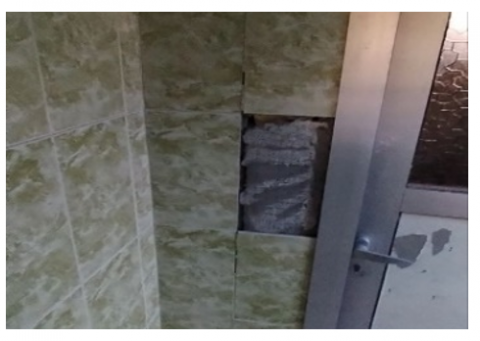
Figure 15. The condition of the finishing materials in the bathrooms of Al-Shaheed Al-Saeed School (1)
Figure 16. The condition of the finishing materials in the bathrooms of Al-Shaheed Al-Saeed School (2)
2.6.2 Al-Shaheed Abdul Hakim Al-Safi School
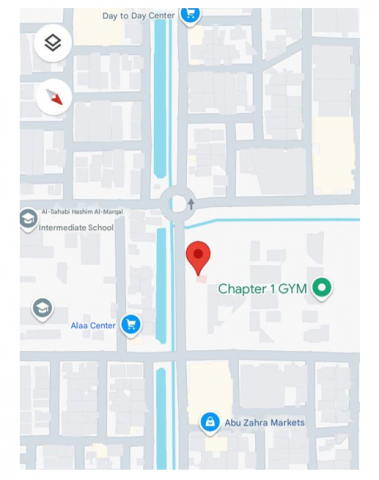
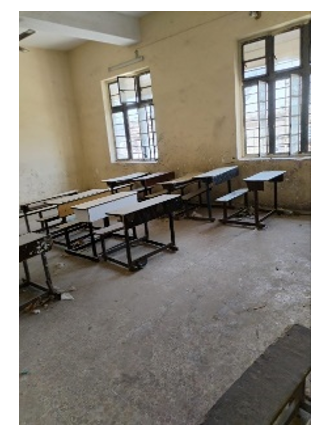
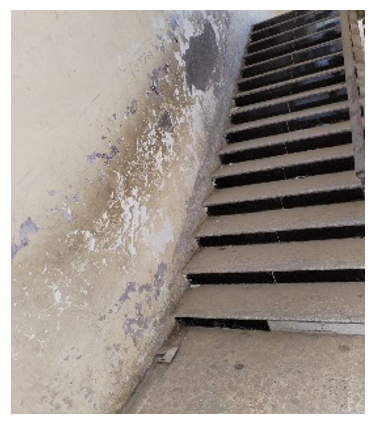
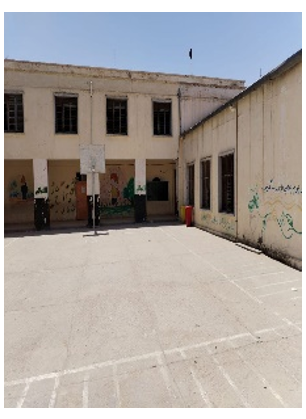
Project Description: The building consists of 22 classrooms distributed over two floors, as shown in Figure 17. The building accommodates 495 male and female students. It was constructed in 1980, and the last renovation was in 2017. It is located in Iraq/Basra/Maqal, as shown in Figure 18. The school is surrounded by some random landscapes and a garbage dump, noting that the area is characterized by a poor standard of living and chaos in the area, which reflects bad social factors. The final materials used in the building are shown in detail in Table 2. The field inspection of the building revealed a significant impact on the final materials, as shown in Figures 19-22, due to the poor quality of the final materials used, which leads to a poor aesthetic condition of the final materials due to the large number of students and lack of maintenance.
Figure 17. The layout of Al-Shaheed Abdul Hakim Al-Safi School
Figure 18. The location of Al-Shaheed Abdul Hakim Al-Safi School, along with its surrounding area
Figure 19. The condition of the finishing materials in the classrooms of Martyr Abdul Hakim Al-Safi School
Figure 20. The condition of the finishing materials in the vertical circulation areas of Al-Shaheed Abdul Hakim Al-Safi School
Figure 21. The condition of the finishing materials in the external courtyard of Al-Shaheed Abdul Hakim Al-Safi School
Figure 22. The condition of the finishing materials in the bathrooms of Al-Shaheed Abdul Hakim Al-Safi School
2.6.3 Finishing material samples
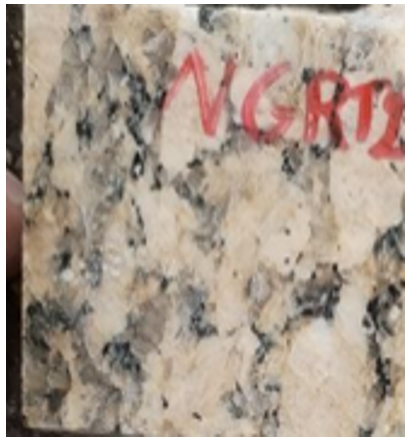
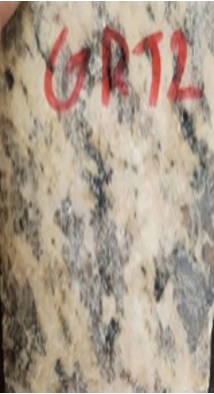
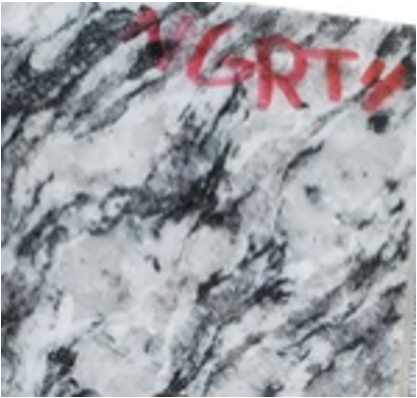
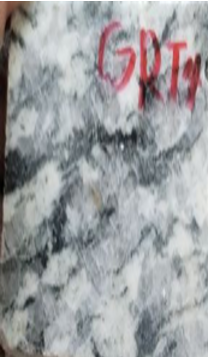
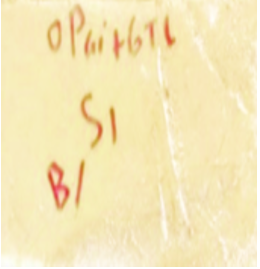
This section will clarify the finishing material samples from the two schools, which were subjected to laboratory testing. This will be presented in Table 2 with images and descriptions for each finishing material. Samples were taken from locations not exposed to student behaviors (NPUS) and from locations exposed to student behaviors (PUS). The results were calculated based on the average difference in values between the two samples for the same material, as follows:
Table 2. The finishing material samples used in the selected samples
|
Al-Shaheed Al-Saeed School |
|||||
|
Samples Exposed to Environmental Conditions Only (NPUS) |
Samples Exposed to Environmental and Human Conditions (PUS) |
||||
|
Sample Code |
Item Description |
Sample Image |
Sample Code |
Item Description |
Sample Image |
|
NGRT2 |
Natural Granite Stone |
GRT2 |
Natural Granite Stone |
||
|
NGRT4 |
Natural Granite Stone |
GRT4 |
Natural Granite Stone |
||
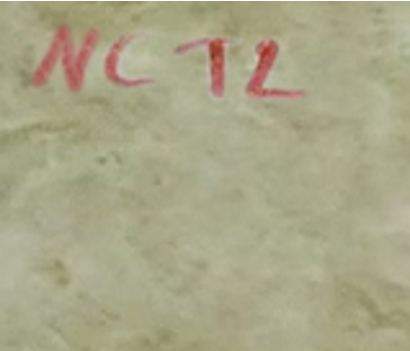
|
NCT2 |
Ceramic |
CT2 |
Ceramic |
||
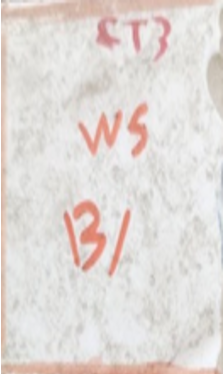
|
NCT3 |
Ceramic |
CT3 |
Ceramic |
||
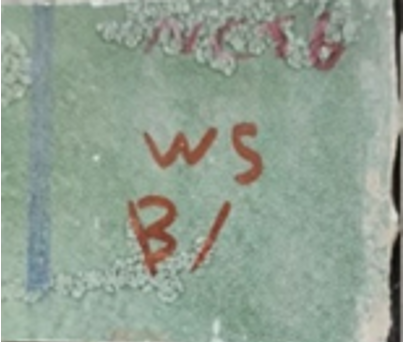
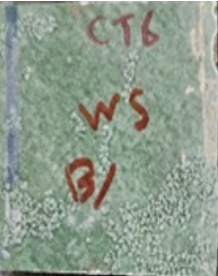
|
NCT6 |
Ceramic |
CT6 |
Ceramic |
||
|
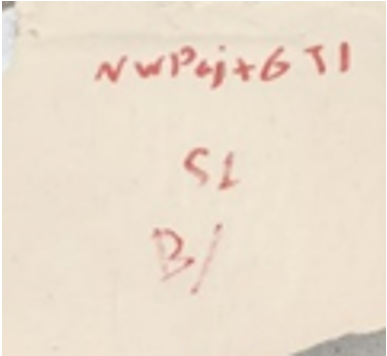
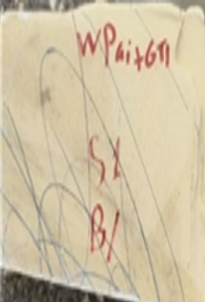
NWPai+GT1 |
Water Paint |
WPai+GT1 |
Water Paint |
||
|
Al-Shaheed Abdul Hakim Al-Safi School |
|||||
|
Samples Exposed to Environmental Conditions Only (NPUS) |
Samples Exposed to Environmental and Human Conditions (PUS) |
||||
|
Sample Code |
Item Description |
Sample Image |
Sample Code |
Item Description |
Sample Image |
|
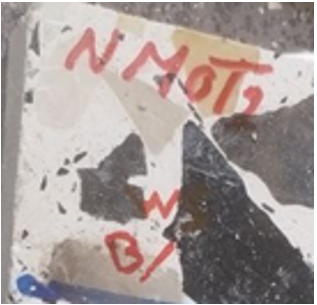
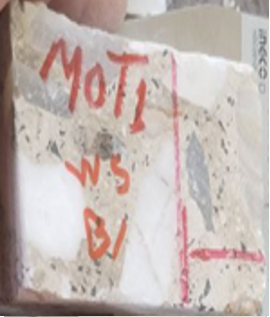
NMOT1 |
Mosaic |
MOT1 |
Mosaic |
||
|
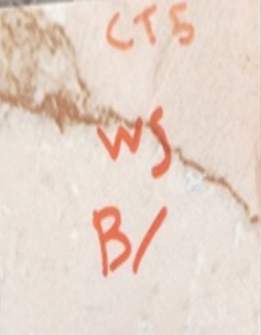
NCT5 |
Ceramic |
CT5 |
Ceramic |
||
|
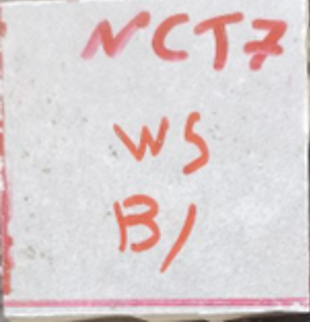
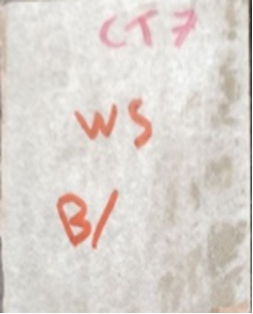
NCT7 |
Ceramic |
NCT7 |
Ceramic |
||
|
NWPai+GT1 |
Water Paint |
WPai+GT1 |
Water Paint |
||
|
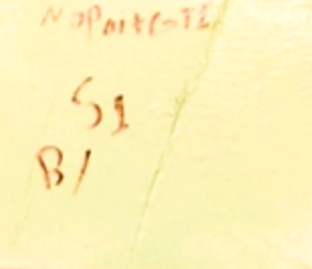
NOPai+GT1 |
Oil Paint |
OPai+GT1 |
Oil Paint |
||
The results of the practical application revealed a variation in the achievement rates of the variables, as indicated by the values of their secondary elements and indicators shown in Table 3.
Table 3. The main and secondary vocabulary and indicators of the theoretical framework
|
Main Vocabulary |
Secondary Vocabulary |
Indicators |
Al-Shaheed Al-Saeed School |
Al-Shaheed Abdul Hakim Al-Safi School |
Ratio Average |
||||||
|
Behavioral Effect (X1) |
14.37% |
Aesthetic Performance Degradation (X1.1) |
14.37% |
Material Attractiveness (X1.1.1) |
29.39% |
Material Texture (X1.1.1.1) |
12.32% |
32.77% |
22.54% |
||
|
Surface Cleanliness (X1.1.1.2) |
20.31% |
50.55% |
35.43% |
||||||||
|
Surface Gloss (X1.1.1.3) |
27.09% |
33.27% |
30.18% |
||||||||
|
Material Color (X1.1.2) |
6.93% |
Color Area (X1.1.2.1) |
7.25% |
Main Color (X1.1.2.1.1) |
14.38% |
22.51% |
18.44% |
||||
|
Assembly Color (X1.1.2.1.2) |
2.94% |
3.67% |
3.31% |
||||||||
|
Punctuated Color (X1.1.2.1.3) |
0.00% |
0.00% |
0.00% |
||||||||
|
Color Properties (X1.1.2.2) |
6.46% |
Color Brightness (X1.1.2.2.1) |
5.25% |
6.71% |
5.98% |
||||||
|
Type of Behavior (X2) |
10.46% |
Negative Environmental (X2.1) |
10.46% |
Innocent Vandalism (X2.1.1) |
13.71% |
During Play (X2.1.1.1) |
25.14% |
2.29% |
13.71% |
||
|
Systematic Curiosity (X2.1.2) |
11.63% |
Dismantling of Fixtures (X2.1.2.1) |
23.26% |
0.00% |
11.63% |
||||||
|
Unconscious (X2.1.3) |
8.44% |
Intense Friction (X2.1.3.1) |
9.22% |
3.22% |
6.22% |
||||||
|
Frequent Touching (X2.1.3.2) |
11.72% |
9.57% |
10.65% |
||||||||
|
Deliberate (X2.1.4) |
8.06% |
Destruction of Fixtures (X2.1.4.1) |
13.43% |
1.34% |
7.38% |
||||||
|
Surface Writing (X2.1.4.2) |
12.80% |
4.80% |
8.80% |
||||||||
|
Surface Peeling (X2.1.4.3) |
3.94% |
22.08% |
13.01% |
||||||||
|
Material Removal (X2.1.4.4) |
0.00% |
0.00% |
0.00% |
||||||||
|
Surface Soiling (X2.1.4.5) |
14.23% |
8.01% |
11.12% |
||||||||
|
Behavior Time |
25.00% |
Daily (X3.1) |
4.11% |
5.26% |
4.68% |
||||||
|
Weekly (X3.2) |
1.47% |
17.54% |
9.51% |
||||||||
|
Monthly (X3.3) |
6.45% |
77.19% |
41.82% |
||||||||
|
Yearly (X3.4) |
87.98% |
0.00% |
43.99% |
||||||||
|
Behavior Location |
24.90% |
Building Components (X4.1) |
14.32% |
Classrooms (X4.1.1) |
4.02% |
5.30% |
4.66% |
||||
|
Outdoor Courtyard (X4.1.2) |
18.11% |
0.85% |
9.48% |
||||||||
|
Sanitary Facilities (X4.1.3) |
10.71% |
2.57% |
6.64% |
||||||||
|
Indoor Courtyard (X4.1.4) |
36.83% |
0.00% |
18.42% |
||||||||
|
Vertical Circulation (X4.1.5) |
58.36% |
6.43% |
32.40% |
||||||||
|
Building Elements (X4.2) |
35.48% |
Walls (X4.2.1) |
64.55% |
65.93% |
65.24% |
||||||
|
Flooring (X4.2.2) |
34.75% |
47.66% |
41.21% |
||||||||
|
Ceilings (X4.2.3) |
0.00% |
0.00% |
0.00% |
||||||||
|
Behavioral Frequency (X5) |
33.33% |
High (X5.1) |
4.11% |
5.26% |
4.68% |
||||||
|
Medium (X5.2) |
7.92% |
94.74% |
51.33% |
||||||||
|
Low (X5.3) |
87.98% |
0.00% |
43.99% |
||||||||
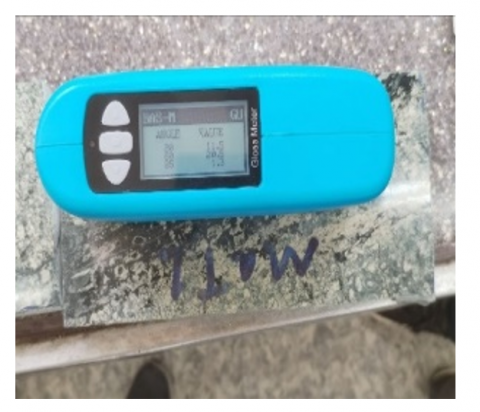
3.1 Surface gloss test
The test was conducted according to the British standard (BS EN ISO 2813:2014) [54] using a Glossmeter Tester, as shown in Figure 23. Gloss values were obtained for the angles (20°, 60°, and 85°) from the device readings, as illustrated in Figure 24. The average values were then calculated, and the results were extracted as shown in Table 4.
Figure 23. The glossmeter tester [55]
Table 4. The results of the examination of the finishing materials in the selected samples
|
Al-Shaheed Al-Saeed School |
|||||||||
|
NPUS |
Angles |
Gloss Values |
Value Ratios |
PUS |
Angles |
Gloss Values |
Value Ratios |
Difference in Value |
Average |
|
NGRT2 |
20 |
32.3 |
52.86% |
GRT2 |
20 |
28.8 |
47.14% |
5.73% |
|
|
60 |
57.1 |
59.36% |
60 |
39.1 |
40.64% |
18.71% |
|||
|
85 |
41.6 |
57.06% |
85 |
31.3 |
42.94% |
14.13% |
12.86% |
||
|
NGRT4 |
20 |
45.9 |
52.88% |
GRT4 |
20 |
40.9 |
47.12% |
5.76% |
|
|
60 |
66.8 |
55.02% |
60 |
54.6 |
44.98% |
10.05% |
|||
|
85 |
39 |
55.01% |
85 |
31.9 |
44.99% |
10.01% |
8.61% |
||
|
NCT2 |
20 |
7 |
100.00% |
CT2 |
20 |
0 |
0.00% |
100.00% |
|
|
60 |
32.5 |
85.98% |
60 |
5.3 |
14.02% |
71.96% |
|||
|
85 |
18.5 |
88.94% |
85 |
2.3 |
11.06% |
77.88% |
83.28% |
||
|
NCT3 |
20 |
0.3 |
50.00% |
CT3 |
20 |
0.3 |
50.00% |
0.00% |
|
|
60 |
5 |
48.54% |
60 |
5.3 |
51.46% |
2.91% |
|||
|
85 |
1.3 |
46.43% |
85 |
1.5 |
53.57% |
7.14% |
3.35% |
||
|
NCT6 |
20 |
3 |
31.91% |
CT6 |
20 |
6.4 |
68.09% |
36.17% |
|
|
60 |
25.8 |
50.19% |
60 |
25.6 |
49.81% |
0.39% |
|||
|
85 |
18 |
69.50% |
85 |
7.9 |
30.50% |
39.00% |
25.19% |
||
|
NWpa.+G.T1 |
20 |
0 |
0.00% |
Wpa.+G.T1 |
20 |
0 |
0.00% |
0.00% |
|
|
60 |
1.9 |
51.35% |
60 |
1.8 |
48.65% |
2.70% |
|||
|
85 |
6.2 |
92.54% |
85 |
0.5 |
7.46% |
85.07% |
29.26% |
||
|
Total Average |
27.09% |
||||||||
|
Al-Shaheed Abdul Hakim Al-Safi School |
|||||||||
|
NPUS |
Angles |
Gloss Values |
Value Ratios |
PUS |
Angles |
Gloss Values |
Value Ratios |
Difference in Value |
Average |
|
NMOT1 |
20 |
0 |
0.00% |
MOT1 |
20 |
0 |
0.00% |
0.00% |
|
|
60 |
5.6 |
77.78% |
60 |
1.6 |
22.22% |
55.56% |
|||
|
85 |
12.1 |
95.28% |
85 |
0.6 |
4.72% |
90.55% |
48.70% |
||
|
NCT5 |
20 |
55.8 |
55.19% |
CT5 |
20 |
45.3 |
44.81% |
10.39% |
|
|
60 |
60.1 |
48.86% |
60 |
62.9 |
51.14% |
2.28% |
|||
|
85 |
27.7 |
43.08% |
85 |
36.6 |
56.92% |
13.84% |
8.83% |
||
|
NCT7 |
20 |
0.3 |
33.33% |
CT7 |
20 |
0.6 |
66.67% |
33.33% |
|
|
60 |
4.1 |
35.96% |
60 |
7.3 |
64.04% |
28.07% |
|||
|
85 |
0.8 |
16.33% |
85 |
4.1 |
83.67% |
67.35% |
42.92% |
||
|
NOpa.+G.T1 |
20 |
1.5 |
23.81% |
Opa.+G.T1 |
20 |
4.8 |
76.19% |
52.38% |
|
|
60 |
10.9 |
27.05% |
60 |
29.4 |
72.95% |
45.91% |
|||
|
85 |
2.4 |
55.81% |
85 |
1.9 |
44.19% |
11.63% |
36.64% |
||
|
NWpa.+G.T1 |
20 |
0 |
0.00% |
Wpa.+G.T1 |
20 |
0 |
0.00% |
0.00% |
|
|
60 |
1.9 |
51.35% |
60 |
1.8 |
48.65% |
2.70% |
|||
|
85 |
6.2 |
92.54% |
85 |
0.5 |
7.46% |
85.07% |
29.26% |
||
|
Total average |
33.27% |
||||||||
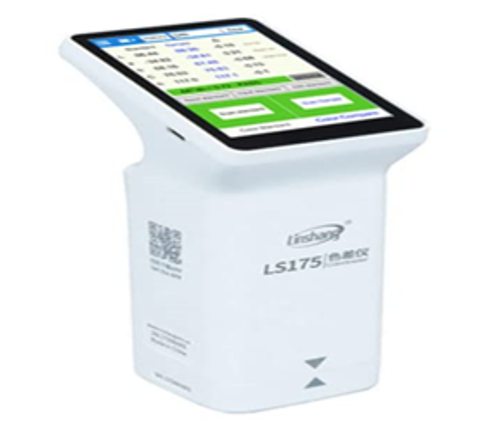
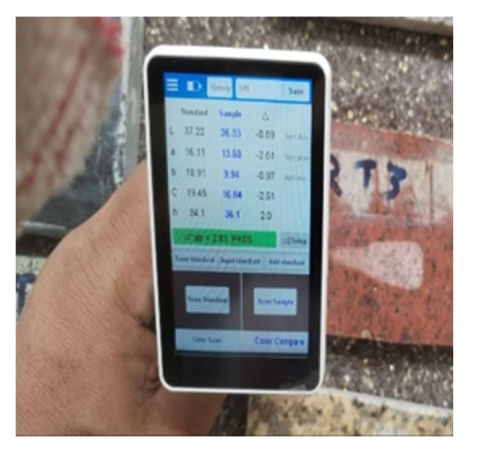
3.2 Color brightness test
The test was conducted according to the British standard (BS EN ISO 10545-16:2012) [56] using a Colorimeter, as shown in Figure 25. Color values were obtained from the device readings, as illustrated in Figure 26. The average values were then calculated, and the results were extracted as shown in Table 5.
Figure 25. The colorimeter [57]
Table 5. The results of the color test for finishing materials
|
Al-Shaheed Al-Saeed School |
||||||||
|
PUS |
Color |
Sample |
NPUS |
Color |
Standard |
Difference Ratio |
Result |
d.E*ab |
|
GRT2 |
L |
51.51 |
NGRT2 |
L |
51.66 |
-0.15 |
PASS |
1.28% |
|
a |
2.6 |
a |
3.78 |
-1.18 |
||||
|
b |
9.45 |
b |
9.93 |
-0.48 |
||||
|
C |
9.8 |
C |
10.62 |
-0.82 |
||||
|
h |
74.6 |
h |
69.1 |
5.5 |
||||
|
GRT4 |
L |
34.53 |
NGRT4 |
L |
41.38 |
-6.79 |
NG |
7.13% |
|
a |
-0.43 |
a |
-0.84 |
0.41 |
||||
|
b |
1.4 |
b |
-0.73 |
2.13 |
||||
|
C |
1.46 |
C |
1.11 |
0.35 |
||||
|
h |
107 |
h |
220.9 |
-113.9 |
||||
|
CT2 |
L |
76.55 |
NCT2 |
L |
76.92 |
-0.37 |
PASS |
0.59% |
|
a |
0.97 |
a |
0.91 |
0.06 |
||||
|
b |
5.28 |
b |
4.82 |
0.46 |
||||
|
C |
5.36 |
C |
4.9 |
0.46 |
||||
|
h |
79.5 |
h |
79.3 |
0.2 |
||||
|
CT3 |
L |
79.39 |
NCT3 |
L |
85.56 |
-6.47 |
NG |
7.05% |
|
a |
0.11 |
a |
-0.39 |
0.5 |
||||
|
b |
6.25 |
b |
3.49 |
2.76 |
||||
|
C |
6.25 |
C |
3.51 |
2.74 |
||||
|
h |
88.9 |
h |
96.3 |
-7.4 |
||||
|
CT6 |
L |
48.6 |
NCT6 |
L |
45.04 |
3.56 |
PASS |
4.34% |
|
a |
-10.44 |
a |
-8.45 |
-1.99 |
||||
|
b |
7.23 |
b |
8.7 |
-1.47 |
||||
|
C |
12.69 |
C |
12.12 |
0.57 |
||||
|
h |
145.2 |
h |
134.1 |
11.1 |
||||
|
Wpa.+G.T1 |
L |
80.05 |
NWpa.+G.T1 |
L |
89.71 |
-9.66 |
NG |
11.10% |
|
a |
6.07 |
a |
3.49 |
2.58 |
||||
|
b |
24.7 |
b |
19.92 |
4.78 |
||||
|
C |
25.43 |
C |
20.22 |
5.21 |
||||
|
h |
76.1 |
h |
80 |
-3.9 |
||||
|
Total average |
5.25% |
|||||||
|
Al-Shaheed Abdul Hakim Al-Safi School |
||||||||
|
PUS |
Color |
Sample |
NPUS |
Color |
Standard |
Difference Ratio |
Result |
d.E*ab |
|
MOT1 |
L |
78.54 |
NMOT1 |
L |
63.09 |
15.45 |
NG |
15.60% |
|
a |
2.48 |
a |
3.79 |
-1.31 |
||||
|
b |
12.66 |
b |
14.48 |
-1.82 |
||||
|
C |
12.9 |
C |
14.96 |
-2.06 |
||||
|
h |
78.9 |
h |
75.3 |
3.6 |
||||
|
CT5 |
L |
79.79 |
NCT5 |
L |
78.47 |
1.32 |
PASS |
2.02% |
|
a |
4.07 |
a |
2.99 |
1.08 |
||||
|
b |
12.86 |
b |
13.94 |
-1.08 |
||||
|
C |
13.48 |
C |
14.25 |
-0.77 |
||||
|
h |
72.4 |
h |
77.8 |
-5.4 |
||||
|
CT7 |
L |
78.92 |
NCT7 |
L |
75.59 |
3.33 |
PASS |
3.48% |
|
a |
-0.14 |
a |
0.43 |
-0.57 |
||||
|
b |
4.03 |
b |
4.85 |
-0.82 |
||||
|
C |
4.03 |
C |
4.86 |
-0.83 |
||||
|
h |
91.9 |
h |
84.9 |
7 |
||||
|
Opa.+G.T1 |
L |
66.25 |
NOpa.+G.T1 |
L |
65.57 |
0.68 |
PASS |
1.35% |
|
a |
-23.8 |
a |
-22.81 |
-0.99 |
||||
|
b |
19.68 |
b |
19.07 |
0.61 |
||||
|
C |
30.88 |
C |
29.73 |
1.15 |
||||
|
h |
140.4 |
h |
140.1 |
0.3 |
||||
|
Wpa.+G.T1 |
L |
80.05 |
NWpa.+G.T1 |
L |
89.71 |
-9.66 |
NG |
11.10% |
|
a |
6.07 |
a |
3.49 |
2.58 |
||||
|
b |
24.7 |
b |
19.92 |
4.78 |
||||
|
C |
25.43 |
C |
20.22 |
5.21 |
||||
|
h |
76.1 |
h |
80 |
-3.9 |
||||
|
Total average |
6.71% |
|||||||
3.3 Discussion of the results for the first main variable (behavior impact)
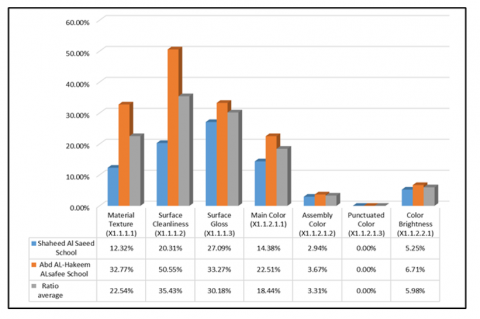
The bar chart (Figure 27) shows the percentage achieved by the two research samples according to various indicators, comparing the performance between two schools: Martyr Al-Saeed School and Abdul Hakim Al-Safi School, along with the overall percentage as follows:
Figure 27. The achieved percentages of the possible values of the main vocabulary (Behavioral Effect) for the two research samples
The indicator (Surface Cleanliness X1.1.1.2) recorded the highest percentages in both schools, with Abdul Hakim Al-Safi School scoring (50.55%), the highest among all the indicators related to the main variable, while Martyr Al-Saeed School scored (20.31%). This indicates that both schools have a high impact on surface cleanliness, but Abdul Hakim Al-Safi School is more affected. The indicator (Material Texture X1.1.1.1) ranked second in terms of percentage, with Abdul Hakim Al-Safi School achieving 32.77% and Martyr Al-Saeed School scoring 12.32%. This difference shows that the texture performance of finishing materials in Abdul Hakim Al-Safi School is more affected compared to Martyr Al-Saeed School. The indicator (Surface Gloss X1.1.1.3) recorded a percentage of 27.09% in Martyr Al-Saeed School, which is higher than the 33.27% achieved by Abdul Hakim Al-Safi School. This reflects that the finishing materials in Abdul Hakim Al-Safi School have a higher performance in terms of surface gloss compared to Martyr Al-Saeed School, although the difference is not as significant as in the previous indicators. The indicator (Main Color X1.1.2.1.1) recorded a percentage of 22.51% in Abdul Hakim Al-Safi School, compared to 14.38% in Martyr Al-Saeed School, with an overall percentage for these indicators of 18.44%, indicating that Martyr Al-Saeed School performs better in maintaining the Main Color of finishing materials. The indicator (Color Brightness X1.1.2.2.1) achieved a percentage of 6.71% in Abdul Hakim Al-Safi School, while Martyr Al-Saeed School achieved 5.25%. Although these percentages are low compared to other indicators, they suggest that the finishing materials in Abdul Hakim Al-Safi School have a slightly lower performance in this aspect. The indicator (Assembly Color X1.1.2.1.2) achieved a percentage of 3.67% in Abdul Hakim Al-Safi School, which is close to the 2.94% achieved in Martyr Al-Saeed School. This low percentage reflects that the performance of finishing materials may not be significantly affected by student behavior and that the two schools are comparable in this aspect. The indicator (Punctuated Color X1.1.2.1.3) did not register any notable percentage in either school, as neither school used punctuated color areas.
3.4 Discussion of the results for the second main variable (behavior type)
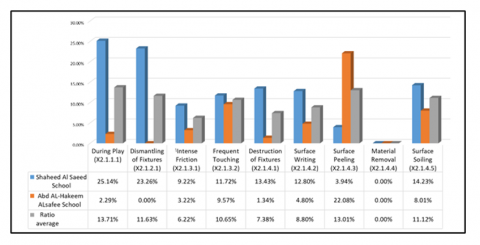
The bar chart (Figure 28) shows the percentages achieved by the indicators for the two research samples, comparing the aesthetic performance damage between Martyr Al-Saeed School and Abdul Hakim Al-Safi School across various indicators as follows:
Figure 28. The achieved percentages of the possible values of the main vocabulary (Type of Behavior) for the two research samples
The highest percentage was recorded in the indicator (During Play X2.1.1.1), where Martyr Al-Saeed School scored a very high percentage of 25.14% compared to the low percentage of 2.29% in Abdul Hakim Al-Safi School. This result reflects a significant disparity in behavior during play between the two schools, with a clear distinction for Martyr Al-Saeed School. The second highest percentage was recorded in the indicator (Dismantling of Fixtures X2.1.2.1), where Martyr Al-Saeed School achieved 23.26%, while Abdul Hakim Al-Safi School did not record any percentage in this indicator (0.00%). This large gap indicates that behavior related to dismantling fixtures is more common or observed in Martyr Al-Saeed School. In contrast, the indicator (Surface Peeling X2.1.4.3) achieved 22.08% in Abdul Hakim Al-Safi School, clearly exceeding the 3.94% achieved in Martyr Al-Saeed School. This suggests that the Abdul Hakim Al-Safi School exhibits more negative behavior in this aspect. On the other hand, the indicator (Destruction of Fixtures X2.1.4.1) recorded (13.43%) in Martyr Al-Saeed School compared to a low percentage of (1.34%) in Abdul Hakim Al-Safi School, indicating that this behavior is more prevalent in Martyr Al-Saeed School, and (Frequent Touching X2.1.3.2) indicator reveals a notable difference in behavior between the two schools. In Shaheed Al Saeed School, it recorded an average of 11.72%, which is higher than the percentage achieved in Abd Al-Hakeem Al-Safi School (9.57%). This suggests a difference in environmental factors or material durability between the two schools. The indicator (Surface Soiling X2.1.4.5) recorded 14.23% in Martyr Al-Saeed School compared to 8.01% in Abdul Hakim Al-Safi School, indicating a relative difference in this behavior between the two schools. Regarding the indicator (Surface Writing X2.1.4.2), there was a variation, with Martyr Al-Saeed School recording (12.80%) while Abdul Hakim Al-Safi School recorded (4.80%), reflecting a higher prevalence of behavior related to surface writing in Martyr Al-Saeed School. The indicator (Intense Friction X2.1.3.1) recorded 9.22% in Martyr Al-Saeed School, while Abdul Hakim Al-Safi School recorded a lower percentage of 3.22%. Finally, regarding the indicator (Material Removal X2.1.4.4), neither school recorded a notable percentage, suggesting that this behavior may not be significantly relevant or observed in either school.
3.5 Discussion of the results for the third main variable (Time of behavior occurrence)
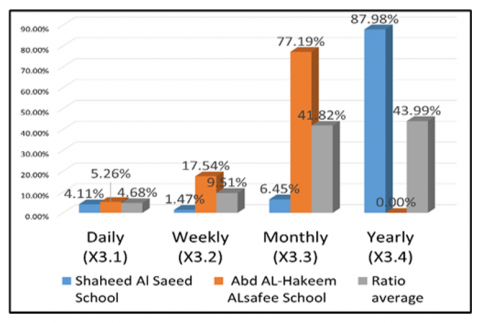
The bar chart (Figure 29) shows the percentages achieved by the indicators for the two research samples, comparing the performance of Shaheed Al Saeed School and Abd Al-Hakeem Al-Safi School across different time periods as follows:
Figure 29. The achieved percentages of the possible values of the main vocabulary (Behavior Time) for the two research samples
The highest percentage was recorded in the (Yearly X3.4) indicator, where Shaheed Al Saeed School scored a very high percentage of 87.98%, while Abd Al-Hakeem Al-Safi School did not record any percentage. This significant difference shows that behavior associated with the Yearly time frame was more common in Shaheed Al Saeed School compared to Abd Al-Hakeem Al-Safi School. The second highest percentage was recorded in the (Monthly X3.3) indicator, where Abd Al-Hakeem Al-Safi School achieved a high percentage of 77.19%, while Shaheed Al Saeed School recorded a lower percentage of 41.82%. These results reflect a variation in behavior related to the monthly time frame between the two schools, with a clear distinction for Abd Al-Hakeem Al-Safi School in this regard. The (Weekly X3.2) indicator ranked third in terms of percentage achieved, with Abd Al-Hakeem Al-Safi School recording 17.54%, while Shaheed Al Saeed School achieved a low percentage of 1.47%. This indicates that behaviors occurring on a weekly basis are more common in Abd Al-Hakeem Al-Safi School. Finally, the (Daily X3.1) indicator had the lowest percentage achieved, with Abd Al-Hakeem Al-Safi School recording 5.26%, while Shaheed Al Saeed School recorded a very close percentage of 4.11%. The average overall percentage for this indicator was 4.68%, reflecting a similarity in daily behaviors between the two schools.
3.6 Discussion of the results for the fourth main variable (Location of behavior occurrence)
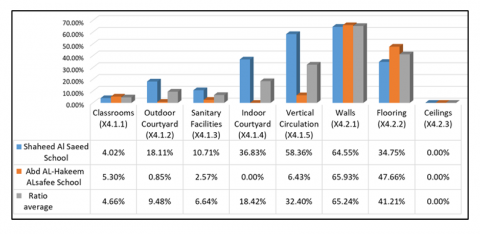
The bar chart (Figure 30) shows the percentages achieved by the indicators for the two research samples, comparing the locations of behavior occurrence between Shaheed Al Saeed School and Abd Al-Hakeem Al-Safi School across different elements and spaces in the school building as follows:
Figure 30. The achieved percentages of the possible values of the main vocabulary (Behavior Location) for the two research samples
The highest percentage was recorded in the (Walls X4.2.1) indicator, with Abd Al-Hakeem Al-Safi School achieving 65.93%, followed by Shaheed Al Saeed School with 64.55%. The overall average percentage was 65.24%, indicating a strong concentration of behaviors around the walls in both schools, with a slight advantage for Abd Al-Hakeem Al-Safi School. The second highest percentage was recorded in the Vertical (Circulation X4.1.5) indicator, where Shaheed Al Saeed School scored 58.36%, compared to 56.43% for Abd Al-Hakeem Al-Safi School. These similar percentages reflect that vertical circulation accounts for a significant portion of behaviors related to location in both schools. The (Flooring X4.2.2) indicator ranked third, with Abd Al-Hakeem Al-Safi School achieving 47.66%, while Shaheed Al Saeed School recorded a lower percentage of 34.75%. These results suggest that behaviors related to floors are more common in Abd Al-Hakeem Al-Safi School compared to Shaheed Al Saeed School. The (Indoor Courtyard X4.1.4) indicator showed a percentage of 36.83% in Shaheed Al Saeed School, which is much higher than the 10.71% recorded in Abd Al-Hakeem Al-Safi School. This result highlights the importance of the indoor Courtyard in Shaheed Al Saeed School as a major location for behaviors. Regarding the (Sanitary Facilities X4.1.3) indicator, Shaheed Al Saeed School recorded 10.71%, while Abd Al-Hakeem Al-Safi School recorded a lower percentage of 2.57%. The overall average percentage was 6.64%, indicating that sanitary facilities are not a major location for behaviors in either school. The (Outdoor Courtyard X4.1.2) indicator showed low percentages in both schools, with Shaheed Al Saeed School recording 18.11% and Abd Al-Hakeem Al-Safi School recording a much lower percentage of 0.85%. The overall average percentage was 9.48%, indicating that external gathering spaces are not a central location for behaviors in Abd Al-Hakeem Al-Safi School. The (classrooms X4.1.1) indicator had the lowest percentage, with Abd Al-Hakeem Al-Safi School recording 5.30%, while Shaheed Al Saeed School recorded a lower percentage of 4.02%. The overall average percentage for this indicator was 4.66%, reflecting that classrooms are not a primary location for behaviors in either school. Finally, the (Ceilings X4.2.3) indicator did not record any percentage in either school, indicating that ceilings are not affected by behaviors.
3.7 Discussion of the results for the fifth main variable (Behavior Frequency)
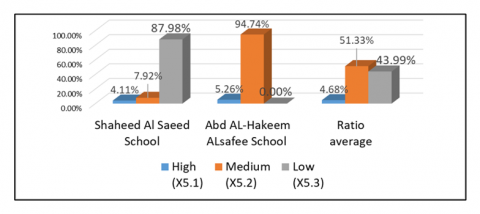
The bar chart (Figure 31) shows the percentages achieved by the indicators for the two research samples, comparing the frequency of behaviors in Shaheed Al Saeed School and Abd Al-Hakeem Al-Safi School across three different levels of behavior frequency: high, medium, and low, as follows:
Figure 31. The achieved percentages of the possible values of the main vocabulary (Behavioral Frequency) for the two research samples
The highest percentage was recorded in the (Medium X5.2) indicator, with Abd Al-Hakeem Al-Safi School achieving a very high percentage of 94.74%, while Shaheed Al Saeed School recorded a much lower percentage of 7.92%. This result reflects a clear disparity in medium-frequency behaviors between the two schools, with a clear dominance of this type of behavior in Abd Al-Hakeem Al-Safi School. The second highest percentage was recorded in the (Low X5.3) indicator, where Shaheed Al Saeed School achieved 87.98%, while Abd Al-Hakeem Al-Safi School did not record any percentage in this indicator. This suggests that low-frequency behaviors were significantly more prominent in the Shaheed Al Saeed School, which may reflect a greater focus on reducing the frequency of undesirable behaviors. Finally, the (High X5.1) indicator showed a lower percentage compared to the other indicators, with Shaheed Al Saeed School recording 4.11%, while Abd Al-Hakeem Al-Safi School recorded 5.26%. The overall average percentage for this indicator was 4.68%, reflecting that high-frequency behaviors are not particularly common in either school.
3.8 Discussion of the results of the main vocabulary of the two schools
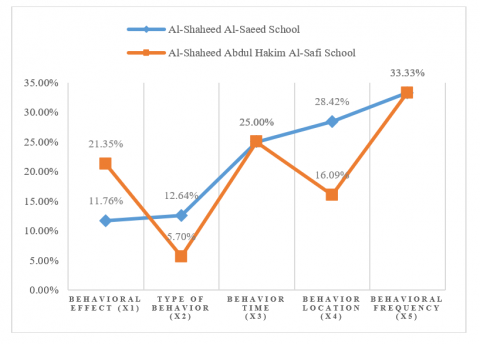
The bar chart (Figure 32) shows the average results of the main vocabulary for comparison between the two schools to discover whether the environment surrounding the two schools affects how the behaviors appear and affect the school, as follows:
Figure 32. Percentage rates achieved for the values of the main vocabulary for the two schools
The variable (Behavioral Effect X1) in Al-Shaheed Al-Saeed School recorded a percentage of 11.76%, while it was higher in Al-Shaheed Abdul Hakim Al-Safi School at 21.35%. This indicates that the behavioral impact of students in Al-Shaheed Abdul Hakim Al-Safi School is more detrimental to the aesthetic performance of finishing materials compared to the other school. As for the variable (Type of Behavior X2), Al-Shaheed Al-Saeed School recorded a percentage of 12.64% compared to 5.70% in Al-Shaheed Abdul Hakim Al-Safi School. This shows that there are greater triggers for the emergence of certain types of behaviors in the physical environment of Al-Shaheed Al-Saeed School compared to the other school. Regarding the variable (Behavior Time X3), the percentage reached 25.00% for both schools. This indicates that the duration for which finishing materials are exposed to student behaviors is equal in both schools. In terms of the variable (Behavior Location X4), Al-Shaheed Al-Saeed School recorded a percentage of 28.42% compared to 16.09% in Al-Shaheed Abdul Hakim Al-Safi School. This suggests that the locations where student behaviors occur in Al-Shaheed Al-Saeed School are more stimulating and provide a greater sense of safety, encouraging an increase in negative behaviors. Finally, for the variable (Behavior Frequency X5), the percentage was equal in both schools at (33.33%). This indicates that behavioral actions occur at a moderate frequency in both schools.
Based on the analysis of the main variables that appeared through their indicators for the two research samples, several conclusions were reached that could help improve the quality of aesthetic performance if they were taken into consideration, as follows:
Vertical circulation areas are the most impacted by negative behaviors, owing to high movement and crowding during use. The aesthetic vulnerability of materials in these areas increases susceptibility to damage. This is followed by the internal courtyard, whereas sanitary facilities and external gathering spaces are less affected. These findings suggest that the degradation of aesthetic materials is closely linked to the quality of finishes and the space-to-student ratio.
Training programs for educational and administrative staff could focus on identifying and managing students' negative behaviors, thereby minimizing their impact on school buildings.
Based on the conclusions drawn from the analysis of the results, the following recommendations can be made:
Develop materials that are more resistant to common negative behaviors, such as scratching or peeling, while focusing on cost-effective options suitable for the school environment.
[1] Krause, O., Mertins, K. (2006). Performance Management. Deutscher Universitätsverlag Wiesbaden. https://doi.org/10.1007/978-3-8350-9191-7
[2] Cambridge Dictionary. (2023). Performance meaning. https://dictionary.cambridge.org/dictionary/english/performance.
[3] Cambridge Dictionary. (2023). Definition of 'performance'. https://www.collinsdictionary.com/dictionary/english/performance.
[4] Waggener, L. (2014). Performance-based finishes. Health Facilities Management, 27(7): 35-39.
[5] Huang, C. (2018). Application and research of color in the façade design of elementary school buildings. In Proceedings of the 2nd International Conference on Art Studies: Science, Experience, Education (ICASSEE 2018), pp. 567-574. https://doi.org/10.2991/icassee-18.2018.114
[6] Al-Dabbagh, T.F. (2007). Human Behavior. Contemporary Thought House/Beirut. https://noor-book.com/tp2vqu.
[7] Skinner, B.F. (2010). Radical behaviorism. In An Introduction to Theories of Personality, pp. 289-315.
[8] Alaajeb, L. (2021). The concept of behavior in psychology. https://n9.cl/kxg21.
[9] Herz, R. (1982). The influence of environmental factors on daily behaviour. Environment and Planning A: Economy and Space, 14(9): 1175-1193. https://doi.org/10.1068/a141175
[10] Stren, P.C. (2000). Toward a coherent theory of environmentally significant behaviour. Journal of Social Issues, 56(3): 407-424. https://psycnet.apa.org/doi/10.1111/0022-4537.00175
[11] SchoolsVic. (2022). Behaviour-Students. https://www2.education.vic.gov.au/pal/behaviour-students/print-all.
[12] Medical staff. (2014). School environment and pupil behavior. https://n9.cl/qsvg4.
[13] Kordy, A. (2010). Destructive behavior in children. https://kenanaonline.com/users/ahmedkordy/posts/128223.
[14] Mansour, T., Al-Sharkawy, A., El-Din, A.E., Auf, F.A. (2003). Foundations of General Psychology. Anglo Egyptian Library. https://n9.cl/0mhs3b.
[15] Salary, S., Holliday, L., Keesee, M., Wachter, H.P. (2018). Building features in schools that influence academic performance. Journal of Civil Engineering and Architecture, 12: 163-197. https://doi.org/10.17265/1934-7359/2018.03.001
[16] Finn, J.D., Pannozzo, G.M., Achilles, C.M. (2003). The “why’s” of class size: Student behavior in small classes. Review of Educational Research, 73(3): 321-368. https://doi.org/10.3102/00346543073003321
[17] Upitis, R. (2004). School architecture and complexity. Complicity An International Journal of Complexity and Education, 1(1): 21-22. https://doi.org/10.29173/cmplct8713
[18] Johnson, A., Kuhfeld, M., Soland, J. (2021). The forgotten 20%: Achievement and growth in rural schools across the nation. AERA Open. https://doi.org/10.1177/23328584211052046
[19] Thomas, D.S., Butry, D.T., Prestemon, J.P. (2010). Enticing arsonists with broken windows and social disorder. Fire Technology, 47: 255-273. https://doi.org/10.1007/s10694-010-0145-1
[20] Endler, N.S., Magnusson, D. (1976). Toward an interactional psychology of personality. Psychological Bulletin, 83(5): 956-974.
[21] Lewin, K. (1935). A Dynamic Theory of Personality: Selected Papers. New York, London: McGraw-Hill Book.
[22] Lewin, K. (1936). Principles of Topological Psychology. New York: McGraw-Hill. https://psycnet.apa.org/doi/10.1037/10019-000
[23] Murray, H.A. (1938). Explorations in Personality. Oxford University Press.
[24] Goldstein, A.P. (1997). Controlling vandalism: The person-environment duet. School Violence Intervention: A Practical Handbook, pp. 290-321.
[25] Abdo, A. (2020). School behavioral problems: Concept, prevalence, causes, and how to deal with them. Mountain of Humanities and Social Sciences Magazine, 69: 40-50. https://jilrc.com/archives/13029.
[26] Al-Turkawi, K.H. (2016). Student behaviors inside school. Aloka Social Magazine. https://n9.cl/iuq945.
[27] Abdelkader, H. (2021). Classroom behavioral problems: what they are, causes, methods of treatment and dealing with them. Scientific Research Notebooks, 9(1): 54-83. https://www.asjp.cerist.dz/en/article/154305.
[28] Barakat, Z. (2008). Manifestations of negative behavior among primary school students from the teachers' point of view and their methods of dealing with them. An-Najah University Journal of Research: Humanities. https://search.shamaa.org/FullRecord?ID=63452.
[29] ADDitude. (2024). Easily Distracted? How to Tune Out Distractions & Focus on School. https://www.additudemag.com/end-distractibility-improving-adhd-focus-at-home-and-school/.
[30] Al-Jaber, Z.A. (1992). Availability of health and technical conditions for furniture used in classrooms in public schools in the State of Kuwait: A field study. Journal of Educational Sciences, 4(1): 1412. https://jes.ksu.edu.sa/ar/node/3555.
[31] Mohamed, M. (2001). Modern School Management. World of Books. https://n9.cl/v9vec.
[32] Selmi, J.A.K. (1998). In partial fulfillment of the requirement for to degree of master in education. An-Najah National University. https://repository.najah.edu/items/f6e49e5f-3d8b-48ea-bd41-cba87e4e2aab.
[33] Masoudi, A.H.M., Al-Hilali, D.A.A.K. (2019). The reality of school buildings and their impact on the educational reality of the holy Karbala Governorate according to the standards of comprehensive quality. Journal of the Faculty of Basic Education for Educational Sciences and Humanities, 2019(43): 2031-2047. https://n9.cl/fku27.
[34] School environment and student behavior. https://n9.cl/qsvg4.
[35] Shraim, S. (2021). Maintain school property. Mawdoo3 Magazine. https://n9.cl/x2q8p.
[36] Ali, A.A.H. (2020). School behavior problems, its concept, prevalence, causes, and how to deal with it. Journal of Generation Humanities and Social Sciences, 69: 41-61. https://jilrc.com/archives/13029.
[37] Smith, J. (2023). 6 tips to protect your school from vandalism. Cultris Security Systems Inc. https://cultrissecurity.com/6-tips-protect-school-vandalism/.
[38] Ebuy, H.T., El Haouzi, H.B., Benelmir, R., Pannequin, r. (2023). Occupant behavior impact on building sustainability performance: A literature review. Sustainability, 15(3): 2440. https://doi.org/10.3390/su15032440
[39] Bluyssen, P.M. (2019). Towards an integrated analysis of the indoor environmental factors and its effects on occupants. Intelligent Buildings International, 12(3): 199-207. https://doi.org/10.1080/17508975.2019.1599318
[40] Al-Fansh, T. (2021). How to maintain school property. Mawdoo3 Magazine. https://n9.cl/w14jr.
[41] Preiser, W., Vischer, J. (2005). Assessing Building Performance. Elsevier Butterworth-Heinemann. https://n9.cl/xe3vq.
[42] Radhy, A. (2019). Introduction to finishing works. https://n9.cl/cui21.
[43] Shareef, A.H. (2013). Finishing materials for hospital operating rooms in the USA and Egypt: Selection and actual performance in use. In AEI 2013: Building Solutions for Architectural Engineering, pp. 145-154. https://doi.org/10.1061/9780784412909.015
[44] Gharajedaghi, J. (2011). Chapter nine - Business architecture. In Systems Thinking, pp. 181-207. https://doi.org/10.1016/B978-0-12-385915-0.00009-X
[45] Al Khafajy, A.M., Hussain, A.M., Abood, A.A. (2011). Building performance. Iraqi Journal of Architecture and Planning, 1(1-3). https://doi.org/10.36041/iqjap.v7i1&2&3.194
[46] Thomas, T.R. (1981). Characterization of surface roughness. Precision Engineering, 3(2): 97-104. https://doi.org/10.1016/0141-6359(81)90043-X
[47] Ibem, E.O., Opoko, A.P., Adeboye, A.B., Amole, D. (2013). Performance evaluation of residential buildings in public housing estates in Ogun State, Nigeria: Users' satisfaction perspective. Frontiers of Architectural Research, 2(2): 178-190. https://doi.org/10.1016/j.foar.2013.02.001
[48] Hamida, M.B. (2020). Development of a framework for the effective implementation of building adaptive reuse throughout the project life-cycle in Saudi Arabia. Architectural Engineering Department, King Fahd University of Petroleum & Minerals. https://doi.org/10.13140/RG.2.2.15488.35840
[49] Vischer, J.C. (2008). Towards a user-centred theory of the built environment. Building Research & Information, 36(3): 231-240. https://doi.org/10.1080/09613210801936472
[50] Meir, I.A., Garb, Y., Jiao, D., Cicelsky, A. (2011). Post-occupancy evaluation: An inevitable step toward sustainability. Advances in Building Energy Research, 3(1): 189-219. https://doi.org/10.3763/aber.2009.0307
[51] Khalil, N., Nawawi, A.H. (2008). Performance analysis of government and public buildings via post occupancy evaluation. Asian Social Science, 4(9): 103-112.
[52] Sharpe, T. (2013). Building performance evaluation. Innovations for Sustainable Building Design and Refurbishment in Scotland, pp. 127-146. https://doi.org/10.1007/978-3-319-02478-3_8
[53] Preiser, W.F., Hardy, A.E., Schramm, U. (2017). From linear delivery process to life cycle phases: The validity of the concept of building performance evaluation. Building Performance Evaluation, pp. 3-18. https://doi.org/10.1007/978-3-319-56862-1_1
[54] ISO. (2014). Paints and varnishes — Determination of gloss value at 20°, 60° and 85°. ISO 2813:2014. https://www.iso.org/standard/56807.html.
[55] Amazon. (2019). Tri-Angle 20 60 85 Degree Gloss Meter Glossmeter with 350000 Data Storage PC Software Paints Coating Marble Tester." Amazon. https://n9.cl/63zlbu.
[56] BSI. (2012). Ceramic tiles - Determination of small colour differences. https://n9.cl/f49jk.
[57] Amazon. (2022). Newly LS175 portable colorimeter with 20mm aperture touch screen for textiles, leather and meat color difference anayzer. https://n9.cl/uo7y1.