Artur Maurin*![]() | Adam Adamkowski
| Adam Adamkowski![]()
© 2023 IIETA. This article is published by IIETA and is licensed under the CC BY 4.0 license (http://creativecommons.org/licenses/by/4.0/).
OPEN ACCESS
Short hydraulic turbine intake causes irregular flow velocity distribution, sometimes leading to localized reverse flows in available measurement cross-sections. Standard, propeller type current meters do not have the technical ability to distinguish the direction of flow and therefore, in unfavorable flow conditions, they affect the value of the measured flow rate. The paper presents the technical implementation of the bi-directional fluid velocity measurement method using modified propeller-type current meters. The flow characteristics for two different current meters in forward and reverse flow directions were investigated, showing the differences. A case study on the hydroelectric power plant was also presented. Computational fluid dynamics (CFD) calculations of the flow conditions in the inlet channels of the Kaplan-type turbine were carried out, which revealed the areas with reverse flow present in only available measurement cross-section.
efficiency tests, flow rate measurement, hydropower plants, standard current meters, reverse flows, velocity-area method
Hydropower has a significant potential to reduce usage of fossil fuels, and thus contribute to the protection of the environment. It is also important, due to global land water shortages, to maximize the hydropower efficiency, thus the accurate measurement of water flow is required in water turbine acceptance tests. Nowadays, among many modern technologies for measuring local fluid flow velocities, the propeller-type current meters are still widely used in various practical applications. These include, among others, measurements of the water flow rate in hydroelectric power plants. Numerous experiences show that current meters are best flow velocity measuring instruments especially for low-head hydropower plants, where short inlet channels do not have fully developed velocity profile [1-7]. Moreover, current meters are still used for irrigation and water systems with open channels and closed conduits (pipe-lines) when using the velocity-area method, in accordance with ISO 748 and ISO 3354 (ISO3354:2008; ISO748:2007). The applications of the current meters in hydrology and water management as well as in oceanography and marine research studies should not be also ignored. In all these applications, the propeller-type current meters are characterized by high measurement stability and operational reliability.
The study [8] presents a comprehensive review of the literature from the 1920s to the 1990s, covering various topics related to current meters, both mechanical and electronic (electromagnetic and acoustic). The articles cited in this work, e.g., articles [9-14] represent the state of the art on local fluid velocity measurements, including the different use of propeller-type current meters.
Later works, from the twenty-first century, are focused on various aspects of the current meter flow rate measurement methods [2-7]. There are also works dedicated for the design and characteristics of propeller-type current meters only. In the study [15] results showed that the uncertainty of group calibrations is substantially greater than that of calibrations of individual meters. However, in paper [16] a new calibration procedure for current meters was proposed other than the recommended in ISO 3455: 2007 [17] standard. The procedure requires much simpler and cheaper technical equipment compared to the standard and traditional method using towing pools and allows the calibration of instruments under real working conditions in a liquid stream - only a fairly small tank connected to a laboratory hydraulic route is required.
Recently, the study [18] focused on development of a novel design method for propeller-type current-meters used in measuring cross-sections with localized turbulence and flow detachment, in which the direction of flow velocity may change.
The velocity-area method that relies on integration of velocity distribution measured with water current meters. The method requirements cannot often be fulfilled as the lengths of the channels and/or penstocks supplying water to the hydraulic turbines are insufficient. In ASME PTC 2011 [19] recommends that the current meters should be capable of detecting reverse flow if the measurement cross-section based on the intake geometry. In the study [20] several cases have been presented showing that the use of current meters in short turbine inlets (intakes), even under extremely unfavorable conditions, is able to provide reliable flow rate measurement results with a correspondingly limited margin of uncertainty. However, these positive results are a consequence of several important factors, including the use of current meters capable of measurement in reverse flow direction. It should be noted that standard current meters cannot distinguish between a change in the flow direction when counting the number of revolutions of their impellers. The differences in current meter’s characteristics in both forward and reverse flow directions are also un-known.
In the current paper, aside from technical implementation of the method and current meter characteristics designated in both: forward and reverse flow directions, the authors present a case study of one of the Polish hydropower plants. CFD calculations of the intake flow conditions of the Kaplan-type turbine for this power plant were also performed. The results of these calculations indicated the possibility of localized reverse flow in the available measurement cross-section. The case study revealed what inaccuracy can be encountered when using standard current meters, without accounting for reverse flow direction.
The differences between the characteristics of two exemplary current meters with different impeller diameters, allowed to determine the influence on the accuracy of the measurement in cross-sections with localized reverse flows and flow detachments for both (normal and reverse) flow directions. Finally, it was also indicated, that regardless of the improvement in the accuracy of the flow rate measurement, the developed method can be used to verify CFD calculations in large-size hydropower plants, especially in cases of complex and irregular turbine intakes.
2.1 Basic principles of flow rate measurement using current meters
While the velocity-area method is used to measure discharge, a number of propeller-type current meters are placed at specified points in an appropriate measurement cross-section of a closed conduits or open channels. Depending on the size of the measurement cross-section, a suitable international standard (ASME PTC18; IEC60041; ISO748:2007) can be used to specify number of current meters and their arrangement.
The measured local velocities are used to determine in the entire measurement cross-section the velocity field (as a spatial function), which, after appropriate integration, enables the determination of the flow rate (discharge). We can formally write it in the following form, assuming the Cartesian coordinate system x-y on the plane of the measurement cross-section restricted by the area A:
$Q=\iint_A V(x, y) d x d y$ (1)
Taking into account the boundary layer correctly during integration is important, as the resultant volumetric flow rate Q is significantly depending on it. The layer between the channel wall and the nearest current meter has a specific velocity distribution, which is well approximated by the formula:
$V=V_R\left(\frac{r}{R}\right)^{1 / m}$ (2)
where, VR is the velocity measured by the nearest wall current meter (for r=R), R is the distance between the wall and the nearest wall current meter, r=sqrt(x2+y2) is the radial coordinate with the origin at the wall, and m is the inverse of the exponent that depends on Reynolds number and wall roughness. This formula is used for 2.5D visualization of velocity distribution.
Difficult conditions for flow rate measurement with current meters are generally found in hydropower plants with short turbine intakes, where other methods are practically out of the question. Numerous experiences show that when accurate calibrated current meters are appropriately distributed in measurement cross-section, when the fluid velocity distribution is properly determined and integrated with the correct consideration of boundary layers and the so-called blocking effect, the measurement results are sufficiently accurate from a practical point of view. It should be noted here that the methods based on ultrasonic (acoustic) techniques are not widely accepted. This statement is based on author’s experience.
Water flow causes rotation of the current meter propeller. A magnet attached to the current meter propeller sends a signal (impulse)-one per revolution - through a single, water-tight sealed reed switch. The number of impulses in a given time period (propeller rotational speed) depends on the velocity of the water at the point where the current meter is placed. The sequence of impulses is recorded by the connected counter.
The number of propeller revolutions, measured during a certain time (exposure time) then gives the flow velocity, V [m/s], according to the current-meter calibration formula (current meter equation):
$V=C \cdot n+V_0$ (3)
where, C [m] and V0 [m/s] are the fitted calibration constants (determined by the least squares method for the calibration points), n is propeller rotation per second (rotational speed) [1/s].
According to the physical interpretation, the fitted constant, C, is hydraulic pitch of the current meter propeller and the fitted constant, V0, can be assumed to be the minimum water velocity necessary to overcome the hydraulic and mechanical friction of the current meter propeller. Thus, the fluid velocity at a point of the measurement cross-section is determined by measuring the rotational speed of a current meter located at that point and by entering this value in the current meter calibration formula.
According to the standards, it is recommended to calibrate the current-meters in the towing pools of the required length - with the use of towing trolleys driven at numerous stable speeds ISO 3455 (ISO 3455:2021).
2.2 Modifications of the current meter measuring system
In standard setup, the counters for propeller-type current meters used during the calibration or measurements, have built-in timers and record the number of revolutions for a preselected exposure time. Some devices also allow to pre-set the number of pulses and register the time. The most advanced counters are able to directly convert rotation signal to flow velocity displayed on the viewing screen. Some models of counters have the option of data logging. Despite their complexity, all of the above solutions have a common limitation-with only one build-in reed switch rotor revolutions are measured without specifying their direction. To designate the direction of the flow measured by the propeller-type current meter, a second reed switch is required. Two reed switches placed non diagonally (any angle below 180°, preferably 90°) around the perimeter of the current meter body are sufficient to provide four stage on-off (encoder like) sequence during one propeller revolution. This first modification allows to determine the rotation direction according to increment encoder principle of operation.
To record and interpret the generated signal sequence the second modification is required: instead of standard counter a programmable microcontroller allowing multiple individual current meters to be connected in the dual channel mode is adopted. The state on the current meter double inputs must be processed in real-time. The microcontroller program outputs the current meter accumulated rotation count every second. The downstream rotation of the current meter rotor adds to the impulse count, while upstream (reverse flow)-subtracts from the impulse count. Above setup was verified by testing two current meters differing with propeller-type and diameter under laboratory conditions in both flow directions.
2.3 Experimental determination of current meters characteristics in both flow directions
The velocity-area method with the propeller-type current meters have been successfully used for several dozen years in practice, mainly in hydropower plants as well as various pumping systems [21]. Various types of current meters are available (Figure 1). Depending on expected flow velocity, the diameter and geometry of the propeller may vary. For higher velocities, lighter propellers are used. For lower velocities-smaller in diameter, but with more twisted blades. The current meter body is custom made.
The main purpose of the research described below was to analyse and evaluate the differences between the characteristics of current meters operating in the forward and reverse direction of liquid flow. To achieve this goal, two current meters with rotor diameters of 80mm (D80) and 120mm (D120), respectively, were tested in a hydrodynamic tunnel located in the main hall of the IMP PAN laboratory in Gdansk-in a tunnel that for many years was used to conduct a wide spectrum of tests of various types of ship propellers, air foils and hydrokinetic turbines [22, 23] (Figure 2). In a closed hydraulic system, a flow of water is stabilized in a wide range of velocities by a circulation pump equipped with a variable-frequency drive (VFD).
The current meters selected for the tests, modified as described in section 2.2, were placed successively in the measuring chamber of the hydrodynamic tunnel. The chamber has a square cross-section of 425mm×425mm. The propeller of the current meters was consistently placed in the axis of the tunnel and in the same measurement cross-section of the chamber. The change of the flow direction was achieved by inverting the body of the tested current meter and changing the anchoring point (Figure 3 and Figure 4).
Figure 1. Typical current meters (propellers are manufactured by Ott and GMP) used by IMP PAN
The measuring equipment used during the tests of the two current meters, was consisting a digital system for counting the number of rotor revolutions in both directions and the so-called smart differential pressure transducer with an adjustable measuring range, +/-0.075% accuracy class. The pressure difference measurement between the inlet and the outlet of the previously calibrated confusor, allows to determine the flow rate (average velocity) in the tunnel chamber. The current meter characteristics are derived from the measured average water velocity and the number of rotor revolution in time (rotational speed). Due to the influence of the measuring chamber walls, a completely flat velocity distribution in the measurement cross-section cannot be achieved. Here, it should be noted, that the main purpose of these tests was only to determine the differences between the characteristics of the current meters for both flow directions (forward and reverse). From the measurement accuracy point of view, it is important to designate current meter characteristics under the conditions of homogeneous flow, which is required in the standardized calibration procedure.
Figure 2. Hydrodynamic tunnel located in IMP PAN, Gdansk-schematic diagram
Figure 3. The 80mm diameter current meter in the measuring chamber: standard setting
Figure 4. The 80mm diameter current meter in the measuring chamber: reverse setting
The current meters were tested for several different water velocities for each of the two directions of the flow. The obtained measurement data for each of the cases was approximated by a linear function. The results can be considered as a current meter characteristic, each for one flow direction, and presented for both tested current meters in Figure 5 and Figure 6. The figures also show the calibration characteristics of the tested current meters along with the calibration formulas, determined previously in the towing pool in accordance with the ISO 3455 (ISO 3455:2021) standard.
The uncertainty of the constant C was estimated in accordance with the general framework and recommendations for assessing and expressing the measurement uncertainty which are contained in the Guide [24]. The Type A standard uncertainty is obtained from a probability density function derived from an observed frequency distribution, while a Type B standard uncertainty is obtained from an assumed probability density function based on the degree of belief that an event will occur (often called subjective probability). The following was estimated: (1) the standard uncertainty with the A-method (statistical method) assuming the t-Student probability distribution for n=10 measured points with a confidence level of 68.27% and the number of freedom n-1 and (2) B-type standard uncertainty resulting from the accuracy of the applied measuring methods and devices, i.e., the uncertainty of the flow measurement calibration using a confusor, applied differential pressure transducer and revolution counter. The Type A and Type B classification is used to indicate the two different ways of evaluating uncertainty components and is not meant to indicate that there is any difference in the nature of the components resulting from the two types of evaluation. Both types of evaluation are based on probability distributions, and the uncertainty components resulting from either type are quantified by variances or standard deviations.
The resulting combined standard uncertainty equals to: for D80 current meter - ds(C)=0.56% and D120 current meter -ds(C)=0.55%. The uncertainty extended to the confidence level of 95% was respectively dC=k dsC=1.12% and 1.11% assuming the extension factor k=2.
A comparative analysis of the obtained results allows to state the following: The coefficient C, which determines the inclination of the characteristics, is higher for reverse flows by 2.22% for the 80mm current meter and by 1.36% for the 120mm current meter. The absolute values of the lines intersection with the abscissa (differences in the constants V0) are also greater. These effects are mainly the result of different flow resistances of the current meters depending on their position in the flow. Higher reverse-flow resistance results from the presence of the current meter's body before its propeller, as well as the different shape of the propeller blades in the inlet/outlet area.
The differences found between the characteristics of the tested current meters may indicate the need for bidirectional calibration for measurements in areas of high turbulence and it may be sufficient to use the current meters in two flow directions without additional calibration.
On the other hand, tests of the current meters carried out for the standard flow direction, both in the towing pool and in the hydrodynamic tunnel, showed some differences between the characteristics-the differences in the C values reach 0.84% for the D80 current meter and 1.99% for the D120 current meter. These differences may confirm the above-mentioned lack of uniformity of the liquid velocity distribution in the cross sections of the tunnel measuring chamber. Therefore, the conclusion is that the hydrodynamic tunnel used in the tests cannot be used to calibrate the current meters, unless appropriate corrections for the velocity distribution in the measuring chamber and their impact on the characteristics are considered.
Figure 5. Characteristics for D80 current meter in forward and reverse flow directions compared with the calibration curve
Figure 6. Characteristics for D120 current meter in forward and reverse flow directions compared with the calibration curve
Figure 7. Diagram of the flow system with highlighted discharge measurement cross section (the geometry that was considered in CFD is contained inside the orange rectangle)
Figure 8. Distribution of the current meters in the measurement cross-section
Practical experience shows that when calibrated current meters are appropriately distributed (located) in measurement cross-sections and when the fluid velocity distribution is properly determined and integrated with the correct consideration of boundary layers and the so-called blocking effect the measurement results are usually sufficiently accurate from a practical point of view. The blocking effect of the flow is caused by the presence of the current meter (obstacle) in the flow. Good conditions for conducting measurements with current meters are usually encountered in hydropower plants equipped with penstocks and open channels of sufficient length in the relation to cross-sectional area. Difficult conditions for measuring flow rate with current meters are generally found in low head hydropower plants with short turbine intakes. The use of other methods in these conditions is impractical due to low economic efficiency and lack of proven measurement reliability. In the vast majority of Polish low head hydropower plants, the discharge measurements have to be often conducted in such conditions, where current meters are placed in stoplog hollows, in short intakes of tested turbines. The main difficulty in mentioned cases is disturbed velocity vector alignment. The typical solution is using component current-meters capable to measure properly axial velocity component in case of velocity direction deviating from that of the propeller axis by up to 45°. If the measurement is taken at the intake structure and the component current meters are not accessible or the flow is featured by large scale vortices, the IEC 60041 standard recommends artificially extending the intake. Another option, relevant for measurement in short water-ways and at the turbine chamber inlet, is orienting current-meters along streamlines previously determined by the CFD calculations. Velocity component normal to the measurement cross-section can be easily calculated using direction coefficients. Unfortunately, there are cases with particularly unfavourable flow conditions with reverse flows appearing in the measurement cross-section, where even special orientation of the current-meters is unusable. One of such cases is presented in this paper.
The considered power plant, which operates since 1929, is equipped with two similar Kaplan type turbines with electric power of about 1900kW (in total) for water head of 9.3 meters and volumetric flow rate of 2×14.5m3/s=29.0m3/s. There are no suitable conditions for measuring the flow rate. The only available measurement cross-section for the current meters is presented on the diagram (Figure 7). Unlike in a typical inlet channel a measurement cross-section is located in close proximity to the shut-off gate, limited at the top by a concrete cornice (0.8m wide), and on the front left, by a rounded edge of the wall (pillar), about 1m long, separating the channels. The Distribution of the current meters in the measurement cross-section is presented on Figure 8.
To investigate the problem of reverse flows in the measurement cross-section, the water supply system in the intake area of the tested water turbine was numerically analyzed using CFD. Calculations were performed in Ansys Discovery-a GPU-based simulation environment that combines CAD modelling and high-fidelity mesh free simulation methods. In the field of numerical analysis, mesh free methods are those that do not require direct connection between nodes of the simulation domain, i.e., a mesh, but are rather based on interaction neighbouring nodes. As a consequence, properties such as mass or kinetic energy are no longer assigned to mesh elements but rather to the single nodes. Mesh free methods enable the simulation of some otherwise difficult types of problems, at the cost of extra computing time and programming effort. The absence of a mesh allows Lagrangian simulations, in which the nodes can move according to the velocity field. The CFD calculations in the ANSYS Discovery has implemented the Lambda2 vortex detection criterion. This vortex core line detection algorithm can adequately identify vortices from a three-dimensional fluid velocity field [25].
CFD calculations were performed for two preselected water levels-low and high (Figures 9-12). In the case of a low water level, with its surface located 150mm above the concrete cornice, and in the case of a high water level-650mm above the concrete cornice, limiting the measurement cross-section plane. The desired water level was controlled by limiting overflow through free water surface (slip wall boundary condition) to zero. This required adjusting the flow rate at the inlet. The average measured flow velocity in the cross-section was 0.85m/s in both cases, which corresponds to the volumetric flow rate at the level of about 14.5m3/s (defined at the domain inlet). The standard earth gravity was applied in the calculation domain Figure 7. The domain outflow (just before turbine intake) was defined by static pressure value of 150kPa.
Figure 9. The front view of velocity distribution in measurement cross section with visible stream lines for 0.85m/s area averaged velocity, for low water level
Figure 10. The top view of velocity distribution in the middle of measurement cross section with visible stream lines for 0.85m/s area averaged velocity, for low water level
Figure 11. The front view of velocity distribution in measurement cross section with visible stream lines for 0.85m/s area averaged velocity, for high water level
Figure 12. The top view of velocity distribution in the middle of measurement cross section with visible stream lines for 0.85m/s area averaged velocity, for high water level
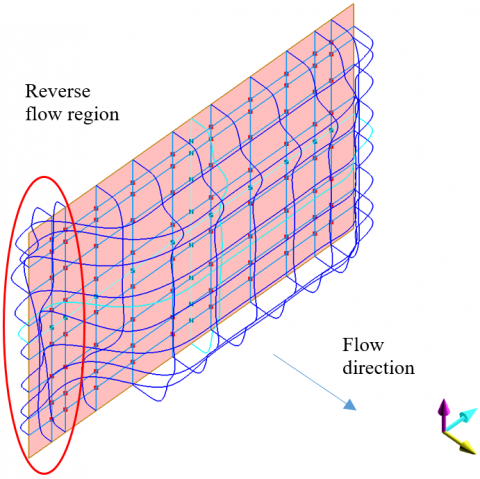
Figure 13. An exemplary distribution of the axial components of water velocity in the measurement cross-section of the current meters (left inlet channel, low water level)
Figure 14. The volumetric flow rate 8.58m3/s-calculated for positive flow velocity values only, V mean=~0.5m/s
Figure 15. The volumetric flow rate 7.78m3/s-calculated with negative flow velocity values, V mean=~0.45m/s
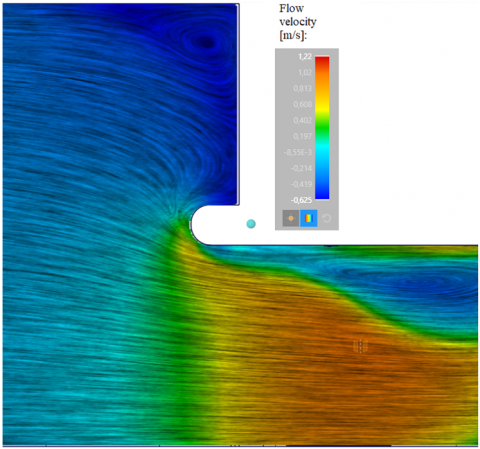
Figure 9 and Figure 11 present the velocity distributions and streamlines in the current meter measurement cross-section viewed from the direction of inflow, calculated for low and high water levels, respectively. On the other hand, Figure 10 and Figure 12 show the velocity distributions and streamlines visible from above, halfway up the measurement cross-section. For both presented cases, the effect of the shut-off of the inflow channel of the second turbine is visible-causing vortices and reverse flow next to rounded edge of the wall separating the inlet channels. It should be noted, that the higher water level affects the flow streamlines more, increasing the intensity of turbulence and inducing the reverse flows.
The results of CFD calculations were used to illustrate the practical significance of the developed method, which allows to distinguish the direction of the flow in the measurement cross-sections of current meters. Figure 13 presents the distribution of the axial velocity components in the measurement cross-section and reveals the areas in which the reverse flows are located for case with low water level. In order to assess the influence of these areas on the flow rate measurement, the flow rate was additionally calculated assuming no distinction of the flow direction, i.e., taking negative values of the axial velocity components as positive.
The effect of the modification of the of the current meter measuring system can be compared between Figure 14 and Figure 15. Figure 14 presents velocity distribution in the measurement cross-section where only positive component values (one directional current meter) are present.
Figure 15 presents the true velocity distribution containing negative velocity values that only bi-directional current meters can detect. The relative difference in the flow rate values determined in this example amounts to approximately 7.3%, which should be not accepted from the metrological and practical point of view. On this basis, it should be concluded that the proposed and developed method is justified wherever the areas of excessive swirls and separation flow are anticipated in measurement cross-sections used for current meters.
In this paper the reverse flow phenomenon, which may occur in very short water turbine intake systems, is investigated. CFD results help to visualize problematic reverse flows, however the source of the problem often remains unavoidable. To counter the reverse flows problem a modification of the standard current meter method is introduced. The expansion of the existing current meter measurement system with the ability to recognize the direction of propeller rotation will help to avoid critical errors during the flow rate measurements, performed under poor flow conditions. The presented case study has shown that without the use of current meters with capability to indicate the direction of rotor revolution, and thus the flow velocity in the areas of turbulence and detachment in exceptional conditions of measurement cross-section, the error of about 7% can be expected.
The differences between the two-way characteristics of the tested current meters may indicate the need for bidirectional calibration. However, that due to the usually small influence of the reverse flow on the measured flow rate, correcting the characteristics of the current meters using the 2.5% differences may be sufficient from the metrological point of view without additional reverse calibration.
The comparison of the test results for the different size two current meters, conducted in the towing pool and the hydrodynamic tunnel, leads to the conclusion that the hydro-dynamic tunnel used in the tests is not recommended for the calibration of current meters, unless appropriate corrections are considered, accounting for the uneven velocity distribution in the measuring channel.
[1] Kercan, V., Djelic, V., Rus, T., Vujanic, V. (1996). Experience with kaplan turbine efficiency measurements-currentmeters and/or index test flow measurement. Proc. IGHEM, Montreal, Canada.
[2] Thackray, P.R., Alcarraz, F., Ravezzani, B. (1998). Flow measurement at Dr. Gabriel Terra power station using current meter method. In Proceedings, 2nd International Conference on Hydraulic Efficiency Measurements (IGHEM).
[3] Grego, G. (2000). Comparison of discharge measurements in penstocks using current meters to test machinery efficiency in generation and pumping conditions. In Proceedings of the IGHEM. Kempten, Germany: IGHEM, pp. 1-8.
[4] Lemon, D.D., Bouhadji, L., Jiang, J., Topham, D. (2004). Applying CFD analysis to predicting ASFM bias in low head intakes with difficult hydraulic conditions. Proceedings. IGHEM, Lucerne, Switzerland.
[5] Muciaccia, F., Ormando, F., Vaccarone, S., Grego, G. (2018). Flow measurements with current meters at the inlet: Reliability of the results and evaluation of the uncertainty. In IGHEM 2018.
[6] Cepa, Z. (2014). Current meters measurement in an asymmetric flow conditions in closed conduit to verify turbine efficiency after its refurbishment. In Proceeding of 10th International Conference on Innovation in Hydraulic Efficiency Measurements, Itajubá, Brasil.
[7] Rolandez, G., Abgottspon, A., Staubli, T. (2014). Discharge measurements at la rance tidal power plant using current meters method. In 10th International Conference IGHEM on Innovation in Hydraulic Efficiency Measurements, Itajuba.
[8] Thibodeaux, K.G. (1994). Review of literature on the testing of point-velocity current meters. US Geological Survey Open-File Report, 94-123.
[9] Baker, R.C. (1993). Turbine flowmeters: II. theoretical and experimental published information. Flow Measurement and Instrumentation, 4(3): 123-144. https://doi.org/10.1016/0955-5986(93)90048-N
[10] Schlotthauer, F. (1924). Wassermessungen bei wasserkraftanlagen. Wasserkraft-Jahrbuch.
[11] Rubin, M., Miller, R.W., Fox, W.G. (1965). Driving torques in a theoretical model of a turbine meter. Journal of Fluids Engineering. Transactions of the American Society of Mechanical Engineers, 87(2): 413-420. https://doi.org/10.1115/1.3650565
[12] Takeda, R. (1975). Theoretical research on propeller type current meters. American Society of Mechanical Engineers, 97(4): 596-602. https://doi.org/10.1115/1.3446075
[13] Takeda, R. (1978). A design method on propeller current meters. Journal of Fluids Engineering. Transactions of the American Society of Mechanical Engineers, 100(1): 83-90. https://doi.org/10.1115/1.3448620
[14] Staubli, T. (2021). Propeller-type current meters. In Discharge and Velocity Measurements. CRC Press, pp. 95-100.
[15] Engel, P. (1999). Current meter calibration strategy. Journal of Hydraulic Engineering, 125(12): 1306-1308. https://doi.org/10.1061/(ASCE)0733-9429(1999)125:12(1306)
[16] Camnasio, E., Orsi, E. (2011). Calibration method of current meters. Journal of Hydraulic Engineering, 137(3): 386-392. https://doi.org/10.1061/(ASCE)HY.1943-7900.0000311
[17] International Organization for Standardization. (2007). Hydrometry: Calibration of current-meters in straight open tanks. ISO.
[18] Khozaei, M.H., Nourbakhsh, S.A. (2019). Analytical and numerical study of fluid flow in propeller-type current-meters. International Journal of Fluid Machinery and Systems, 13(2): 437-454. https://doi.org/10.5293/IJFMS.2020.13.2.437
[19] ASME Hydraulic turbines and pump-turbines. (2011). Asme Ptc 18-2011, 96.
[20] Taylor, J., Proulx, G., Lampa, J. (2012). Turbine flow measurement in intakes: A cost-effective alternative to measurement in penstocks. International Journal on Hydropower and Dams, 19(1): 84.
[21] Adamkowski, A., Krzemianowski, Z. (2012). The comparative analysis of the current-meter method and the pressure-time method used for discharge measurements in the kaplan turbine penstocks. In IOP Conference Series: Earth and Environmental Science. IOP Publishing, 15(2): 022021. https:/doi.org/10.1088/1755-1315/15/2/022021
[22] Góralczyk, A.D.A.M., Chaja, P.A.T.R.Y.K., Adamkowski, A.D.A.M. (2011). Method for calculating performance characteristics of hydrokinetic turbines. TASK Quarterly. Scientific Bulletin of Academic Computer Centre in Gdansk, 15(1): 43-57.
[23] Góralczyk, A., Adamkowski, A. (2018). Model of a ducted axial-flow hydrokinetic turbine-results of experimental and numerical examination. Polish Maritime Research, 25(3): 113-122. https://doi.org/10.2478/pomr-2018-0102
[24] Joint Committee for Guides in Metrology. (2008). Evaluation of measurement data-guide to the expression of uncertainty in measurement. International Organization for Standardization (ISO). Geneva. ISBN, 50: 134.
[25] Jiang, M., Machiraju, R., Thompson, D. (2005). Detection and visualization of vortices. The Visualization Handbook, 295-309. https://doi.org/10.1016/B978-012387582-2/50016-2