Abbas Ayad Khudhair* | Hussein Abd Shaia | Haider Habeeb Aodah | Maitham Mohamed Abdulreda
© 2022 IIETA. This article is published by IIETA and is licensed under the CC BY 4.0 license (http://creativecommons.org/licenses/by/4.0/).
OPEN ACCESS
The roads in the city of Nasiriya in southern Iraq suffer from problems that occur as a result of repeated vehicle loads or due to weak soil and lead to losing their performance and being out of service despite their construction for a very short period. The use of chemical additives to improve the subgrade widely worldwide and give strength and durability to the weak soil while the possibility of using chemical additives for the substrate in Al-Nasiriya is still practically limited. The study aimed to verify the use of chemical additives (cement, lime, and ferric chloride) and to know their effect on the properties of Al-Nasiriya soil. The results showed a clear improvement in the UCS test when using chemical additives, and then the optimal percentages of additives were determined and were 9%, 10%, and 2% respectively, in addition to knowing the effect of the curing period (1, 7 and 14) days on the results of the test. For the other tests (maximum dry density, CBR, swelling, and optimum moisture content) were verified for the optimal chemical percentages and it was observed that the CBR values increased and the swelling values decreased after treatment and soaking in water for all additives, while the compaction parameters had a different behavior between the materials additive used.
cement, lime, ferric chloride (FeCl3), compaction, UCS, CBR
The subgrade layer is the basis for the whole pavement structure and it is the dominant layer as it bears the stresses of all the layers from the top, The thickness of this layer is (150 to 300 mm) and this layer must have a bearing capacity at the optimum water content [1].
This layer suffers swell and shrinkage when its clay the reason is due to the fact that it contains the mineral montmorillonite, the process of removing all the layer and replacing it with stronger soil is considered to be of high cost and takes a lot of time. Also, Mechanical soil improvement does not provide a guarantee for the strength and durability of the soil. Therefore, soil properties can be improved by adding chemicals to it such as cement, lime, and other chemicals [2].
In another soil improvement technique, Thamer and Shaia [3] have been used a geotextile material to improve the soil of the city of Al-Nasiriya and the practical results gave an increase in the bearing capacity of the soil with the use of these materials, While the deep mixing method was used by, Ho et al. [4] to increase the bearing capacity of the soil and gave good results.
The additives were added to the subgrade layer of Al-Nasiriya soil by Sarsam et al. [5] and an increase in the bearing capacity and an improvement in the properties of the soil were observed, as the value of CBR increased, also decreased settlement.
Cement and lime were used by Etim et al. [6] to improve clay soil, they noted that the values of UCS and CBR have been increased, as well as an improvement in the properties of that soil.
Ferric chloride was added by Koteswara Rao et al. [7] and mixed with Rice husk ash to improve the subgrade layer, they found an improvement in the value of the UCS and they obtained good results in terms of shrinkage and swelling.
Srinivas and Raju [8] conducted field tests on the subgrade layer and improved it with CaCl2, FeCl3, and KCl, they showed that FeCl3 gave the best performance and more strength and durability than the chemical materials.
While Bharambe and Patil [9] used ferric chloride and fly ash in soil to improve the soil. They noticed an increase in the value of CBR by about 155%. In addition, they found that adding ferric chloride to soil improved with fly ash reduced the swelling of soil.
2.1 Materials used
2.1.1 Soil
A weak subgrade was collected from one of the areas of Al-Nasiriya city, 380 km south of Baghdad, the location was shown in (Figure 1). The soil sample was chosen at a height of (1.5-2.0 m) below natural ground level. The chemical properties of the soil are shown in (Table 1). While the physical properties are shown in (Table 2).
Figure 1. The geographical location of the collected soil
Table 1. Chemical composition of soil
|
Composition |
Value% |
|
Sio2 Al2o3 Fe2o3 Cao Mgo K2o Na2o Cl So3 Loss On Ignition |
9.3 0.33 0.21 49.8 0.99 0.12 0.017 0.17 0.98 37.8 |
Table 2. Index and engineering properties of weak subgrade
|
Property |
Value |
|
Liquid Limit% Plastic Limit% Plasticity Index% Classification IS Classification UCSC Specific Gravity MDD OMC CBR (compacted to MDD at OMC) Unconfined compressive strength (at OMC & MDD) Hydrometer test |
36.5 20.22 16.28 A6 CL 2.61 1.804 gm/cm3 122.37 Ib/ft3 16.3% 6.6 344 Kn/m2 Figure 2 & 4 |
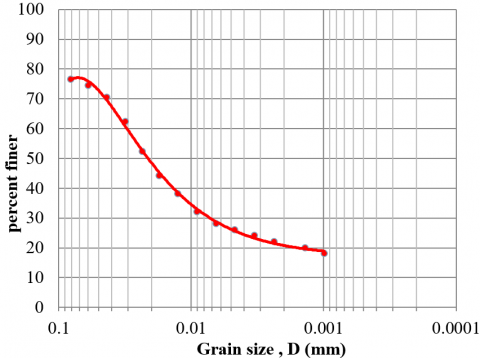
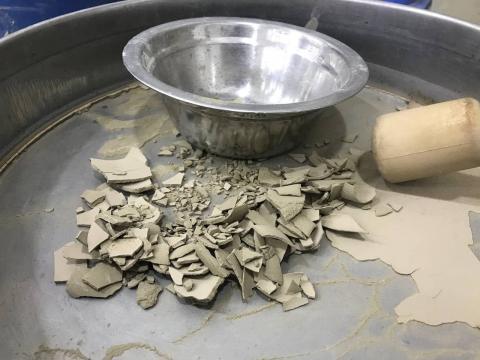
The Hydrometer test for natural soil in Figure 2, and found the Soil finer than the No.200 sieve size was less than 90%, so the modified method of the hydrometer was done by washing remaining on the sieve No. 200 and drying in the oven and crushing as showing in Figure 3, it was obtained good results shown in Figure 4, This method was carried out based on Soil Mechanics Laboratory Manual Book [10].
Figure 2. Grain size distribution by hydrometer
Figure 3. Washing remaining and drying it
Figure 4. Grain size distribution by modifying the method
2.1.2 Cement
Sulfate-resistant cement (SEM 42.5 N–SR 3.5) made in Al- Samawa/Iraq was used in this study, The amount of cement used was between 1 to 11% by dry weight of soil with an increment of 2%. Table 3 shows its chemical composition.
Table 3. Chemical composition of cement
|
Composition |
Percent |
|
Cao Sio2 Al2O3 Fe2O3 lime saturation factor Mgo So3 Burning loss Insoluble substances C3A |
56.4 21.5 5.0 6.0 0.7831 3.0 2.15 3.0 1.22 3.1 |
2.1.3 Lime
Hydrated lime (calcium hydroxide) in this study, used Iranian-made it was available in the market; It is a white powder whose chemical composition is shown in Table 4.
Table 4. Chemical composition of lime
|
Composition |
Percent |
|
CaCo3 MgCo3 Cao Mgo Sio2 Al2o3 Fe2o3 L.O.I |
89.4 1.12 44.3 1.37 11.88 4.1 3.2 35.5 |
Commercial grade is a clear dark brown liquid with a concentration of 43+2% and made in India by (SUKHA CHEMICAL INDUSTRIES MANUFACTURER). The amount of ferric chloride used in this study was between 0 to 2.5% by dry weight of soil with an increment of 0.5%. The properties of ferric chloride obtained from the importing company in Baghdad, are presented in (Table 5).
Table 5. Chemical composition of ferric chloride
|
Test |
Specification |
Result |
|
Appearance Assay (as FeCl3) Specific Gravity Insoluble Matter Free Acid (as HCL) Free Chlorine (as CL) Ferrous Salts (as Fecl3) Sulphates (as So4) Nitrates (as No3) Copper (as Cu) Zinc (as Zn) Arsenic (as As2O3) Alkalies & Alkaline earths |
Clear Dark Brown Liquid 43+2% 1.42-1.46 min 0.05% max 0.02% max 0.01% max 0.10% max 0.30% max 0.05% max 0.015% max 0.01% max 0.0002% max 0.20% max |
Complies 42.28% 1.435 0.025% 0.0177% 0.0051% Within Limits 0.223% 0.0083% 0.0020% 0.0062% 0.00013% 0.142% |
2.2 Methodology for determining optimum percentage
There are several recommendations and parameters suggested to determine the optimum percentage of chemical improvement and will be taken into account and laboratory verification of UCS values and PH test.
2.2.1 Cement
Depending on the Soil Cement Laboratory Handbook [11] obtaining the Group Index, the average percentage of cement in the soil was obtained from the table average cement requirement, and the value was 9% weight percentage of dry soil. Also from the other table was Cement Requirements of AASHTO Soil Groups also was 9% weight percentage of dry soil, while UCS at 7 days generally between 300psi (2068.4 kpa) and 800psi (5515.8 kpa).
Soil Stabilization with Portland Cement [12], this book reported the range for UCS at 7 days was from200psi (1378.9 kpa) to 400psi (2757.9 kpa).
Soil Stabilization for Pavement [13] referred to the minimum UCS for cement stabilized soils as 250psi (1723.68 kpa).
Also, An Introduction to Soil Stabilization with Portland Cement [14] recommended the Cement requirement for various soils, and the value for this soil was 9% of the dry weight.
2.2.2 Lime
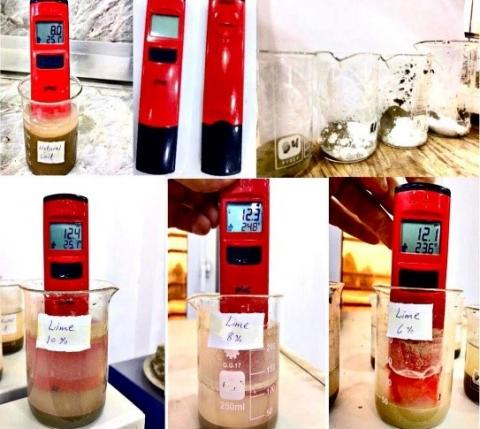
The PH measurement method (Eades and Grim in 1963 method) [15] was used to determine the optimum percentage of Lime, many researchers [15-18] referred to using this method by mixing lime and soil with distilled water and placing in a temperature bath to obtain a constant temperature of (25℃). The optimum ratio at which a mixture obtains PH is 12.4 or more at a temperature (25℃+2).
According to UCS determined by Standard specification for road works at 7 days is not less than 1.0 N/mm² (1000 kpa), This value will be checked in order to conform to this specification [19].
2.2.3 Fecl3
Many researcher works have been done to improve soils by Ferric chloride [7, 9, 20-24]. During their review, it was found that the UCS test is appropriate to determine the optimum percentage, and after that percentage, the UCS value will decrease.
The soil sample was passed through Sieve No. 4 after it was crushed with a hand hammer. All series of tests conducted on the collected samples (treated and untreated) were carried out based on the American Standards for Materials and Testing (ASTM) specifications as follows:
3.1 The hydrometer test
One of the most important engineering properties to classify the clay soil, its importance comes in knowing the type of soil you are working with, and the test was conducted in compliance with ASTM D 422-63 [25].
3.2 Initial water content
This test was carried out by ASTM D 4643-00 [26] for the natural soil.
3.3 Specific gravity of soil
The Specific Gravity test was carried out as per ASTM D 854-14 specification [27].
3.4 Atterberg limits
Atterberg limits are describing the state of the soil based on the amount of water in it. The samples passing through Sieve No. 4 were collected and the tests (liquid limit and plastic limit) were conducted on the natural soil by ASTM D 4318-00 [28].
3.5 Modify proctor test
Following ASTM D 1557-12 [29], the modify proctor was used to measuring the dry density of each sample and to obtain the moisture content as well.
This test is conducted for both the natural as well as the treated soil samples with optimum percentage for Cement, Lime, and Ferric chloride.
3.6 Unconfined compression strength of soil (UCS)
Depending on ASTM D2166-00 [30], the test was carried out on natural soil by molded with a diameter of 30.5 mm and a height of 71 mm to the maximum dry density and moisture content of the natural soil, and then it was extruded from the mold and placed in the unconfined compressive testing device, for curing purposes, the Cement, Lime, and Ferric chloride treated soil, samples were prepared as previously mentioned and wrapped in plastic bags and kept to be tested after1, 7, and 14 days.
3.7 California bearing ratio test (CBR)
Using a standard CBR mold with a diameter of 6 inches (152.4 mm) and a height of 7 inches 177.8 mm (177.8 mm) and compacted to MDD at OMC determined from the modify proctor of the natural soil for testing according to ASTM D 1883-07 [31] for untreated soil and treated with the optimum percentages of Cement, Lime, and Ferric chloride.
With treatment for 7 days in a plastic bag, and then soaking it with water for 4 days and conducting the test in a CBR device.
3.8 PH test method
According to the ASTM D 6276 method (2006) [32], determining the optimum lime requirements of soil are determined at a pH value of 12.4 at a temperature of 25℃.
4.1 UCS and PH tests
UCS tests were conducted by adding percentages of improvers to determine the optimum percentage that is suitable in the city of Al-Nasiriya.
Where an increase in UCS was observed with an increase in the percentage of improvement for Cement and Lime, while it was the opposite for Fecl3 where after the optimum value the UCS decreases.
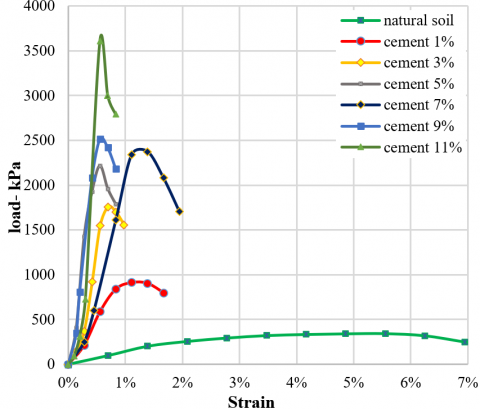
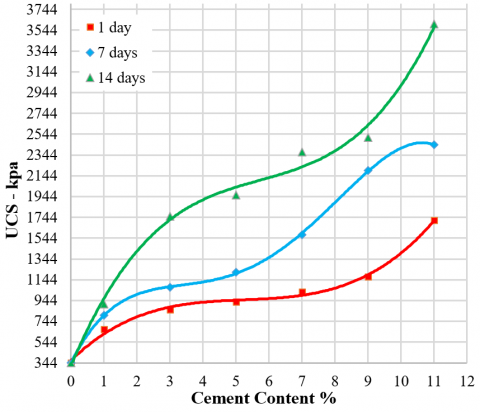
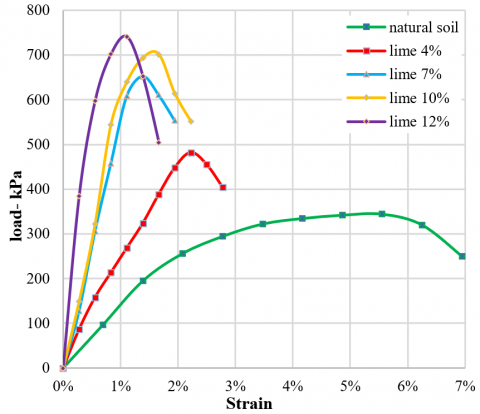
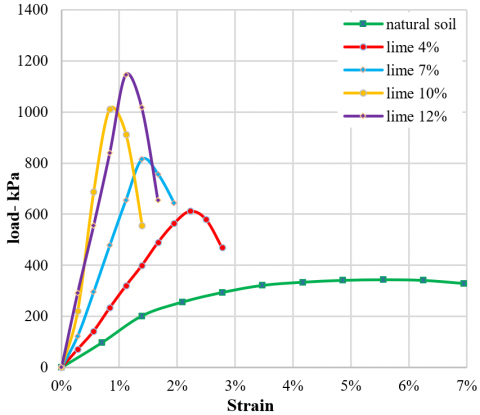
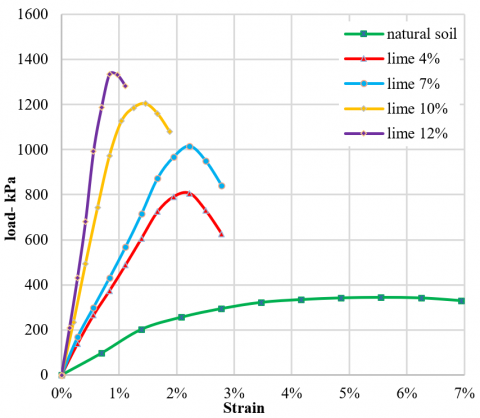
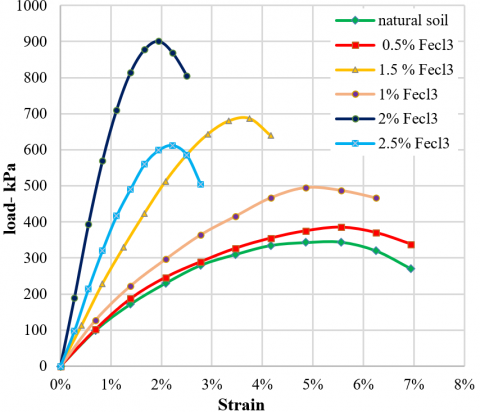
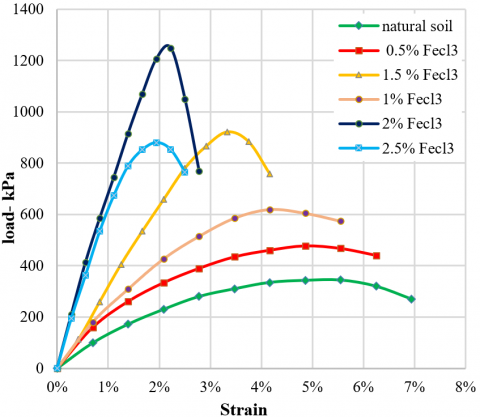
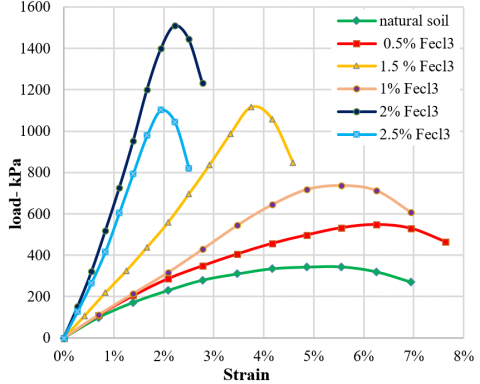
The curing periods give an increase in the value of UCS at 1, 7, 14 days for all material additives, all these results are shown in Table 6, and also for Figures 5 to 8, Figures 9 to 12, and Figures 13 to 16 shows the effect on UCS with adding Cement, Lime, and Fecl3 respectively.
After obtaining the values of UCS, the percentage of Cement was determined 9% as the optimum percentage that is suitable for the soil of the city of Al-Nasiriya.
For Lime, a PH test was conducted and a value of 10% was obtained as an optimum percentage after getting the PH=12.4 at 25℃ was obtained as shown in Figure 17 and results in Table 7, While the UCS value was checked.
Also according to Fecl3 the highest value of UCS was reached at 2% of the Fecl3 adding, and then this value decreased. Accordingly, 2% of the dry soil weight was named as the optimum percentage.
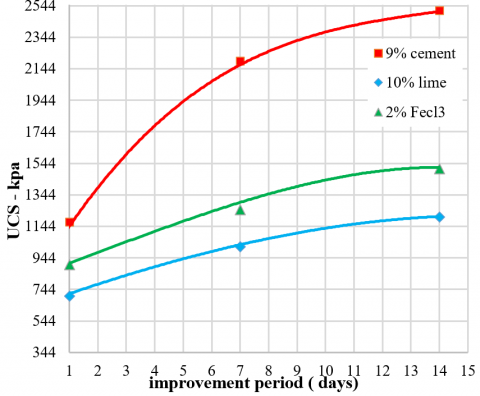
Figure 18 shows a comparison in the value of UCS at the optimum percentages of Cement, Lime, and Fecl3 as well as knowing the curing influence on the UCS for those values. And found that the curing period had the greatest effect on cement, which gave a high increase between 1 to 14 days.
The effects in Lime and Ferric chloride were less than in Cement and almost similar.
Table 6. Effect of cement, lime, and fecl3 with curing periods
|
Improver materials |
Percentage% |
Curing 1 day |
UCS (KN/m2) Curing 7 day |
Curing 14 day |
|
Cement |
0 1 3 5 7 9 11 |
344 667 855 931 1030 1171 1715 |
344 802 1069 1218 1578 2194 2443 |
344 912 1756 1958 2373 2514 3604 |
|
lime |
0 4 7 10 12 0 |
344 482 653 701 741 344 |
344 572 709 1013 1147 344 |
344 805 1015 1203 1335 344 |
|
Fecl3 |
0.5 1 1.5 2 2.5 |
385 495 687 901 612 |
478 620 923 1249 881 |
548 737 1116 1510 1102 |
Figure 5. Effect of the cement added on the UCS at 1 day
Figure 6. Effect of the cement added on the UCS at 7 day
Figure 7. Effect of the cement added on the UCS at 14 day
Figure 8. Effect of the cement added with curing periods
Figure 9. Effect of the lime added on the UCS at 1 day
Figure 10. Effect of the lime added on the UCS at 7 day
Figure 11. Effect of the lime added on the UCS at 14 day
Figure 12. Effect of the lime added with curing periods
Figure 13. Effect of the Fecl3 added on the UCS at 1 day
Figure 14. Effect of the Fecl3 added on the UCS at 7 day
Figure 15. Effect of the Fecl3 added on the UCS at 14 day
Figure 16. Effect of the Fecl3 added with curing periods
Figure 17. Measure the pH to determine the optimum percentage of Lime
Figure 18. Curing influence on the UCS for optimum additives
Table 7. Measurement of the PH values of the samples
|
Lime percentage% |
PH reading |
Temperature ℃ |
|
0%, (Natural soil) 6% 8% 10% |
8.0 12.1 12.3 12.4 |
25.1 23.6 24.8 25.1 |
4.2 California bearing ratio test and swelling
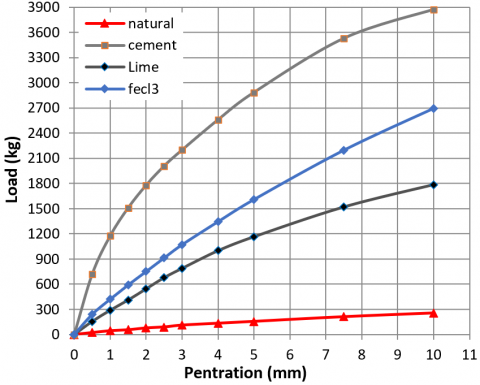
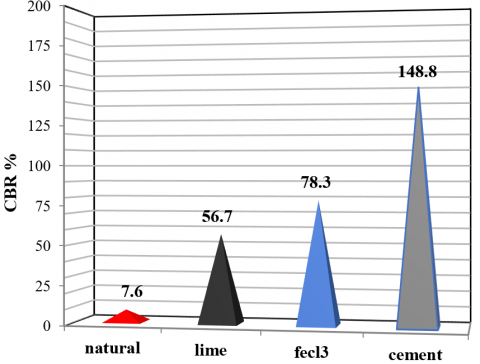
After determining the optimum percentages of the additives used in soil improvement. Where the CBR test was conducted for those ratios of Cement, Lime, and Ferric chloride, as shown in Figures 19 and 20, The results after curing for 7 days and soaking for 4 days showed that Cement gave the highest value among those materials, followed by Ferric chloride and the last was Lime, which gave good results compared to the value of natural soil.
Figure 19. CBR test for optimum chemical additives
Figure 20. CBR values for optimum chemical additives
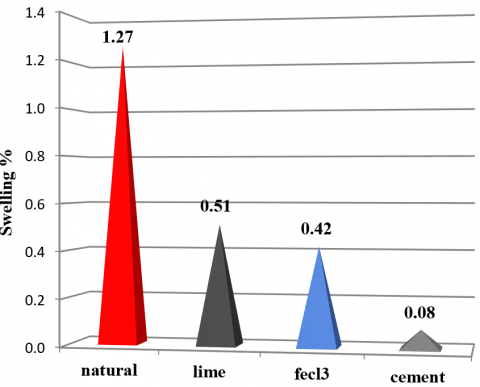
Figure 21. Swelling values for optimum chemical additives
Also, the percentage of swelling was measured during the period of soaking the mold with water. The test was carried out on natural soil (it was 1.27), then the optimum proportions of additives were added, and a reduction in the swelling percentage was observed.
The highest improvement rate was for Cement (it was 0.08%), followed by Ferric chloride (it was 0.42%), then Lime (it was 0.51%). All these results are shown in Figure 21.
4.3 Modify proctor test
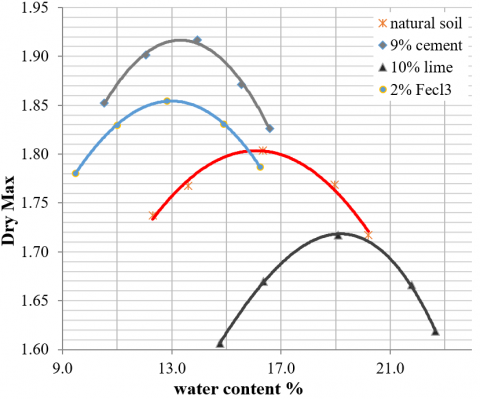
The compaction tests of the samples were conducted after adding the improver materials and the results shown in Table 8 and Figure 22 were obtained.
The results of Cement and Ferric Chloride were similar (with different values) where it was observed increase in (MDD and a decrease in OMC).
Which increased MDD from 1.804 to 1.92 and 1.85 and decreased OMC% from 16.3 to 13.9 and 128 respectively), in contrast to the behavior of the material Lime where the MDD decreased and the OMC% increased) which decreased MDD from 1.804 to 1.72 and the OMC% increased from 16.3 to 19.1).
Table 8. The MDD and OMC of natural soil and with optimum chemical additives
|
Additives |
OMC% |
MDD (g/cm3) |
|
Natural soil Cement Lime Fecl3 |
16.3 13.9 19.1 12.8 |
1.80 1.92 1.72 1.85 |
Figure 22. Compaction for optimum chemical additives
Depending on the test results obtained from the addition of cement, lime, and Fecl3, the following was concluded.
(1) According to the UCS test and after obtaining the optimum and economical percentages of Cement, Lime, and Fecl3 and which are suitable for the soil of Al-Nasiriya soil. An increase in UCS values was observed by about (340%, 638% and 731%), (204%, 294% and 350%) and (262%, 363 and 439%) at curing periods (1, 7, and 14), respectively. These results are consistent with the findings of the researchers Etim et al. [6] and Koteswara Rao et al. [7].
(2) CBR tests increased by about) 1968%, 750%, and 1036% (with the addition of optimum percentages of (Cement, Lime, and Fecl3), respectively, these results are consistent with the findings of the researchers Sarsam et al. [5], Bharambe and Patil [9].
(3) The percentages of swelling that occurred in the natural soil decreased by about (1588%, 249%, and 302%) When adding the optimum percentages of (Cement, Lime, and Fecl3), respectively, the results of this research paper are consistent with previous findings by Koteswara Rao et al. [7], and Etim et al. [6].
(4) The compaction tests give an impression of the behavior of materials by changing MMD and OMC as observed when adding Cement and Ferric chloride in optimum percentages leads to an increase in the MDD with a decrease in OMC, while the opposite happens when you add Lime to the soil.
[1] Abhiram, K., Mounika, G., Kumar, A.S. (2021). Experimental study on the strength of subgrade layer of road pavement by CBR method. International Journal of Research Publication and Reviews, 2(8): 1578-1590.
[2] Chen, F.H. (2012). Foundations on Expansive Soils. Elsevier.
[3] Thamer, L., Shaia, H. (2021). The effect of geotextile layers and configuration on soil bearing capacity. Mathematical Modelling of Engineering Problems, 8(6): 897-904. https://doi.org/10.18280/mmep.080608
[4] Ho, T.O., Chen, W.B., Yin, J.H., Wu, P.C., Tsang, D.C. (2021). Stress-strain behaviour of cement-stabilized Hong Kong marine deposits. Construction and Building Materials, 274: 122103. https://doi.org/10.1016/j.conbuildmat.2020.122103
[5] Sarsam, S.I., Al Saidi, A.A., Al Taie, A. (2017). Influence of combined stabilization on the structural properties of subgrade soil. J. Geotech. Eng, 4(1): 13-24. https://doi.org/10.37591/joge.v4i1.3735
[6] Etim, R.K., Attah, I.C., Ekpo, D.U., Usanga, I.N. (2021). Evaluation on stabilization role of lime and cement in expansive black clay–oyster shell ash composite. Transportation Infrastructure Geotechnology, 1-35. https://doi.org/10.1007/s40515-021-00196-1
[7] Koteswara Rao, D., Anusha, M., Pranav, P.R.T. (2012). Effect of ferric chloride and rice husk ash in the stabilization of soil for the pavement subgrades. International Journal of Engineering Science & Advanced Technology, 2(2): 146-153.
[8] Srinivas, M., Raju, P. (2011). Field investigation of heave of chemically-stabilised expansive soil subgrades. Proceedings of Indian Geotechnical Conference, pp. 369-371.
[9] Bharambe, V.R., Patil, G.K. (2013). A study on stabilization of black cotton soil using ferric chloride. IOSR Journal of Mechanical and Civil Engineering, 10(1): 26-30. https://doi.org/10.9790/1684-1012630
[10] Kalinski, M.E. (2011). Soil Mechanics: Lab Manual (No. Ed. 2). John Wiley & Sons.
[11] PCA. (1992). Soil Cement Laboratory Handbook. Portland Cement Association, pp. 1-59.
[12] Davidson, D.T. (1961). Soil Stabilization with Cement. Iowa State University of Science and Technology.
[13] Guyer, J.P. (2015). An Introduction to Construction Methods for Soil Stabilized Pavements. CreateSpace Independent Publishing Platform.
[14] Guyer, J.P. (2018). An introduction to soil stabilization for pavements. https://www.google.com/books?hl=en&lr=&id=-EBKDwAAQBAJ&oi=fnd&pg=PA1&dq=soil+stabilization&ots=_85qWy0BzV&sig=6S0bvMFpmoIpEDmT9BSOwhW1dPM.
[15] Eades, J.L., Grim, R.E. (1966). A quick test to determine lime requirements for lime stabilization. Highway Research Record, 5(139): 61-72.
[16] Little, D.N., Nair, S. (2009). Recommended Practice for Stabilization of Subgrade Soils and Base Materials. Washington, DC: The National Academies Press. https://doi.org/10.17226/22999
[17] Rout, R.K., Ruttanapormakul, P., Valluru, S., Puppala, A.J. (2012). Resilient moduli behavior of lime-cement treated subgrade soils. In GeoCongress 2012: State of the Art and Practice in Geotechnical Engineering, pp. 1428-1437.
[18] Kavak, A., Akyarlı, A. (2007). A field application for lime stabilization. Environmental Geology, 51(6): 987-997. https://doi.org/10.1007/s00254-006-0368-0
[19] Raya, J.K. (2005). Standard Specification for Road Works; JKR/SPJ/rev2005; JKR: Kuala Lumpur, Malaysia.
[20] Ganesh, B. (2017). Study on effect of chemical stabilizing agents on strength and swelling properties of soils. International Journal of Engineering Technology Science and Research, 4(10): 480-498.
[21] Jandial, M., Gupta, S. (2020). Soil stabilization using ferric chloride. International Journal of Innovative Technology and Exploring Engineering (IJITEE), 10(9): 6176-6187. https://doi.org/10.35940/ijitee.h6785.069820
[22] Raju, G.P., Subramanyam, L., Babu, Y.S.G.G., Prasad, D.S.V. (2015). Influence of ferric chloride on strength and deformation characteristics of expansive soil sub grades in Konaseema region. International Journal of Innovative Research in Science, Engineering and Technology, 4(11): 11174-11180. https://doi.org/10.15680/IJIRSET.2015.0411042
[23] Mishra, B., Mishra, R.S. (2015). A study on stabilization of black cotton soil by use of fly ash, ferric chloride and stone dust. Int J Eng Sci, 5(10): 20-25.
[24] Kiran, B.M.N., Shivanarayana, Ch., Prasad, D.V.S. (2016). Stabilization of marine clay using ferric chloride and quarry dust. International Journal of Engineering Research and Development, 12(3): 1-9.
[25] ASTM D44263. (2007). Standard test method for particle-size analysis of soils. https://www.academia.edu/22026933/Standard_Test_Method_for_Particle_Size_Analysis_of_Soils_1.
[26] ASTM D4643-08. (2008). Standard Test Method for Determination of Water (Moisture) Content of Soil by Microwave Oven Heating. https://doi.org/10.1520/D4643-17
[27] ASTM D854-06. (2010). Standard test methods for specific gravity of soil solids by water pycnometer. https://doi.org/10.1520/D0854-02
[28] ASTM D4318-05. Standard test methods for liquid limit, plastic limit, and plasticity index of soils. ASTM International, West Conshohocken, PA. https://doi.org/10.1520/D4318-17
[29] Standard Test Methods for Laboratory Compaction Characteristics of Soil Using Modified Effort (56,000 Ft-lbf/ft3 (2,700 KN-m/m3)). https://doi.org/10.1520/D1557-09
[30] ASTM D2166. Standard test method for unconfined compressive strength of cohesive soil. Annual Book of ASTM standards, ASTM International, West Conshohocken, PA, USA. https://doi.org/10.1520/D2166-00
[31] Standard test method for CBR (California Bearing Ratio) of laboratory-compacted soils. Annual Book of ASTM Standards. ASTM International West Conshohocken, PA, 2007. https://doi.org/10.1520/D1883-07
[32] Standard test method for using pH to estimate the soil-lime proportion requirement for soil stabilization. West Conshohocken PA: ASTM International, 1999. https://doi.org/10.1520/D6276-19