Agus Arip Munawar*![]() | Devianti
| Devianti![]() | Mustaqimah
| Mustaqimah![]() | Maisaroh
| Maisaroh![]() | Basri A. Bakar
| Basri A. Bakar![]() | Idawanni
| Idawanni![]() | Yenni Yusriani
| Yenni Yusriani![]()
© 2025 The authors. This article is published by IIETA and is licensed under the CC BY 4.0 license (http://creativecommons.org/licenses/by/4.0/).
OPEN ACCESS
Presented work aimed to improve near infrared spectroscopic (NIRS) prediction models for rapid and simultaneous estimation of N, P, K, pH, Mg, and Ca contents in agricultural soils. We compared partial least square regression (PLSR) and support vector machine (SVM) approaches applied to multiplicative scatter correction (MSC) corrected spectral data. The results demonstrated that grid search optimized radial basis function (RBF) kernel SVM models consistently outperformed PLSR models for all soil nutrients analyzed. The SVM models achieved excellent predictive performance, with coefficient of determination (R2) and ratio of prediction to deviation (RPD) values from external prediction datasets as follows: N (R2= 0.83, RPD = 2.80), P (R2= 0.96, RPD = 4.33), K (R2= 0.91, RPD = 3.00), pH (R2= 0.96, RPD = 2.89), Mg (R2= 0.98, RPD = 4.34), and Ca (R2= 0.99, RPD = 4.99). These results indicate good to excellent predictive performance for simultaneous estimation of agricultural soil nutrients using optimized SVM-based NIRS models. This novel approach offers a rapid, non-destructive method with significant potential for improving precision agriculture and environmental monitoring by enhancing soil quality assessment.
NIRS, agriculture, food security
The interrelation of soil nutrients not only affects agricultural productivity but also plays a significant and important role in environmental sustainability. As we face the challenges of feeding a growing population, optimizing agricultural productivity while ensuring environmental sustainability has become important issue. Central to achieving such optimization is the understanding and management of soil quality [1], which is fundamentally dependent on various physicochemical properties. Among these, the concentrations of soil key macronutrients like nitrogen (N), phosphorus (P), and potassium (K), alongside the soil pH, magnesium (Mg), and calcium (Ca) contents, are critical for soil health and plant growth [1-3].
As a soil macronutrient, N is fundamental for amino acid, enzyme, and chlorophyll formation, while P is crucial for energy transfer in plants. On the other hand, K is vital for the regulation of stomatal opening and closing, which affects water use efficiency and disease resistance [3]. The availability of these nutrients in the soil, however, is heavily influenced by the soil's pH level, which can alter their solubility and hence bioavailability to plants. Further, Mg and Ca, though required in lesser quantities than the primary nutrients, are nonetheless essential. Magnesium serves as the central atom in the chlorophyll molecule and is critical for photosynthesis, while calcium is necessary for cell wall structure and stability, as well as normal cell division in plant roots and leaves [4, 5]. They play roles in structuring soil aggregates, affecting soil erosion and water infiltration rates. Adequate levels of these nutrients can enhance soil structure, ability to support microbial life, preventing runoff and erosion, and thereby reducing the loss of topsoil and nutrient leaching into waterways. Knowing and analyzing soil quality attributes in precision agricultural practices can ensure optimal plant growth and also contribute significantly to protect and enhance environmental health [5-7].
Near infrared spectroscopy (NIRS) offers a significant leap forward in the analysis of soil properties, including key nutrients like N, P, K, pH, Mg and Ca [8-13]. This technology stands out for its speed, nondestructive, environmental friendly and efficiency, allowing for almost instantaneous results, which contrasts sharply with the time consuming processes characteristic of traditional laboratory methods [14]. A major advantage of NIRS is its nondestructive nature, enabling repeated analyses of the same sample without alteration, an aspect that proves beneficial for longitudinal soil health monitoring. Moreover, the minimal sample preparation required and the ability to conduct comprehensive analyses of multiple soil properties simultaneously enhance its appeal [15].
Over the past few decades, researchers have explored the potential of NIRS for predicting a wide range of soil properties. Early studies focused primarily on organic matter and total carbon content [16], with subsequent research expanding to include macronutrients such as nitrogen, phosphorus, and potassium [3, 17]. These investigations have demonstrated the feasibility of using NIRS for rapid soil nutrient assessment, albeit with varying degrees of accuracy depending on the specific nutrient and soil type [18]. Despite NIRS brings about cost savings by reducing the need for expensive reagents and disposables, it does come with challenges, particularly in the model calibration to ensure accuracy across different soil types and conditions [3, 19]. The two most common calibration methods mainly used in NIRS practices are principal component regression (PCR) and partial least square regression (PLSR). They simplify the complexity of NIRS data by extracting latent variables that are most relevant to predicting soil properties [20]. These approaches not only ensure computational efficiency but also enhance the interpretability of the model, making them accessible for routine analytical purposes.
Recently, the development of machine learning is significantly increasing in NIRS applications for constructing calibration models. Support vector machine (SVM) is one of those machine learning algorithms to deal with complex and non-linear relationships between the spectral data and soil properties [21]. It operates by constructing a model that can predict soil attributes through the identification of the optimal hyperplane by tuning the SVM hyperparameters [22]. This capability allows SVMR to achieve high prediction accuracy in predictions even when the spectral dataset exhibits a significant degree of variability or nonlinearity. However, the performance of SVM can be sensitive to the choice of SVM kernel function and its hyperparameters, requiring more time to fine-tune compared to PLSR [23].
Recent studies have demonstrated the effectiveness of various machine learning algorithms in improving NIRS-based soil nutrient predictions. For instance, Xu et al. [1] optimized machine learning models for predicting soil pH and total P using visible and near-infrared reflectance spectroscopy, achieving high accuracy across diverse soil profiles. Similarly, Das et al. [2] employed partial least square regression-based machine learning models for soil organic carbon prediction, showcasing the potential of these advanced techniques in enhancing NIRS applications.
The integration of NIRS with machine learning has also proven effective for simultaneous estimation of multiple soil nutrients. Dos Santos et al. [3] successfully predicted carbon and nitrogen content in soils of Northeast Brazil using visible near-infrared (Vis-NIR) and mid-infrared (MIR) spectroscopy, demonstrating the versatility of spectroscopic methods when combined with advanced analytical techniques. While these studies have made significant strides, there remains a critical knowledge gap in the field. One significant gap in the literature is the limited focus on micronutrients and secondary macronutrients, such as magnesium (Mg) and calcium (Ca). While these elements play crucial roles in plant growth and development, they have received less attention in NIRS studies compared to primary macronutrients.
Additionally, the majority of existing research has concentrated on individual nutrients or a limited set of soil properties, with fewer studies addressing the simultaneous prediction of a comprehensive range of soil nutrients. Furthermore, the transferability and robustness of NIRS models across diverse soil types and environmental conditions remain areas of ongoing research. Many studies have focused on local or regional calibrations, leaving questions about the broader applicability of these models to different geographical areas and soil compositions.
While numerous recent studies have demonstrated the effectiveness of machine learning algorithms in enhancing NIRS-based soil nutrient predictions, several critical gaps remain unaddressed in the literature. Most previous works have concentrated primarily on the estimation of a narrow set of soil properties, typically focusing on individual macronutrients such as nitrogen, phosphorus, or potassium, rather than providing a simultaneous and comprehensive assessment of all key soil health indicators. There is a limited focus on secondary macronutrients and micronutrients, with elements such as magnesium (Mg) and calcium (Ca) receiving comparatively little attention, despite their importance for plant growth and soil structure.
Additionally, many studies utilize calibration models developed for specific local or regional soil types, and thus lack robust transferability and generalizability across diverse geographical areas and soil compositions. Variation in sample preparation methods and physical soil properties further complicates the application of these models to different contexts, raising concerns about their broader utility. The vast majority of reported models also rely on laboratory-based calibration, which, while accurate, may be impractical for rapid, on-site assessment or large-scale precision agriculture monitoring.
To address these limitations, the present study introduces a multi-nutrient calibration model built with optimized machine learning techniques, specifically advanced PLSR and SVM, and includes both macro- and micronutrients as well as soil pH. The modeling approach aims to enhance accuracy, robustness, and transferability by using a more diverse and comprehensive sample set, rigorous spectral preprocessing, and systematic grid search optimization, thereby paving the way for rapid, simultaneous soil health assessment suitable for precision agriculture and environmental protection applications
Our study aims to develop and evaluate NIRS-based prediction models for a comprehensive set of soil nutrients, including both macro- and micronutrients, as well as soil pH. By employing advanced machine learning techniques, specifically optimized partial least squares regression (PLSR) and support vector machine (SVM) models, we seek to improve the accuracy and reliability of soil nutrient predictions across a diverse range of soil samples. Through this research, we aim to contribute to the development of more sustainable precision agricultural practices by employing NIRS as a rapid and simultaneous analytical technique for soil quality assessment, thereby supporting enhanced crop productivity, soil health, and environmental protection.
Building on these identified gaps, the central hypothesis of this study is that advanced machine learning models—particularly grid search optimized support vector machines combined with robust spectral pre-processing—can yield significantly improved predictive accuracy and robustness for rapid, simultaneous estimation of multiple soil nutrients (N, P, K, pH, Mg, and Ca) from near infrared spectral data, compared to conventional chemometric methods.
Accordingly, the main research questions guiding this work are:
The novelty of our study lies in the comprehensive comparison of optimized PLSR and SVMR models for the simultaneous estimation of multiple soil nutrients (N, P, K, pH, Mg, and Ca) using NIRS. By focusing on these six essential soil parameters, our research addresses a broader spectrum of soil health indicators than many previous studies, which often limited their scope to one or two nutrients. Furthermore, our study contributes to the growing body of research on the application of machine learning in soil science. As highlighted by Zhao et al. [22], the interaction between various soil components, such as calcium, iron, and manganese, can significantly influence nutrient uptake in plants. Reported multi-nutrient approach in this work allows for a more comprehensive understanding of these complex soil dynamics. The optimization of SVM models using grid search, as employed in our study, addresses the challenge of model fine-tuning noted in previous research. This approach enhances the model's ability to capture non-linear relationships in soil spectral data, potentially leading to more accurate predictions across diverse soil types and conditions.
The potential implications presented in this study carry important implications for environmental sustainability and agricultural management. By enabling rapid, non-destructive, and simultaneous estimation of key soil nutrients using near infrared spectroscopy and advanced machine learning, the proposed approach supports more precise and data-driven decision-making in fertilizer management and soil health monitoring. This precision can reduce unnecessary fertilizer input, lower costs, and minimize the risk of nutrient runoff and leaching, thereby helping to mitigate soil and water pollution and supporting the long-term health of agroecosystems.
Furthermore, the ability to routinely and efficiently assess both macro- and secondary nutrients empowers farmers and land managers to implement site specific interventions that promote optimal crop nutrition, enhance yields, and preserve soil structure and biodiversity [24]. By contributing to sustainable intensification and resource efficient practices, these advances align with broader goals of sustainable agriculture and environmental stewardship.
2.1 Soil samples
The Topsoil samples from 5 cm, 10 cm, 15 cm and 20 cm depth were gathered from ten distinct rice-paddy fields and cropland locations in Aceh Province [20]. Soil samples were collected from ten distinct agricultural sites located across Aceh Province, Indonesia, including key rice-paddy fields and adjacent croplands within the districts of Aceh Besar, Pidie, Bireuen, North Aceh, East Aceh, Aceh Tamiang, South Aceh, West Aceh, Central Aceh, and Aceh Barat Daya. The selection of these sites was purposive and aimed to capture the region’s agroecological diversity, encompassing various soil textures (sandy loam to clay), different management histories, and a range of intensification practices typical for both lowland rice and upland cropping systems. Additional criteria included accessibility, documented land-use patterns, and the presence of representative farmers’ fields with ongoing agricultural activity at the time of sampling.
At each site, soil samples were collected both from paddy fields and nearby croplands in order to cover variability influenced by the cropping system. At each site, soil samples were procured from rice-paddy fields and from nearby croplands, resulting in a total of 120 bulk topsoil samples. To standardize the analysis, each sample was quartered to 150 g. Following collection, all soil samples were left to stabilize for a day, then air-dried for a week and sieved through a 2 mm nylon sieve to eliminate stones, insects, debris, pebbles, and other impurities. Subsequently, the soil samples underwent grinding in a mechanical agate grinder and were sifted through a 100-mesh sieve with a 0.150 mm diameter [25]. The bulk soil samples were uniformly mixed and divided into sub-samples for both spectral data acquisition and actual measurements of soil quality properties: N, P, K, pH, Mg and Ca.
Following collection, all soil samples were left to stabilize for a day and then air-dried for one week under controlled laboratory conditions, with ambient temperature maintained at 25–28℃ and relative humidity between 55–65%, to ensure gentle and uniform moisture removal without altering soil chemical properties. After air-drying, samples were sieved through a 2 mm nylon sieve to eliminate stones, insects, debris, pebbles, and other impurities.
2.2 NIR spectral data
Near infrared spectral data were obtained and recorded as diffuse reflectance spectra in the wavelength range of 1000-2500 nm using a benchtop NIR instrument (Thermo Nicolet Antaris II, Thermo Fisher Inc. Waltham, USA) with an integrating sphere accessory. The soil samples were placed in a cylindrical quartz cup sample holder with a depth of 10 mm to guarantee complete light penetration. Each cylindrical sample cup was filled with 20 g of soil samples, leveled carefully using a smooth edge, and rotated at a slow pace during the spectra acquisition process, combining 64 scans [20, 26]. The soil samples were distributed into two identical cups, each undergoing 64 scans, with the resulting spectra averaged to accommodate variations within the sample, as well as differences in packing density and particle size.
The soil samples were distributed into two identical quartz sample cups, with each cup undergoing 64 scans, and the resulting spectra were averaged for subsequent analyses. This approach was chosen to minimize sources of error arising from sample heterogeneity, such as variations in particle size distribution, packing density, or localized moisture content within the bulk soil. By scanning duplicate cups and averaging their spectra, the methodology ensures that random fluctuations or physical inconsistencies in the sampling process have a reduced effect on the final dataset, thereby enhancing the precision and representativeness of the measured spectral signature for each sample. This leads to more robust calibration and prediction models in subsequent chemometric analysis.
2.3 Actual N, P, K, pH, Mg and Ca measurements
Subsequent to the completion of spectra data acquisition, the soil quality parameters N, P, K, pH, Mg and Ca of soil samples were assessed and quantified by means of established chemical laboratory techniques. The nitrogen content in the soil was ascertained through the Kjeldahl method, involving digestion with H2SO4, and expressed as a percentage of its weight to the total weight of the dry soil sample [20, 27]. Similarly, the phosphorus content was determined by HClO4-H2SO4 heating extraction followed by a molybdenum blue colorimetric method [28].
Moreover, the potassium content was determined by calcination and subsequent extraction with NaOH, with the K content then quantified using an atomic absorption flame photometer. On a different note, the soil pH measurement entailed mixing soil and water at a 1:2.5 ratio, with assessment conducted through a glass electrode and an electronic pH meter. Calibration of the pH meter was facilitated by buffer solutions with pH values of 6.86 and 4.01 [29]. Additionally, magnesium and calcium content analyses in the soil samples were carried out through an acid digestion method employing an inductively coupled plasma absorption flame spectrophotometer. All chemical analyses for evaluating soil properties were performed in triplicate and the results were averaged for accuracy.
2.4 Spectra pre-processing
The acquired spectra data may potentially include extraneous background details and disturbances, which have the capacity to impact and distort crucial soil quality properties and other relevant attributes. Various sources of interference, like light scattering and random noise stemming from overheated sensors, instrumental components, and alterations in the physical properties of the sample, must be minimized or eliminated to ensure the development of precise, robust, and consistent calibration models [30]. Hence, the imperative practice involves the correction and refinement of spectra data prior to the construction of calibration models for enhanced accuracy and stability. NIR spectral data were corrected using multiplicative scatter correction (MSC) [31, 32]. It is used to compensate for additive and multiplicative effects in the spectral data caused by physical effects. It also attempted to remove the effects of scattering by linearizing each spectrum to an ideal one of the spectra data, which corresponds to the average spectrum.
Multiplicative scatter correction (MSC) was applied to each raw NIR spectrum prior to calibration modeling to correct for additive and multiplicative scattering effects caused by physical variations in the soil samples, like particle size, and packing density. Specifically, the MSC preprocessing was carried out in MATLAB R2023a (MathWorks Inc., Natick, MA, USA) using built-in chemometric toolboxes. For each spectrum, MSC involved regressing the raw spectrum against the mean spectrum of the entire dataset, subsequently subtracting the calculated offset and dividing by the slope to normalize both the baseline and scaling effects. This process yielded standardized spectra where the variance more accurately reflected chemical composition, providing more reliable input for subsequent machine learning calibration and prediction model.
2.5 Calibration and prediction
The main part of NIRS applications is to establish prediction models used to determine soil quality parameters N, P, K, pH, Mg and Ca through a process called calibration. A total of 120 datasets containing NIR spectral data and actual reference soil quality parameters data were divided onto calibration (80) and validation (40) dataset by means of systematic sampling based on a property (SSBP) approach [33]. This was performed to balance between having enough samples for building a robust calibration models and retaining a considerable number for an unbiased evaluation of its predictive performances.
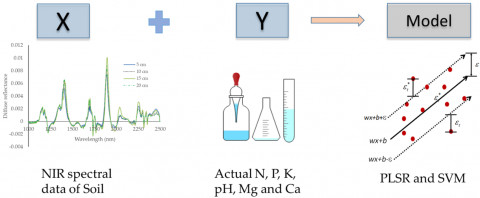
The PLSR and SVMR methods were then applied in NIRS calibration to develop the N, P, K, pH, Mg and Ca calibration models using 80 samples from calibration dataset as illustrated in Figure 1. The models were established between NIR spectra data of soil samples as X-variable and actual reference N, P, K, pH, Mg and Ca measurement data as Y-variable in the calibration dataset. Other remaining 40 samples on validation set were used for external prediction to quantify and evaluate the performance of the NIRS calibration models.
Figure 1. Constructing calibration models to determine soil quality parameters using NIR spectral data with PLSR and SVM methods
PLSR and SVM were selected for NIRS calibration due to their distinct advantages in handling complex spectral data. PLSR effectively manages multicollinearity in spectral data, reduces dimensionality while maximizing covariance between spectra and soil properties, and provides interpretable results through latent variables. On the other hand, SVM proper in modeling non-linear relationships in spectral data, demonstrates robustness against outliers and noise, and performs effectively in high-dimensional spaces, making it particularly suitable for spectral analysis [34]. These methods offer superior performance compared to traditional regression techniques when dealing with the complex, high-dimensional data typical of NIRS, as they can capture intricate patterns and relationships within the spectral data that are crucial for accurate soil nutrient predictions.
Hyperparameters on SVM, namely C, Gamma and Epsilon were optimized in radial basis function SVM kernel using grid search optimization (GSO). It is a systematic approach to fine-tune the model's performance which involves defining ranges for key parameters: C (penalty factor), Gamma (kernel coefficient), and Epsilon (margin of tolerance) [33, 35]. The process then systematically evaluates various combinations of these parameters using cross-validation to identify the optimal configuration. This method enhances model performance by striking a balance between complexity and generalization, adjusting the influence of individual training samples on the decision boundary, and fine-tuning error tolerance to accommodate data noise. By exhaustively searching the parameter space, GSO ensures the selection of the most effective combination, resulting in SVM models with improved accuracy and robustness for soil nutrient prediction across diverse soil compositions [36]. This optimization technique is particularly valuable in spectroscopic applications, where the relationship between spectral data and soil properties can be complex and nonlinear.
The parameter denoted as C, often referred to as the capacity factor or penalty factor, serves as an indicator of the model's robustness. It is imperative that the C parameter holds a value greater than 0 to ensure model stability [37, 38]. On the other hand, the parameter called Gamma (γ) acts as a kernel parameter that determines the extent to which the influence of training samples extends. A high value of gamma signifies a significant influence over neighboring samples, potentially leading to heightened prediction accuracy but with a tendency towards bias. Conversely, a low gamma value indicates a more balanced influence, offering less biased results.
In the context of a radial basis function kernel, it becomes essential to optimize both the C and gamma parameters concurrently. When gamma is escalated, the impact of C diminishes in significance. Conversely, if gamma is set at a lower value, the influence of C on the model mirrors that of a linear model. Additionally, the epsilon (ε) parameter defines the margin of tolerance within which errors are not penalized. This parameter plays a crucial role in fine tuning the model's flexibility and adaptability to the data by allowing a certain degree of error tolerance [33, 37, 38].
The performance of the prediction models in determining N, P, K, pH, Mg and Ca was quantified and evaluated based on calibration and validation results according to the coefficient of determination (R2) and correlation coefficient (r) in calibration and external validation, the root mean square error of calibration (RMSEC) and prediction (RMSEP), and the ratio of prediction to deviation (RPD) index [36, 38]. The RPD ranging from 1.5 to 1.9 suggests that a rough quantitative prediction is feasible, although some refinement in calibration is required. A value falling between 2 and 2.5 indicates that the prediction model is adequate. Furthermore, an RPD value of 2.5 to 3, and higher than 3 signifies good and excellent prediction accuracy, respectively [14, 39, 40].
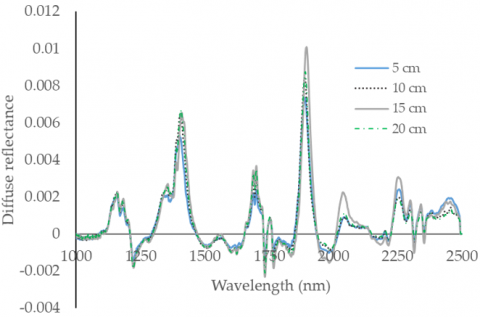
The NIR spectra features and characteristics of soil samples retrieved from varying depths, at 5 cm, 10 cm, 15 cm, and 20 cm is presented in Figure 2. By analyzing the spectral data in relation to soil quality properties, correlations can be drawn between the specific features observed in the spectra and the levels of N, P, K, pH, Mg, and Ca in the soil samples.
Figure 2. NIR spectra features of soil samples retrieved from varying depths, at 5 cm, 10 cm, 15 cm, and 20 cm
At a shallower depth of 5 cm, soil samples may exhibit spectral patterns influenced more strongly by surface properties such as organic matter content, vegetation residue, and surface compaction. This depth often reflects recent soil disturbances and biological activity, leading to distinctive spectral features related to surface organic materials and microbial presence as also in agreement with other research findings [40, 41]. Moving to a depth of 10 cm, the NIR spectral characteristics may start to reveal a transition zone between the surface and subsurface soil properties. Here, changes in mineral content, soil structure, and root activity can manifest in the spectra, providing information on underlying soil properties and potential nutrient availability.
Furthermore, at 15 cm depth, the spectral features of soil samples are likely to capture a balance between surface influences and deeper soil characteristics. Spectral signatures may indicate variations in soil texture, moisture levels, and nutrient distribution within this mid-depth range, offering a comprehensive view of the soil profile, as also reported in the studies [38, 39]. Deeper soil samples from 20 cm are expected to showcase spectral attributes that reflect deeper rooted influences such as mineral accumulation, compaction, and water retention capacity. Near infrared spectral patterns at this depth may emphasize characteristics related to soil structure, porosity, and potential subsoil nutrient dynamics.
Certain spectral patterns in the NIR spectra may indicate organic matter content, which was linked to the nitrogen content in the soil. Higher levels of nitrogen often correspond to distinct spectral features related to organic nitrogen compounds present in the soil. Spectral bands around 1510-1700 nm and 2100-2200 nm are often associated with N content in soil, representing vibrations of N containing compounds such as organic nitrogen compounds. Phosphorus content in soil was associated to spectral features in the range of 1060-1210 nm and 2150-2250 nm, corresponding to interactions with phosphate minerals and organic and inorganic phosphorus compounds. Potassium K content can also be associated with NIR spectral features in the region of 2100-2200 nm, reflecting the presence and interactions of K ions with soil minerals and organic matter.
Soil pH, which influences nutrient availability, can be associated with spectral characteristics in the NIR region, where variations in pH levels may manifest in spectral bands around 1400-1450 nm and 1910-1970 nm, reflecting soil acidity or alkalinity. Similarly, Mg content in soil was reflected in NIR spectral bands around 1390-1440 nm and 1950-2100 nm, corresponding to chemical forms and interactions of magnesium compounds in the soil matrix. Meanwhile, Ca content in the soil was associated to NIR spectral features at around 2150-2250 nm and 2300-2400 nm, representing interactions of Ca compounds within the soil aggregate and their chemical properties.
3.1 Enhanced NIRS models by means of machine learning approaches
Predictive models for estimating soil nutrients were developed using a calibration dataset through different machine learning approaches: PLSR and SVM. Subsequently, these models were tested and evaluated using an external prediction set to ensure their robustness. The descriptive statistics for actual soil nitrogen (N), phosphorus (P), potassium (K), pH, magnesium (Mg), and calcium (Ca) contents across both the calibration and prediction datasets are presented in Tables 1 and 2.
Prior to calibration model development, spectral data were pre-processed and corrected using multiplicative scatter correction (MSC). It is used to standardize the soil spectrum from the intrinsic effect and heterogeneity of soil, characterized by variations in particle size, organic content, and moisture levels, which can obscure the chemical signals pertinent to these essential soil properties. MSC adeptly mitigates these effects by normalizing the spectral data, thereby ensuring that the variance within the dataset predominantly reflects chemical differences rather than physical disparities [34]. This spectra pre-processing is important for the calibration of predictive models, as it ensures that the input data accurately represent the soil’s chemical composition, and thus enables models to more precisely correlate specific spectral features with N, P, K, pH, Mg and Ca concentrations. Moreover, by standardizing spectra from diverse soil samples, MSC enhances the robustness and transferability of these models across different sample sets and conditions.
Table 1. Leaf Descriptive statistics of actual soil nutrients from calibration set (n=80)
|
Descriptive Stats. |
N (%) |
P (ppm) |
K (cmol.kg-1) |
pH (KCl) |
Mg (cmol.kg-1) |
Ca (cmol.kg-1) |
|
Mean |
0.22 |
17.02 |
0.75 |
5.53 |
5.78 |
9.19 |
|
Max |
0.59 |
45.15 |
1.74 |
10.27 |
17.01 |
22.22 |
|
Min |
0.02 |
3.56 |
0.17 |
2.59 |
0.31 |
0.39 |
|
Range |
0.57 |
41.59 |
1.57 |
7.68 |
16.70 |
21.83 |
|
Std. Deviation |
0.16 |
9.19 |
0.39 |
1.94 |
4.47 |
6.04 |
|
Variance |
0.03 |
84.44 |
0.15 |
3.78 |
19.96 |
36.50 |
|
RMS |
0.27 |
19.31 |
0.84 |
5.86 |
7.29 |
10.98 |
|
Skewness |
0.69 |
0.84 |
0.87 |
0.98 |
0.82 |
0.56 |
|
Median |
0.19 |
14.14 |
0.68 |
5.15 |
4.16 |
7.82 |
|
Q1 |
0.07 |
10.28 |
0.48 |
4.25 |
2.55 |
4.23 |
|
Q3 |
0.35 |
24.22 |
0.90 |
6.29 |
9.22 |
13.93 |
Table 2. Descriptive statistics of actual soil nutrients from prediction set (n=40)
|
Descriptive Stats. |
N (%) |
P (ppm) |
K (cmol.kg-1) |
pH (KCl) |
Mg (cmol.kg-1) |
Ca (cmol.kg-1) |
|
Mean |
0.25 |
16.34 |
0.76 |
5.33 |
4.89 |
7.58 |
|
Max |
0.52 |
43.95 |
1.67 |
10.21 |
14.72 |
18.24 |
|
Min |
0.04 |
4.12 |
0.18 |
2.57 |
0.79 |
0.74 |
|
Range |
0.49 |
39.83 |
1.49 |
7.64 |
13.93 |
17.50 |
|
Std. Deviation |
0.14 |
10.70 |
0.42 |
1.59 |
3.21 |
4.66 |
|
Variance |
0.02 |
114.39 |
0.18 |
2.54 |
10.32 |
21.67 |
|
RMS |
0.28 |
19.46 |
0.87 |
5.56 |
5.83 |
8.87 |
|
Skewness |
0.33 |
1.18 |
0.55 |
1.31 |
0.97 |
0.49 |
|
Median |
0.23 |
12.77 |
0.64 |
5.15 |
3.94 |
6.50 |
|
Q1 |
0.12 |
8.82 |
0.40 |
4.32 |
2.62 |
3.81 |
|
Q3 |
0.35 |
22.29 |
1.12 |
6.07 |
6.76 |
10.37 |
To simultaneously estimate soil nutrients, NIRS calibration was performed using PLSR optimized by 10-fold cross validation and grid search optimized RBF SVM to yield reliable predictive performances. Table 3 presents calibration and external prediction results of soil samples. The key metrics included in the table are the coefficient of determination (R2), correlation coefficient (r), root mean square error of calibration (RMSEC), root mean square error of prediction (RMSEP), and the ratio of prediction to deviation (RPD).
Table 3. Prediction performance of PLSR and SVM for N, P, K, pH, Mg and Ca estimation
|
Soil Nutrients |
Method |
Calibration |
Validation |
|||||
|
R2 |
r |
RMSEC |
R2 |
r |
RMSEP |
RPD |
||
|
N (%) |
PLSR |
0.76 |
0.87 |
0.08 |
0.75 |
0.87 |
0.08 |
1.75 |
|
SVM |
0.83 |
0.91 |
0.05 |
0.83 |
0.91 |
0.05 |
2.80 |
|
|
P (ppm) |
PLSR |
0.95 |
0.97 |
2.62 |
0.93 |
0.96 |
2.69 |
3.98 |
|
SVM |
0.97 |
0.98 |
2.24 |
0.96 |
0.98 |
2.47 |
4.33 |
|
|
K (cmol.kg-1) |
PLSR |
0.88 |
0.94 |
0.16 |
0.86 |
0.93 |
0.19 |
2.21 |
|
SVM |
0.93 |
0.96 |
0.12 |
0.91 |
0.95 |
0.14 |
3.00 |
|
|
pH (KCl) |
PLSR |
0.94 |
0.97 |
0.58 |
0.92 |
0.96 |
0.61 |
2.61 |
|
SVM |
0.97 |
0.98 |
0.53 |
0.96 |
0.98 |
0.55 |
2.89 |
|
|
Mg (cmol.kg-1) |
PLSR |
0.98 |
0.99 |
0.82 |
0.96 |
0.98 |
0.87 |
3.69 |
|
SVM |
0.98 |
0.99 |
0.73 |
0.98 |
0.99 |
0.74 |
4.34 |
|
|
Ca (cmol.kg-1) |
PLSR |
0.98 |
0.99 |
1.21 |
0.97 |
0.98 |
1.26 |
4.79 |
|
SVM |
0.99 |
0.99 |
1.06 |
0.99 |
0.99 |
1.21 |
4.99 |
|
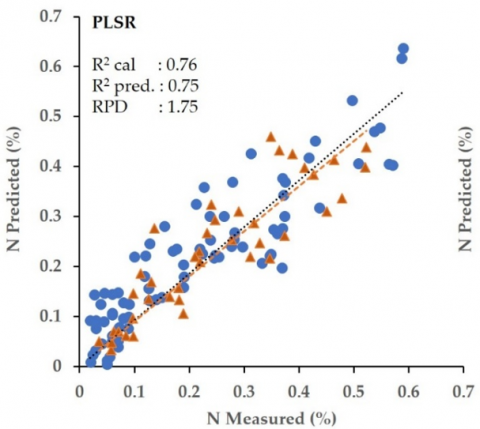
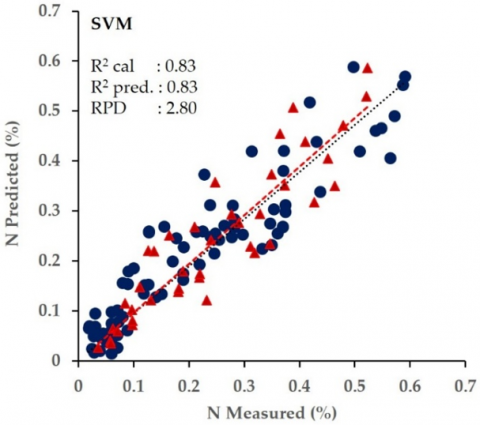
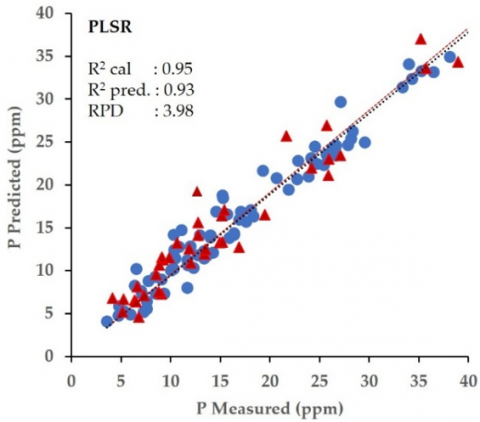
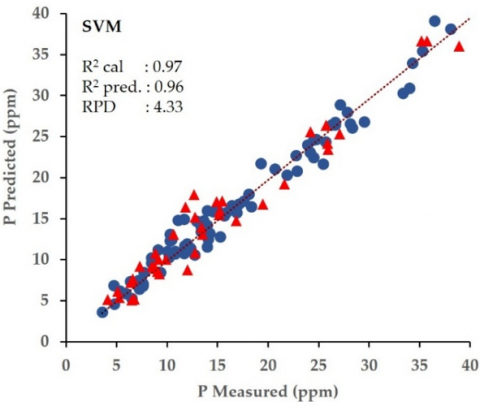
For soil N estimation, both PLSR and SVM models exhibit strong predictive capabilities, with SVM outperforming PLSR slightly in terms of R2, r, and RPD. Similarly, for P prediction, both methods yield high R2 values, indicating significant explanatory power in capturing P concentration variability. The SVM model shows a slight improvement over PLSR in terms of RPD for P estimation. A scatter plot derived for N and P estimation using PLSR and SVM approaches during calibration and validation is presented in Figure 3.
Figure 3. N and P estimation by means of PLSR and SVM approaches
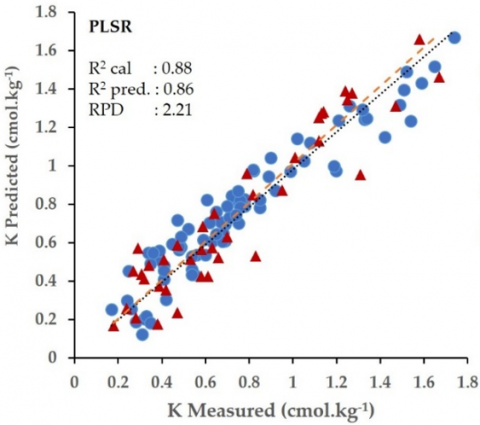
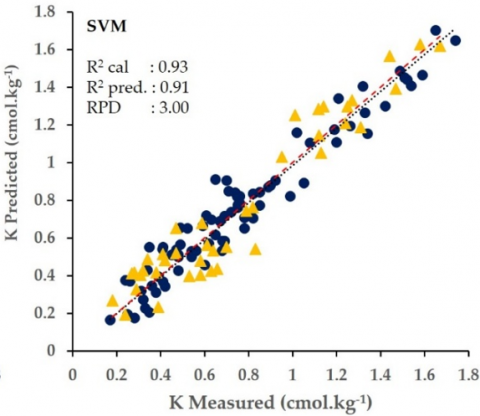
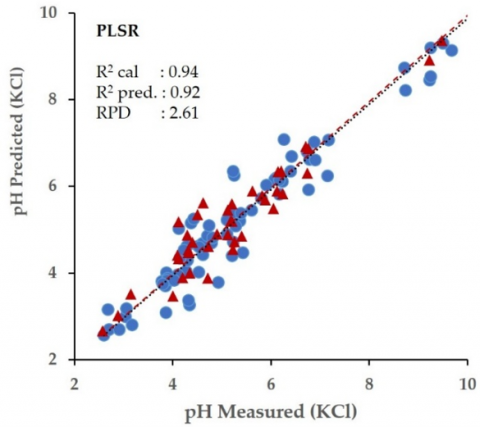
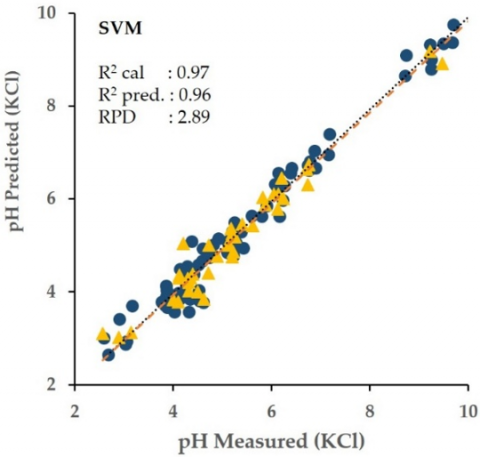
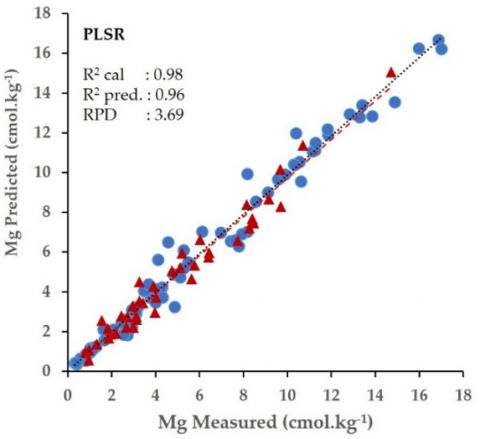
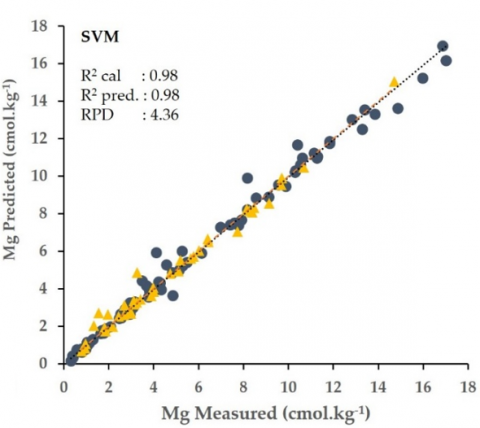
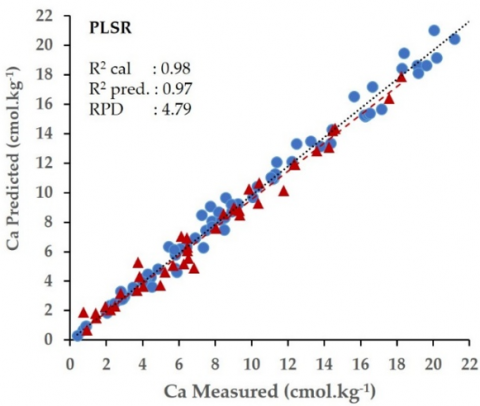
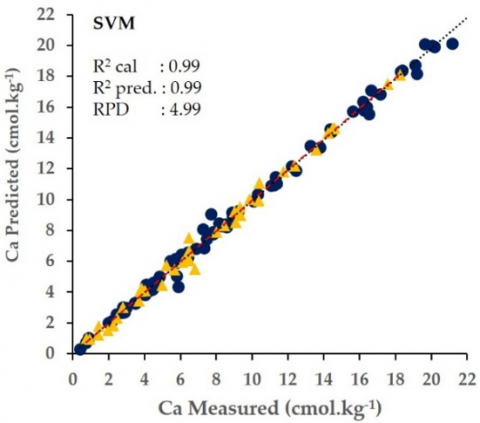
Moreover, for soil K and pH prediction, as shown in Figure 4, both PLSR and SVM models demonstrate good predictive accuracy, with SVM models consistently showing a bit higher R2 values both in calibration and prediction. This trend is also observed for Mg and Ca estimation (Figure 5), where both methods generate strong models, but SVM shows slightly superior performance in terms of RPD for these soil nutrients. These results also agree with other reported works that SVM performed better prediction results than PLSR [33, 35, 38]. The prediction performance results suggest that SVM models generally outperform PLSR models in terms of prediction accuracy and robustness for all soil nutrients analyzed. The higher R2 values, stronger correlations r, and improved RPD indexes indicate that optimized SVM method offers more accurate and reliable predictions for N, P, K, pH, Mg, and Ca contents in soil samples. It is evident that employing SVM for NIRS calibration provides enhanced estimation results for a range of crucial soil nutrients, suggesting its accuracy for soil nutrient analysis applications.
The superior performance of SVM as a machine learning approach over PLSR in this particular case can be attributed to several key factors. One primary reason for SVM's outperformance lies in its inherent capability to capture nonlinear relationships within the spectral data of soil samples more effectively than PLSR, which primarily relies on linear combinations of variables. Soil nutrient dynamics in NIRS data often exhibit complex and nonlinear patterns that SVM can model more accurately, leading to more precise predictions. Additionally, SVM is known for its robustness against outliers, enabling it to generate stable and reliable prediction models less affected by irregular data points present in soil nutrient datasets [8, 18, 35].
Furthermore, the grid search optimization (GSO) process within the RBF kernel for SVM aims to maximize the margin between data points in feature space, facilitating better generalization and classification capabilities. This optimization, along with the versatility of the RBF kernel functions available in SVM, allows for effective discrimination between different classes or precise prediction of continuous values within the intricate soil nutrient datasets. SVM's tuning regularization for C, Gamma and Epsilon mechanisms further prevent overfitting and enhance generalization to unseen data, contributing to the model's robust performance. In this work, the GSO optimization found the SVM tuning parameters C, Gamma and Epsilon for soil nutrients estimation are presented in Table 4.
Figure 4. K and pH estimation by means of PLSR and SVM approaches.
Figure 5. Mg and Ca estimation by means of PLSR and SVM approaches
The fine-tuning process of SVM using RBF kernel and GSO optimization plays an important role in these findings to enhance the accuracy of NIRS models. The regulation C parameter serves as a crucial regulation factor in SVM machine learning method, balancing the model's complexity and generalization ability. The specified C values found in this work reflect the trade-off between fitting data closely and preventing model overfitting. A higher C value for K and Mg estimation, as indicated in Table 4 above, suggests a focus on capturing intricate relationships within the training data in calibration set, potentially at the risk of being overly sensitive to noise or outliers, while a lower C value prioritizes smoother decision boundaries for better generalization to unseen data and further prediction of soil nutrients.
Table 4. SVM regulation parameters using GSO for soil nutrients estimation
|
Soil Nutrients |
SVM Regulation Parameters |
||
|
C |
Gamma |
Epsilon |
|
|
N (%) |
15.37 |
19.51 |
0.1 |
|
P (ppm) |
21.54 |
4.64 |
0.1 |
|
K (cmol.kg-1) |
100 |
6.08 |
0.1 |
|
pH (KCl) |
23.71 |
21.42 |
0.1 |
|
Mg (cmol.kg-1) |
100 |
4.38 |
0.1 |
|
Ca (cmol.kg-1) |
26.82 |
20.55 |
0.1 |
The SVM models demonstrated superior performance over PLSR across all analyzed soil nutrients, with varying degrees of improvement. For nitrogen (N) estimation, SVM achieved an R2 of 0.83 and RPD of 2.80, indicating good predictive performance. This improvement is particularly significant given the complex organic matter dynamics influencing soil N content. Phosphorus (P) prediction showed excellent results with an R2 of 0.96 and RPD of 4.33, crucial for precision agriculture due to P's impact on root development and energy transfer in plants. Potassium (K) estimation yielded very good performance with an R2 of 0.91 and RPD of 3.00, enabling precise management of K levels critical for plant water regulation and disease resistance. The SVM model for pH achieved an R2 of 0.96 and RPD of 2.89, slightly outperforming recent studies, which is essential as pH influences nutrient availability and microbial activity. Notably, SVM showed outstanding performance for secondary macronutrients, with Magnesium (Mg) achieving an R2 of 0.98 and RPD of 4.34, and Calcium (Ca) reaching an R2 of 0.99 and RPD of 4.99. These results represent a significant improvement in predicting these important nutrients for photosynthesis and cell wall structure.
The consistent superiority of SVM across all nutrients underscores its effectiveness in capturing complex, non-linear relationships in soil spectral data, potentially revolutionizing rapid, non-destructive soil nutrient analysis for precision agriculture and environmental management. As comparisons with other reported works by researchers (Table 5), our obtained NIRS predictive performance reveals the superior performance of our NIRS-SVMR approach across a comprehensive range of soil nutrients. Our study consistently achieves high R2 values (0.83-0.99) for all six nutrients examined (N, P, K, pH, Mg, Ca), outperforming or matching the best results from other recent studies.
Table 5. Comparisons of NIRS prediction performance for soil nutrients with previous studies
|
Study |
Method |
R2 |
|||||
|
N |
P |
K |
pH |
Mg |
Ca |
||
|
Our study |
NIRS (SVMR) |
0.83 |
0.96 |
0.91 |
0.96 |
0.98 |
0.99 |
|
Xu et al. [1] |
VNIR (SVMR) |
- |
0.89 |
- |
0.92 |
- |
- |
|
Das et al. [2] |
Vis-NIR (PLSR) |
0.78 |
- |
- |
- |
- |
- |
|
Dos Santos et al. [3] |
Vis-NIR/MIR |
0.81 |
- |
- |
- |
- |
- |
|
Singha et al. [41] |
VIs-NIR (PLSR) |
0.82 |
0.71 |
- |
- |
- |
- |
|
Singha et al. [41] |
VIs-NIR (SVMR) |
0.89 |
0.72 |
0.91 |
0.65 |
- |
- |
This superior performance can be attributed to several factors: the use of optimized SVMR allows for better handling of non-linear relationships in spectral data, which is particularly advantageous for complex soil matrices. The ability of SVM to capture intricate patterns in high-dimensional data likely contributes to its effectiveness across diverse soil nutrients.
In terms of spectral range, NIRS covers a wider spectral range compared to some other methods like Vis-NIR, potentially capturing more informative spectral features related to various soil nutrients. This broader spectral information may enhance the model's predictive capabilities for a wider range of nutrients. Moreover, our study likely employs robust spectral preprocessing techniques, such as multiplicative scatter correction (MSC), which can significantly improve the signal-to-noise ratio and reduce the impact of physical sample variations.
The use of grid search optimization for SVM hyperparameters may have contributed to the model's superior performance by fine-tuning the algorithm for each specific nutrient prediction task. Our study also potentially utilizes a more comprehensive and diverse soil sample set, covering a wider range of soil types and nutrient concentrations. This diversity in the training data could enhance the model's generalizability and robustness. The simultaneous prediction of multiple nutrients may allow the model to capture complex interactions between different soil properties, potentially improving overall prediction accuracy. Novel application for unique contribution in predicting Mg and Ca with high accuracy fills a significant gap in the literature and demonstrates the versatility of the NIRS-SVMR approach for less commonly studied soil nutrients. These factors collectively contribute to the robust and versatile performance of our NIRS-SVMR method, positioning it as a promising approach for comprehensive soil nutrient analysis with potential applications in precision agriculture and environmental monitoring.
The improved prediction models developed in this study have significant practical implications for precision agriculture and soil management. By enabling rapid and simultaneous estimation of multiple nutrients (N, P, K, Mg, Ca) and pH, these models greatly enhance the efficiency of soil testing and mapping processes. The high accuracy achieved, particularly with the optimized SVM models, allows for precise fertilizer recommendations, potentially reducing over-application and mitigating associated environmental impacts such as nutrient runoff and groundwater contamination. The non-destructive nature of NIRS facilitates repeated measurements over time, enabling farmers and researchers to monitor temporal changes in soil nutrient status without altering the soil samples.
This feature is particularly valuable for long-term studies on soil health and crop rotation effects. Integration of these models into precision agriculture systems could support real-time, site-specific nutrient management decisions, allowing farmers to adjust fertilizer applications based on current soil conditions rather than relying on historical data or broad recommendations. Furthermore, the ability to predict pH alongside nutrients provides a comprehensive soil health assessment, supporting holistic management approaches that consider the interplay between soil acidity and nutrient availability. This comprehensive analysis can lead to more sustainable farming practices, improved crop yields, and better environmental stewardship in agricultural systems.
This study aimed to enhance predictive models for estimating soil nutrients N, P, K, pH, Mg and Ca through machine learning approaches, specifically optimized PLSR and SVM. Obtained results demonstrated that SVM models generally outperformed PLSR models in terms of prediction accuracy and robustness for all soil nutrients analyzed.
The developed models show promise for integration into automated soil management systems, potentially
This research was fully supported and funded by the RIIM LPDP grant and BRIN through RIIM phase 3 research scheme 2023. Also, to the LPPM University Syiah Kuala for fully administrative support.
[1] Xu, S., Zhao, Y., Wang, Y. (2024). Optimizing machine learning models for predicting soil pH and total P in intact soil profiles with visible and near-infrared reflectance (VNIR) spectroscopy. Computers and Electronics in Agriculture, 218: 108643. https://doi.org/10.1016/j.compag.2024.108643
[2] Das, B., Chakraborty, D., Singh, V.K., Das, D., Sahoo, R.N., Aggarwal, P., Mondal, B.P. (2023). Partial least square regression based machine learning models for soil organic carbon prediction using visible–near infrared spectroscopy. Geoderma Regional, 33: e00628. https://doi.org/10.1016/j.geodrs.2023.e00628
[3] Dos Santos, U.J., de Melo Dematte, J.A., Menezes, R.S.C., Dotto, A.C., Guimarães, C.C.B., Alves, B.J.R., Sampaio, E.V.D.S.B. (2020). Predicting carbon and nitrogen by visible near-infrared (Vis-NIR) and mid-infrared (MIR) spectroscopy in soils of Northeast Brazil. Geoderma Regional, 23: e00333. https://doi.org/10.1016/j.geodrs.2020.e00333
[4] Gathuka, L.W., Kato, T., Takai, A., Flores, G., Inui, T., Katsumi, T. (2021). Effect of acidity on attenuation performance of sandy soil amended with granular calcium-magnesium composite. Soils and Foundations, 61(4): 1099-1111. https://doi.org/10.1016/j.sandf.2021.05.007
[5] Zhou, W., Wang, Q., Chen, S., Chen, F., Lv, H., Li, J., Liang, B. (2024). Nitrate leaching is the main driving factor of soil calcium and magnesium leaching loss in intensive plastic-shed vegetable production systems. Agricultural Water Management, 293: 108708. https://doi.org/10.1016/j.agwat.2024.108708
[6] Zhang, T., Jiku, M.A.S., Li, L., Ren, Y., Li, L., Zeng, X., Su, S. (2023). Soil ridging combined with biochar or calcium-magnesium-phosphorus fertilizer application: Enhanced interaction with Ca, Fe and Mn in new soil habitat reduces uptake of As and Cd in rice. Environmental Pollution, 332: 121968. https://doi.org/10.1016/j.envpol.2023.121968
[7] Lei, J., Yin, J., Chen, S., Fenton, O., Liu, R., Chen, Q., Zhang, S. (2024). Understanding phosphorus mobilization mechanisms in acidic soil amended with calcium-silicon-magnesium-potassium fertilizer. Science of The Total Environment, 916: 170294. https://doi.org/10.1016/j.scitotenv.2024.170294
[8] Rao, R.S., Bashri, M., Mohideen, M.I.H., Yildiz, I., Shetty, D., Shaya, J. (2024). Recent advances in heterogeneous porous Metal–Organic Framework catalysis for Suzuki-Miyaura cross-couplings. Heliyon, 10(23): e40571. https://doi.org/10.1016/j.heliyon.2024.e40571
[9] Guo, Y., Li, S., Abebe, W., Wang, J., Shi, L., Liu, D., Zhao, S. (2024). Non-derivatized metal-organic framework nanosheets for water electrolysis: Fundamentals, regulation strategies and recent advances. Chinese Journal of Catalysis, 67: 21-53. https://doi.org/10.1016/S1872-2067(24)60153-1
[10] Xie, X.L., Pan, X.Z., Sun, B. (2012). Visible and near-infrared diffuse reflectance spectroscopy for prediction of soil properties near a copper smelter. Pedosphere, 22(3): 351-366. https://doi.org/10.1016/S1002-0160(12)60022-8
[11] Rossel, R.V., Cattle, S.R., Ortega, A., Fouad, Y. (2009). In situ measurements of soil colour, mineral composition and clay content by vis–NIR spectroscopy. Geoderma, 150(3-4): 253-266. https://doi.org/10.1016/j.geoderma.2009.01.025
[12] Park, S., Jeon, S., Kwon, N.H., Kwon, M., Shin, J.H., Kim, W.C., Lee, J.G. (2024). Application of near-infrared spectroscopy to predict chemical properties in clay rich soil: A review. European Journal of Agronomy, 159: 127228. https://doi.org/10.1016/j.eja.2024.127228
[13] Mohamed, E.S., Saleh, A.M., Belal, A.B., Gad, A. (2018). Application of near-infrared reflectance for quantitative assessment of soil properties. The Egyptian Journal of Remote Sensing and Space Science, 21(1): 1-14. https://doi.org/10.1016/j.ejrs.2017.02.001
[14] Pasquini, C. (2018). Near infrared spectroscopy: A mature analytical technique with new perspectives–A review. Analytica Chimica Acta, 1026: 8-36. https://doi.org/10.1016/j.aca.2018.04.004
[15] Munawar, A.A., Devianti, D., Satriyo, P. (2021). Agricultural soil fertility properties in the near infrared spectrum. In IOP Conference Series: Earth and Environmental Science, 922(1): 012006. https://doi.org/10.1088/1755-1315/922/1/012006
[16] Huang, J., Mao, Z., Xiao, D., Fu, Y., Li, Z. (2024). A novel quantitative detection method for soil organic matter content based on visible to near-infrared spectroscopy. Soil and Tillage Research, 244: 106247. https://doi.org/10.1016/j.still.2024.106247
[17] Wang, Q., Zhang, H., Li, F., Gu, C., Qiao, Y., Huang, S. (2021). Assessment of calibration methods for nitrogen estimation in wet and dry soil samples with different wavelength ranges using near-infrared spectroscopy. Computers and Electronics in Agriculture, 186: 106181. https://doi.org/10.1016/j.compag.2021.106181
[18] Munawar, A.A., Yunus, Y., Satriyo, P. (2020). Calibration models database of near infrared spectroscopy to predict agricultural soil fertility properties. Data in Brief, 30: 105469. https://doi.org/10.1016/j.dib.2020.105469
[19] Chen, H., Xu, L., Ai, W., Lin, B., Feng, Q., Cai, K. (2020). Kernel functions embedded in support vector machine learning models for rapid water pollution assessment via near-infrared spectroscopy. Science of the Total Environment, 714: 136765. https://doi.org/10.1016/j.scitotenv.2020.136765
[20] Mishra, P., Verschoor, J., Nijenhuis-de Vries, M., Polder, G., Boer, M.P. (2023). Portable near-infrared spectral imaging combining deep learning and chemometrics for dry matter and soluble solids prediction in intact kiwifruit. Infrared Physics & Technology, 131: 104677. https://doi.org/10.1016/j.infrared.2023.104677
[21] Huang, X., Xia, L. (2017). Improved kernel PLS combined with wavelength variable importance for near infrared spectral analysis. Chemometrics and Intelligent Laboratory Systems, 168: 107-113. https://doi.org/10.1016/j.chemolab.2017.06.013
[22] Zhao, D., Arshad, M., Wang, J., Triantafilis, J. (2021). Soil exchangeable cations estimation using Vis-NIR spectroscopy in different depths: Effects of multiple calibration models and spiking. Computers and Electronics in Agriculture, 182: 105990. https://doi.org/10.1016/j.compag.2021.105990
[23] Xing, Z., Tian, K., Du, C., Li, C., Zhou, J., Chen, Z. (2019). Agricultural soil characterization by FTIR spectroscopy at micrometer scales: Depth profiling by photoacoustic spectroscopy. Geoderma, 335: 94-103. https://doi.org/10.1016/j.geoderma.2018.08.003
[24] Johnson, J.M., Vandamme, E., Senthilkumar, K., Sila, A., Shepherd, K.D., Saito, K. (2019). Near-infrared, mid-infrared or combined diffuse reflectance spectroscopy for assessing soil fertility in rice fields in sub-Saharan Africa. Geoderma, 354: 113840. https://doi.org/10.1016/j.geoderma.2019.06.043
[25] Bi, Y., Yuan, K., Xiao, W., Wu, J., Shi, C., Xia, J., Zhou, G. (2016). A local pre-processing method for near-infrared spectra, combined with spectral segmentation and standard normal variate transformation. Analytica Chimica Acta, 909: 30-40. https://doi.org/10.1016/j.aca.2016.01.010
[26] Munawar, A.A., Meilina, H., Pawelzik, E. (2022). Near infrared spectroscopy as a fast and non-destructive technique for total acidity prediction of intact mango: Comparison among regression approaches. Computers and Electronics in Agriculture, 193: 106657. https://doi.org/10.1016/j.compag.2021.106657
[27] Hayati, R., Zulfahrizal, Z., Munawar, A.A. (2021). Robust prediction performance of inner quality attributes in intact cocoa beans using near infrared spectroscopy and multivariate analysis. Heliyon, 7(2): e06286. https://doi.org/10.1016/j.heliyon.2021.e06286
[28] Fu, C., Cao, S., Tian, A. (2025). Estimation of soil chromium content using visible and near-infrared spectroscopy coupled with discrete wavelet transform and long short-term memory model. Advances in Space Research, 75(7): 5386-5401. https://doi.org/10.1016/j.asr.2025.01.048
[29] Naibo, G., de São José, J.F.B., Zanotelli, C.C., Pesini, G., et al. (2025). Near-infrared spectroscopy and machine learning to estimate the physical and chemical properties of soils cultivated with Ilex paraguariensis. Environmental Technology & Innovation, 40: 104409. https://doi.org/10.1016/j.eti.2025.104409
[30] Cardoso, V.G.K., Poppi, R.J. (2021). Non-invasive identification of commercial green tea blends using NIR spectroscopy and support vector machine. Microchemical Journal, 164: 106052. https://doi.org/10.1016/j.microc.2021.106052
[31] Xu, S., Lu, B., Baldea, M., Edgar, T.F., Nixon, M. (2018). An improved variable selection method for support vector regression in NIR spectral modeling. Journal of Process Control, 67: 83-93. https://doi.org/10.1016/j.jprocont.2017.06.001
[32] Cloete, W.H., du Preez, G., Van Zijl, G.M. (2025). Developing a near-infrared spectroscopy calibration algorithm for soil organic carbon content in South Africa. Soil Advances, 3: 100039. https://doi.org/10.1016/j.soilad.2025.100039
[33] de Santana, F.B., Otani, S.K., de Souza, A.M., Poppi, R.J. (2021). Comparison of PLS and SVM models for soil organic matter and particle size using vis-NIR spectral libraries. Geoderma Regional, 27: e00436. https://doi.org/10.1016/j.geodrs.2021.e00436
[34] Nicolai, B.M., Beullens, K., Bobelyn, E., Peirs, A., Saeys, W., Theron, K.I., Lammertyn, J. (2007). Nondestructive measurement of fruit and vegetable quality by means of NIR spectroscopy: A review. Postharvest Biology and Technology, 46(2): 99-118. https://doi.org/10.1016/j.postharvbio.2007.06.024
[35] Cozzolino, D. (2014). An overview of the use of infrared spectroscopy and chemometrics in authenticity and traceability of cereals. Food Research International, 60: 262-265. https://doi.org/10.1016/j.foodres.2013.08.034
[36] Madhavan, D.B., Baldock, J.A., Read, Z.J., Murphy, S.C., Cunningham, S.C., Perring, M.P., Baker, T.G. (2017). Rapid prediction of particulate, humus and resistant fractions of soil organic carbon in reforested lands using infrared spectroscopy. Journal of environmental management, 193: 290-299. https://doi.org/10.1016/j.jenvman.2017.02.013
[37] Sila, A., Pokhariyal, G., Shepherd, K. (2017). Evaluating regression-kriging for mid-infrared spectroscopy prediction of soil properties in western Kenya. Geoderma Regional, 10: 39-47. https://doi.org/10.1016/j.geodrs.2017.04.003
[38] Hong, Y., Liu, Y., Chen, Y., Liu, Y., Yu, L., Liu, Y., Cheng, H. (2019). Application of fractional-order derivative in the quantitative estimation of soil organic matter content through visible and near-infrared spectroscopy. Geoderma, 337: 758-769. https://doi.org/10.1016/j.geoderma.2018.10.025
[39] Sithole, N.J., Ncama, K., Magwaza, L.S. (2018). Robust Vis-NIRS models for rapid assessment of soil organic carbon and nitrogen in Feralsols Haplic soils from different tillage management practices. Computers and Electronics in Agriculture, 153: 295-301. https://doi.org/10.1016/j.compag.2018.08.036
[40] Hau, N.X., Tuan, N.T., Trung, L.Q., Chi, T.T. (2024). Estimation of soil organic carbon content using visible and near-infrared spectroscopy in the Red River Delta, Vietnam. Chemometrics and Intelligent Laboratory Systems, 255: 105253. https://doi.org/10.1016/j.chemolab.2024.105253
[41] Singha, C., Swain, K.C., Sahoo, S., Govind, A. (2023). Prediction of soil nutrients through PLSR and SVMR models by VIs-NIR reflectance spectroscopy. The Egyptian Journal of Remote Sensing and Space Sciences, 26(4): 901-918. https://doi.org/10.1016/j.ejrs.2023.10.005