Agbor A. Esoso![]() | Saheed Akande
| Saheed Akande![]() | Omolayo M. Ikumapayi*
| Omolayo M. Ikumapayi*![]() | Oluwasina L. Rominiyi
| Oluwasina L. Rominiyi![]() | Temitayo M. Azeez
| Temitayo M. Azeez![]()
© 2023 IIETA. This article is published by IIETA and is licensed under the CC BY 4.0 license (http://creativecommons.org/licenses/by/4.0/).
OPEN ACCESS
This study focuses on the application of Sensors, Arduino Mega, and GSM Module for the development of an autonomous system to overcome the problems of cavitation, burnt pumps, and overflow, among others associated with the manually operated pumping system. Prevention of these challenges is very fundamental to system performance. Though there exist numerous research on the automation of fluid pumping system, literature is sparse that consider fluid level control and other flow parameters to ensure a non-cavitation flow rate. A stanchion of a water system comprising of a surface and a header. A stanchion of the water system comprising of a surface and a header tank was developed and a single-stage centrifugal pump was explored for water pumping. A flow meter was installed on the delivery line for flow rate and accumulated volume measurement. A simple mechatronic module was developed to monitor the system's operation and performance. The fluid flow meter measures the flow rate and the accumulated volume of water transported into the header tank. An alarm system (buzzer) was used to determine the maximum level of water in the surface tank to avoid surface water overflow. In conclusion, the challenges of manually operated pumping systems such as cavitation, overflow among others have been eliminated by introducing an automated system that monitors the system conditions with little human intervention.
sensors, Arduino, cavitation, overflow, automation, mechatronics module, pump, fluid
Fluid is a substance that deforms continuously when subjected to shear. In a pipe, a fluid flows over several surfaces. Because the fluid's particles are moving in relation to one another as the fluid is moving, shear stresses emerge. The velocity of a fluid moving through a pipe is zero at the pipe wall. Fluid viscosity and flow resistance are directly related [1]. The fluid as a whole can be a combination of liquid and gas [2]. Fluid flow can be aided by gravity, natural expansion of fluids due to changes in climatic conditions, or through a pump [3]. Flow agitation as patterning to this work will be initiated by a centrifugal pump. From a tank that is vertically positioned and has a positive suction head, fluid reaches the pump impeller along or close to the rotational axis. As a result of the impeller's acceleration, this flows radially outward into a diffuser or volute chamber (casing), where it escapes into the supply pipe and runs into the header tank. The most often utilized type of modern pump for irrigation is the centrifugal pump. They are employed to pump water from shallow wells, lakes, streams, reservoirs, as well as streams [4].
Using centrifugal motion, the pump known as a centrifugal pump transforms mechanical energy into hydraulic energy [5]. It is a rotor-dynamic pump that elevates a fluid's pressure using a rotating impeller. Axial flow, mixed flow, and radial flow are only a few of the several types of centrifugal pumps. Centrifugal pumps are usually identified with their relatively poor suction power and are prone to developing cavitation. Cavitation will occur when the inlet pressure (Pinlet) in the fluid is less than the vapour pressure (Pvp) of the fluid (Pinlet less than Pvp) [6]. With Pinlet < Pvp, vapour bubbles will form in the fluid at the impeller inlet and its continual explosion will result to impeller pitting in the course of water transfer.
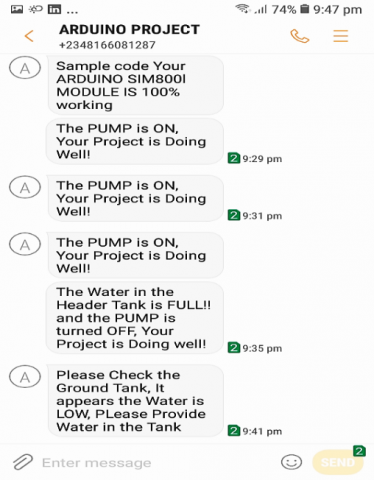
Cavitation in a water distribution system of plant, industry, institution, household or a community from its source to the end user, is bound to impose threats on the operator, pumps, manifold, electrical installations (controls, cables etc.), reservoirs, floors, decking, walls of the building or stanchion and the end user if allowed unchecked. The drive to provide alleviatory measures to forestall these looming challenges of a manually operated system brought about the concept of applying the GSM Module and Arduino to monitor, control, and sense turbidity, and communication of water level in a reservoir becomes imperative.
Research has been done in this area in recent time, but the novelty of this present work are as follows: In addition to information on performance of system being send via the GSM module to the operator, the information on flow rate, water level and system performance is being displayed on LCD for visual aid.
Besides, the system is also developed to detect and display the quality of water (turbidity). Turbidity check is essential for water quality and saving the pump from clogging. This work aims to develop an autonomous system for the measurement of flow at a zero-cavitation flow rate using a mechatronics system. The specific objective of this research is to determine the fluid level in the tank beyond which the cavitation will cease and the corresponding flow rate.
2.1 Fluid flow
One of the key elements of fluid dynamics is fluid flow, which is part of fluid mechanics. When subjected to imbalanced forces, it entails a fluid moving and undergoing equivalent deformation. This motion is determined by the amount of pressure applied and continues as long as unbalanced forces are not withdrawn [7].
2.1.1 Volumetric flow rate
It is described as the volume of fluid that passes a specific cross-sectional area every second. By multiplying the cross-sectional area (A) of the flow by the average flow velocity, one can get the volumetric flow rate. Its unit is m3/s [8].
$\dot{v}=v_{a v g} A$ (1)
2.1.2 Fluid flow in pipes
Fluid encounters friction between the walls of the pipe and resistance as it runs through it. Additionally, there is friction between the various fluid layers. Different forms of flow are created as a result of these resistive forces, which alter how the fluid moves through the pipe.
2.1.3 Laminar flow
According to Prima et al. [9], laminar flow, also known as streamline flow, is when a fluid particle moves in a straight line parallel to a pipe wall at a very low velocity without causing any disruption between the layers. To understand the type of flow in the tube, the Reynolds number is a crucial parameter. For a pipe, a flow with a Reynolds number of less than 2300 is regarded as laminar. The velocity, pressure, and other flow characteristics at each fluid point are constant in laminar flow [8].
2.1.4 Turbulence flow
The characteristics of turbulent flow, include irregularity, dissipation, a high Reynolds number, and three-dimensionality. Despite appearing chaotic, they are controlled by the Navier-Stokes equation [2, 9]. This flow has a high velocity and a Reynolds number of over 4000. The most typical flow type needs to deal with challenges including being difficult to see with open eyes and having very subtle variations that can only be seen with a laser [7, 9].
2.1.5 Transitional flow
Transitional flow is a combination of laminar and turbulent flow, with the laminar flow towards the pipe's borders and turbulent flow in the center. Each of the above movements exhibits distinct behaviors as a result of the frictional energy lost during flow movement, and several equations are used to forecast these behaviors. Transitional flow is a form of medium-velocity flow with a Reynolds number of at least 2300 but not more than 4000 [10].
2.1.6 Reynolds number
The Reynolds number describes the relationship between inertial and viscous forces within a fluid that is experiencing relative internal motion as a result of varying fluid velocities. A boundary layer, such as the bounding surface inside a pipe, is an area where these forces affect how they behave. The Reynolds number of a flow is determined as:
$R e=\frac{U L}{V}$ (2)
where,
U is the characteristic velocity
L is the length scales of the flow and
V is the kinematic viscosity of the fluid.
In turbulent flow at a high Reynolds number, the velocity scales are wide in magnitude, spatial scale, and in temporal scale [11].
The Reynolds Number (Re) defines whether the fluid is laminar, transitional, or turbulent as described below [12].
Re<2300 Larminar Flow
Re≤Re≤10,000 Transitional Flow
Osborne Reynolds found in 1880 that the stream system is primarily dependent on the balance of fluid viscous and inertial forces [12].
where,
Vavg=average velocity (m/s),
D=internal diameter (m),
μ=dynamic viscosity (Pa*s) and
$v=\frac{\rho}{\mu}$=kinematic viscosity of fluid (m2/s),
Reynolds Number is a unit less quantity.
2.1.7 Bernoulli’s principle
According to Bernoulli's Principle, a fluid's speed increases at the same time that its static pressure or potential energy decreases [13]. It can be developed from the idea of energy conservation. According to the law of conservation of energy, energy cannot be generated or destroyed but can only be transformed from one form to another.
In fluid flow, there are three types of energy [12]:
Therefore, the total energy at any point in a streamline flow of fluid in a pipe is presented in Eq. (3):
E=PE+KE+FE (3)
Bern Bernoulli’s equation states that provided the flow is steady, the sum of various forms of mechanical energy in a fluid along a streamline is the same at all points in that streamline.
It is mathematically expressed as:
$\frac{P_1}{\omega}+\frac{V_1^2}{2 g}+Z_1=\frac{P_2}{\omega}+\frac{V_2^2}{2 g}+Z_2$ (4)
where,
P1 and P2=inlet and outlet pressure respectively.
Z1 and Z2=height of inlet and outlet respectively.
V12 and V22=inlet and outlet average velocity respectively.
ω=ρg.
where,
ρ=density of the fluid in question and
g=acceleration due to gravity.
All the parameters in Eq. (4) can also be considered as the head.
2.1.8 Continuity equation
Using the continuity equation and momentum equation, the flow of the majority of fluids may be analytically characterised. The continuity equation states that the amount of fluid entering a given volume either exits or stays there.
Thus,
A1V1=A2V2 or Q=A1V1 (5)
where,
A equals area of pipe measured in square meter (m2) and
V equals the volume of fluid that flows through within a timed frame measured in meter cube (m3).
2.1.9 Head losses in fluid flow
There are two categories of head losses: major and minor. Major: The inside surface of the pipe's roughness is what causes head losses, also known as frictional losses, which happen over the whole length of the pipe. They are primarily brought on by friction [14]. Minor losses are those brought on by a change in fluid momentum. They are primarily caused by pipe components such as bends, valves, abrupt changes in pipe diameter, etc. Minor losses are often insignificant in comparison to friction losses in larger pipe systems. Additional elements provide flow and turbulence resistance. The system curve is the graph of the head loss against the flow rate after analysis. Characteristic curves are the graphs of the experimentally determined pump head and pump efficiency versus flow rate. The intersection of the system curve and the characteristic curve is where the pump placed in a piping system operates. The operating point is the name of this intersection [15].
2.2 Pumping system
Pumps use force from an external source to lift fluids like liquid and gas from one place to another, from a lower level to a higher level (electrical or mechanical). The pumping mechanism can be made to work manually, partially, or totally automatically. A pump is a hydraulic device used to move or lift fluids. It consists primarily of an impeller or piston that moves within a cylinder, with valves strategically placed to admit or retain the fluid as it is drawn through them by the piston's or impeller's motion, which is connected to a rotating shaft. A pump converts mechanical energy into pressure energy [16]. Utilizing a windmill or a watermill to pump water is among the earliest applications [6]. In recent times, pumps applications are numerous, ranging from domestic to industrial. Pumps design are used in various applications such as air conditioning systems, irrigation [17], water supply, refrigeration, transfer of crude or refined products, fuel and oil distribution in automobiles, power plants, and others.
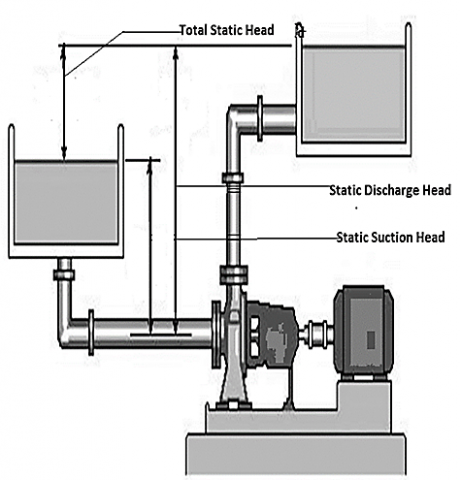
Figure 1 gives a pictorial view of a typical pumping system with a static suction head (positive head). The pump is installed below the suction tank (source). A static suction head is generated which enhances high static pressure at the impeller inlet. The system geometry favours flow by gravity to naturally flood the impeller housing to the corresponding height of the static discharge head.
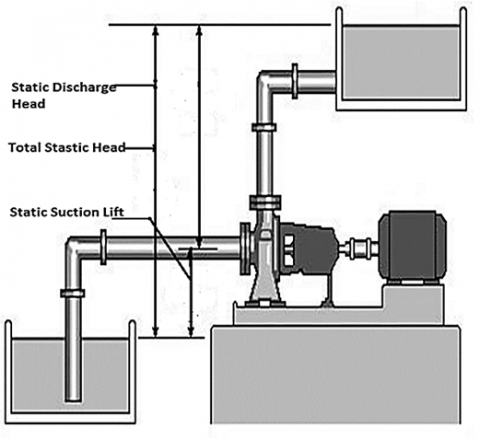
While Figure 2 gives a typical illustration of a pumping system with a static suction lift (negative head). The pump is installed above the suction tank. Static suction lift is generated, and it is prone to cavitation if the system is designed without strictly adhering to Net Positive Suction Head (NSPH) guiding roles.
Figure 1. Pumping system with static suction head
Figure 2. Pumping system with static suction lift
A single-stage centrifugal pumping system consists of the pump(s), manifold, and reticulation, control panel (electrical system), the suction pipe, connected to the fluid source, and the delivery pipe, connected to the entry tank(s). Other components include valves, for flow control or simulation, and pressure pots, where pressure gauges or manometry tubes are connected for various pressure readings as the case may be. The pump, being the mechanical unit, cannot operate in isolation without external force. It is driven by an external force. This force could be mechanical, electrical, and others. For moving fluids in industrial activities, centrifugal pumps are used in a variety of settings. The mechanical design of centrifugal pumps makes them dependable.
A rotating disc that has been moulded into vanes is the impeller, which is the primary component of a centrifugal pump. A casing surrounds the impeller to channel and direct the produced liquid flow [3, 17]. Water enters close to the impeller's centre, where motion is given to the fluid by the turning of the vanes, and the water is subsequently expelled out the casing's exit. Centrifugal pumps can be made to fit certain needs or specifications by changing their individual designs and arrangements. The system design or geometry plays a very important role in the performance of the pump. It could affect its performance positively or otherwise. Among other issues, improper pipework can cause cavitation and hydraulic instability in a pump system. The suction piping and suction system design should be prioritised in order to prevent cavitation. High amounts of vibration and noise may be brought on by cavitation, internal recirculation, and air entrainment, which can harm seals and bearings [8, 17].
Numerous hydrodynamic issues, including cavitation-related noise and vibration, internal recirculation, and air entrainment, can arise when fluid flow is less than 50% of the best efficiency point (BEP). At very low flows, sometimes as low as 35% of BEP flow, some pumps can withstand suction recirculation instability.
2.2.1 Pumping system piping and its effect on fluid flow
Large flow turbulence, bearing troubles, seal issues (failure), early breakdown of pump components, or catastrophic failures are all easily caused by poor pipework design. Suction pipework is crucial because, among other working parameters, the liquid must reach the pump impeller's eye at the proper pressure and temperature. Cavitation danger will be reduced, and pump performance will be reliable with a smooth, uniform flow. The Head is significantly influenced by piping and passage diameter. The pressure loss due to friction would roughly be inversely proportional to the fifth power of the pipe diameter. For instance, a 10% increase in pipe diameter could lead to a 40% reduction in head loss. Similar to this, a 20 percent increase in pipe diameter might cut head loss by 60 percent. In other words, the frictional head loss would be lower than 40% of the head loss at the original diameter [13]. Pump suction piping design is a crucial aspect because of how important a net positive suction head (NPSH) is in pumping applications [15]. The suction pipework should be as short overall and as basic and straight as possible. To prevent turbulences, a centrifugal pump should typically have a straight run that is six to eleven times the diameter of the suction tube [18]. Permanent suction strainers are typically discouraged, although a temporary suction strainer is typically necessary.
2.2.2 Pumping systems and their effects
Tables 1a and 1b are used to summarize various systems geometry and the nature of the liquid being pumped and the resultant effects while in operation.
Table 1a. Features and effects of a good pumping system
|
S/N |
FEATURE |
EFFECT |
|
1 |
Pump installed below the suction tank(source) |
A static suction head is generated which enhances high static pressure at the impeller inlet. |
|
2 |
Cold liquid |
Not susceptible to the hot fluid if suitable guidelines are adhered to. |
|
3 |
Short and straight suction pipe. Minimum number of valves and fittings |
Low suction loses |
|
4 |
Large pump inlet |
Lower suction velocity |
Table 1b. Features and effects of a bad pumping system
|
S/N |
FEATURE |
EFFECT |
|
1 |
Pump installed above the suction tank (source) |
Static suction lift is generated, and it is prone to cavitation the NSPH role is not strictly followed. |
|
2 |
Hot liquid |
Susceptible to cavitation |
|
3 |
Long and irregular suction pipe |
High suction loses |
|
4 |
Reduced or small suction inlet |
High suction velocity |
2.2.3 Cavitation in fluid flow
The Bernoulli equation for incompressible flow, where p signifies the local static pressure, denotes fluid density, and v denotes flow velocity, is the best tool for describing cavitation. This concept states that when the flow velocity increases, the static pressure must also decrease. Thus, when the static pressure falls below the fluid's vapour pressure, cavitation (the creation of gas bubbles in a fluid flow) will result [3]. NPSHR3% is the traditional measurement used in pumps to assess cavitation performance. For example, the NPSHA (Net Positive Suction Head available) is typically equal to k*NPSHR3%, where k is a safety margin (often 1.5–2), and the Net Positive Suction Head necessary at which a 3% head decrease is noticed [19]. According to dissolved gases and fluid turbulence, the onset of cavitation often occurs at significantly higher values of NPSHA, and it is observed that operating with a margin as high as 4 may be necessary to assure damage-free operations [6, 19]. One of the first faults examined mostly in the Pump Laboratory was cavitation. For a centrifugal pump, it happens when the Net Positive Suction Head Available (NPSHA) falls below the Net Positive Suction Head Required (NPSHR).
NPSHA=hp(s)+hv(s)+hvp (6)
Eq. (6): Net Positive Suction Head Available (NPSHA) for a centrifugal pump.
where,
hp(s)=Pressure head= $P_{\text {inlet }} / \rho g$,
hv(s)=Velocity head= $\frac{V^2}{2 g}$,
hvp=Vapour pressure= $P_{v p} / \rho g$,
and where,
Pinlet=Fluid pressure at the inlet,
hvp=Fluid vapour pressure,
ρ=Fluid density, $\frac{I b}{s^2}\left(\frac{k g}{m^3}\right)$,
g=Acceleration due to gravity, $\frac{32.2 f t}{s}\left(\frac{9.81 m}{s^2}\right)$,
V=Velocity, $\frac{f t}{s}\left(\frac{m}{s}\right)$,
S=Suction side of pump.
Cavitation will occur when the inlet pressure in the fluid is less than the vapour pressure (Pvp) of the fluid (Pinlet is less than Pvp). With Pinlet < Pvp, vapour bubbles will form in the fluid at the impeller inlet.
2.2.4 Cavitation free and prone levels
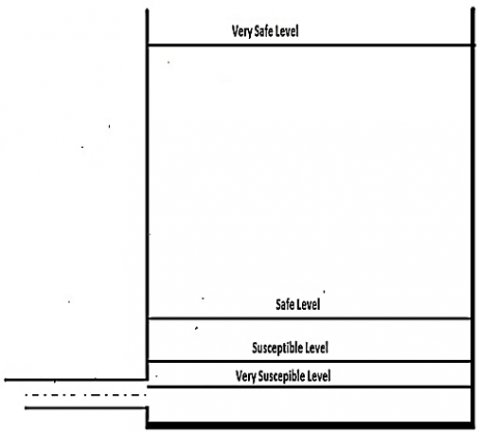
The Static Suction Head (Positive Suction Head) and the Static Suction Lift (Negative Suction Head) are determined by system orientation i.e., the location of the fluid source to be sucked. If a pump is placed below the reservoir, it gives a positive suction head thereby reducing the chances of cavitation as a result of an increase in the suction pressure at the pump inlet. Figure 3 shows a simple illustration of a reservoir that enables a Static Suction Head. The diagram indicates various levels in the tank as the head drops in the process of pumping. Whereas a pump positioned above the reservoir gives a negative suction which increases the chances of cavitation more if not properly installed and adhering strictly Net Positive Suction Head required to keep the pump functioning to capacity [3, 19]. The water level in the tank above the centre line (suction line), the distance between the pump and the tank, suction pressure at the inlet of the pump, and the system geometry are some of the basic determinant factors to a drop or increase in the net positive suction head required.
This work is putting necessary measures by ensuring proper level control of water in the surface tank by means of application of a liquid level control sensor. The work by design and development has put necessary factors to ensure the nearness of the pump to the reservoir and suitable system geometry to check cavitation.
Figure 3. Cavitation free and prone levels
2.2.5 Automation of pumping system
The advent of automation technologies has changed human function from creator to controller [20]. The primary goal of automation technology was to lessen operator effort and training requirements while simultaneously improving operations' efficiency and precision. It was thought conceivable to develop an autonomous system that required little or no human interaction, hence minimizing or completely eliminating the possibility of human error [16]. Automation technology is used in the procedures of several industries. Automation of the pump system will lead to more accurate control, and consequently to better its performance and reduced loss of water [21]. Observations of domestic and industrial establishments indicate that there are great variations in the water supply associated with uncontrolled systems. There are several possibilities in system automation. With the application of programmable logic controllers, Arduino and other microcontrollers in the automation of pump systems a more accurate control of the system operation fluid flow and level control are achievable [5]. Additionally, the prospect of a more precise water supply was made possible by growing substrate-grown crop areas and advancing glasshouse horticulture technology [17, 20, 21]. Accuracy in water supply could be viewed in terms of quality and quantity. So, monitoring the flow rate and turbidity of fluid being transferred is very important in a controlled system [22]. Automatic data capturing, processing, storage and the ease of keeping the operator fully furnished with information regarding the system performance are realisable through the interfacing of required sensors and transducers. With fluid flow and level control sensors, the flow rate of the system is monitored to ascertain the performance of the pump with a focus on the flow rate. The introduction of pressure sensors to the suction and temperature sensors to the fluid give static pressure and temperature value which are some important parameters to ascertain if the flow is a non-cavitation flow rate on the note when compared to the vapour pressure of the fluid [18, 21, 22]. Vapour pressure is a function of the temperature of the fluid being pumped.
To effectively accomplish the aim and objective of this study, various materials and methods suitable for the work were carefully selected. Emphases was placed on intensive literature review on material selection. For components with different grades, we went for the highest in terms of design capacity and functions.
To ascertain their accuracy, some of these components were subjected to test using various instruments and results were compared with the information given by the producer before using them.
3.1 Materials selection
The following electrical components were thoroughly selected for the work:
GSM (Global System for Mobile Communications) Module, DC to DC Buck Converter, Arduino MEGA, Turbidity Sensor, 4 Channel Relay, 12 Volt Battery, 12 VDC Diaphragm Water Pressure Pump, Flow Meter, and LCD I2C.
3.1.1 Global system for mobile Communications (GSM) module
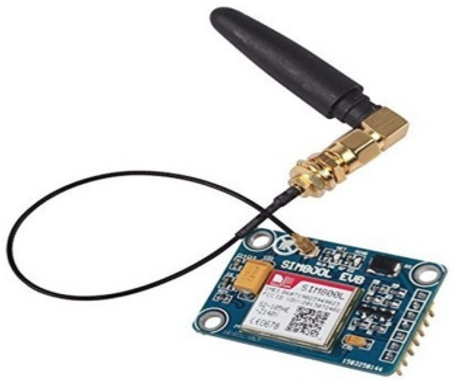
GSM (Global System for Mobile Communications) is a digital mobile telephony system that is widely used in all parts of the world. A GSM modem is a specialized type of modem which accepts a SIM card, and operates over a subscription to a mobile operator, just like a mobile phone [11, 21]. Figure 4 is to be used in this work for sending messages to the recipient’s phone.
Figure 4. SIM800L GSM module
A dependable and ultra-compact wireless module is the SIM800L. The SIM800L is an integrated Dual-band GSM/GPRS solution in an SMT module that can be used in client applications. The SIM800L, which has an industry-standard interface, offers GSM/GPRS 800/1600MHz capabilities for data, voice, fax as well as SMS in a compact package with little power consumption. The 24mm×24mm×3mm-tiny SIM800L can fit in practically all space constraints in user applications.
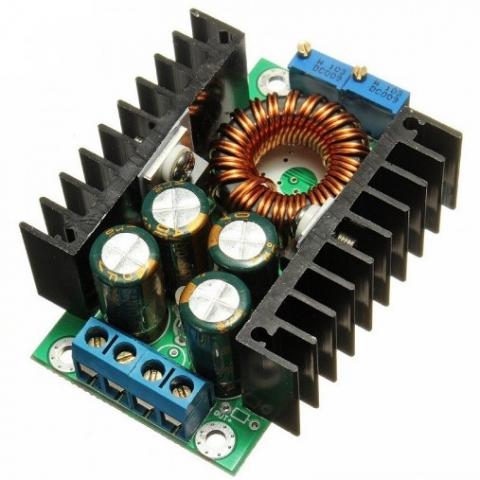
3.1.2 DC to DC buck converter
The SIM800l transmission burst consumes a minimum of 2A for effective signal reception and functionality [11]. This is the reason the use of buck converter shown in Figure 5 was employed to enhance the capability of the system. This DC-DC converter has a current limiter built in which is adjustable with a potentiometer.
Figure 5. DC-DC buck converter
3.1.3 Arduino MEGA 2560
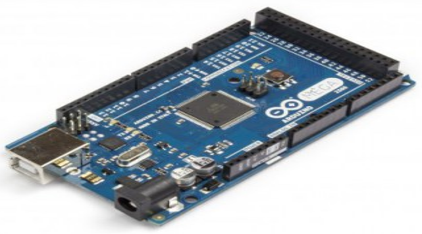
An open-source physical computing platform named Arduino is developed on a straightforward I/O board and a programming environment that supports the Processing/Wiring language. One can develop custom stand-alone items with Arduino or connect them to computer software (e.g., Flash, Processing, and Max MSP). Arduino has varying amounts of boards, of all the boards that were produced by Arduino; the Arduino MEGA 2560 was chosen for the study to create a development environment that implements the processing and interfacing language.
Figure 6 played a major significant role in the system, as it was used to initiate communication between different components and sensors within the system and it also serves as the controller for the study.
Figure 6. Arduino MEGA 2560
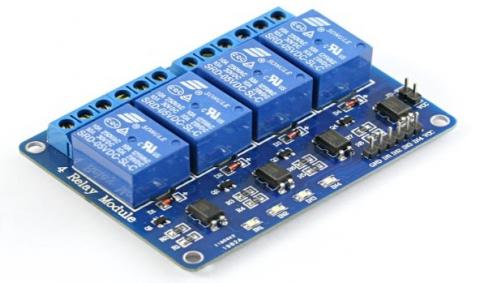
3.1.4 Channel relay
The 4 Channel Relay Modules is a handy board that may be used to manage high voltage, high current loads such as motors, solenoids, lamps, and AC loads. It is made to connect to microcontrollers like Arduino, PIC, and others. Relay terminals (COM, NO, and NC) are exposed with screw terminals to facilitate connections. Figure 7 was used to interface the pump to the Arduino board so as to receive signals at the programmed time. The choice of a 4-channel relay was to give room for expansion of the use of the system. This means on the long run after the system could be adopted for other applications with the three other COM pins.
Figure 7. 4-channel relay module
3.1.5 12-Volt battery
The 12 VDC battery as shown in Figure 8 was used as a means of powering the pump. The battery used for this study is a 12VDC 7.5AH battery. The choice of this battery was due to the current capacity.
Figure 8. 12-Volt rechargeable battery
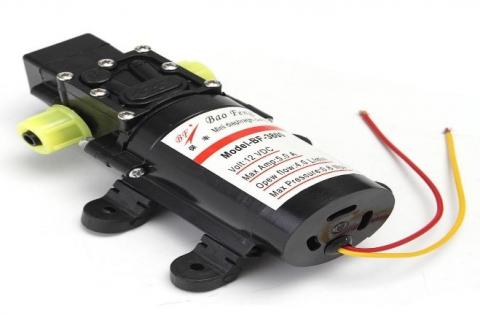
3.1.6 12VDC diaphragm water pressure pump
The diaphragm pump in Figure 9 was interfaced with the 4-channel relay which was then connected with the Arduino Mega board because the output of the Arduino board cannot power the pump as the pump draws more current when operating. The pump would lift the water to a level of 1.5 meters height with a moderate flow rate which would be read by the flow meter.
Figure 9. Diaphragm pump
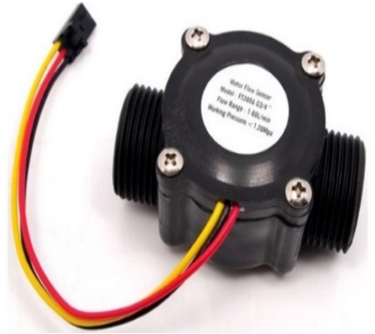
3.1.7 Flow meter
The flow meter in Figure 10 measures the flow rate of water passing through the pipe while the pump is turned on. The flow rate is read into the Arduino board, after which it is displayed on the LCD for proper documentation and record.
Figure 10. Flow meter
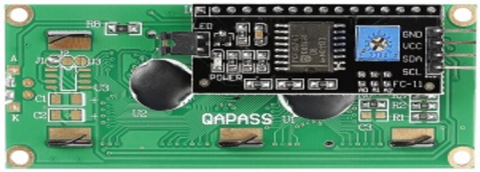
3.1.8 Liquid crystal display (LCD) with I2C module
LCD1602 or 1602 character-type liquid crystal display as shown in Figure 11 was used to display data or signals sent to the Arduino from the sensors such as turbidity level, flow rate, the water level in the tanks, and the system operating condition It functions like a dot matrix module to display letters, numbers, characters, and other data. It consists of 5×7 or 5×11 dot matrix positions, with one character per position. Between each pair of characters and between each line, there is a dot pitch and a space. A 16 by 2 LCD, which shows 2 lines of 16 characters, is the type of LCD utilized in this research.
Figure 11. LCD with I2C hardware mounted on it
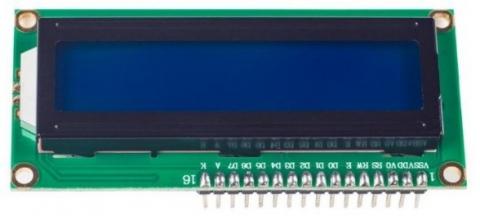
Typically, LCD1602 features parallel ports, which means it may simultaneously control several pins. 8 and 4 port connections are two different types of LCD1602 connectors. For this study, the four-port connection was used and this was made possible by the use of an enhancing hardware device known as an I2C bus. PHILIPS created the I2C bus, a kind of serial bus. This high-performance serial bus has the bus governing and high- or low-speed device synchronization features needed by various host systems. Only Serial Data Line (SDA) and Serial Clock Line, two bidirectional signal lines, are present on the I2C bus (SCL). To facilitate the ability to display on the I2C LCD1602 (See Figure 12), the blue potentiometer on the device is used to control the lighting.
Figure 12. LCD display
3.1.9 Method
This study aimed at examining the water quality with a major focus on the turbidity level read in the Nephelometric Turbidity Unit (NTU) [10], using the SEN0189 turbidity sensor [23] while producing feedback messages to the operator of the end users. It is also designed to display the instantaneous flow rate for the water under pressure by the pump, which is activated as soon as the lowest water level indicator on the top tank stops touching the water. The following were some of the materials and components used for the actualisation of this study.
This study consists of three major segments which are as follows:
i. The Mechanical Construction and Fabrication
ii. The Electronics Components and Sensors Assembling
iii. The Control and Programming Segments
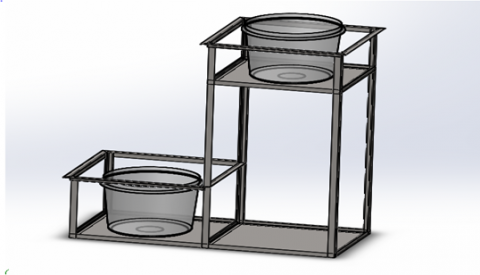
3.2 The mechanical construction and fabrication
The complete study consists of the initial frame and the tank and the plumbing installations. Solidworks 2015 was used to carry out the design of the frame. Solidworks is a computer tool for solid modeling that is generally used with Microsoft Windows for computer-aided design and engineering [23]. The software program helps designers and manufacturers develop a virtual prototype before the fabrication of the actual product. The frame of this study was designed using this software program as depicted in Figure 13.
Figure 13. Mechanical study design on Solidworks
The mechanical installation segment also featured the plumbing installation that involves the routing of pipes to connect the inlet of the header tank with the pump and the pump to the suction outlet of the ground tank, and from the outlet of the header tank to the inlet of the ground tank, to complete a closed loop circulation.
3.2.1 Electronic components and sensors assemblage (control module)
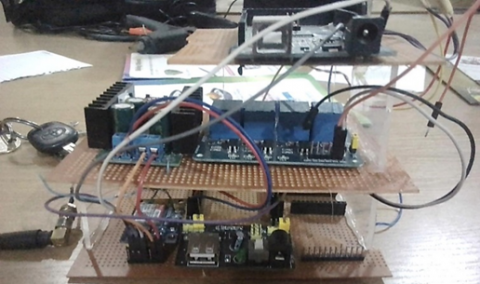
To develop a functional automation control module for the pumping system, various electrical components; GSM (Global System for Mobile Communications) Module, DC to DC Buck Converter, Arduino MEGA, Turbidity Sensor, 4 Channel Relay, 12 Volt Battery, 12 VDC Diaphragm Water Pressure Pump, Flow Meter, and LCD I2C were carefully selected and used. Arduino MEGA was interfaced with the GSM module and both were connected to other components following the circuit. The completed assemblage is shown in Figure 14.
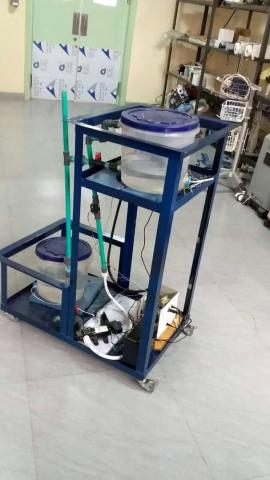
Figure 14. The completed automation control module (mechatronics system)
Figure 14 is the internal component of the complete system to show that the work was carried out. At the finishing stage, the device was enclosed in a square box with holes drill on it for cross ventilation. Outlets were created for all the sensors and other components connections. Besides, an extractor fan was installed to extract the heat generated while working.
3.2.2 System circuit
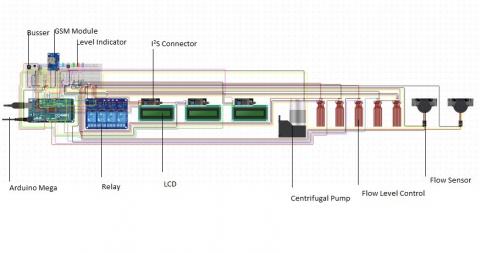
The circuit diagram for this segment was done on an online open source platform circuito.io as depicted in Figure 15. This is an online platform that offers a drag-and-drop means of building an Arduino-based study. Figure 15 represents the Circuit and the wiring diagram of the components. It was designed using an application known as circuto.io.
As you drag components into the workspace, the connection is being automatically.
Figure 15. Circuit diagram for the study; design on circuito.io
3.2.3 System interfacing segments
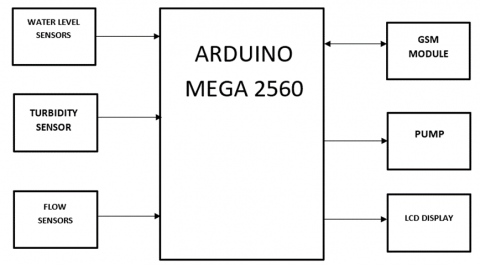
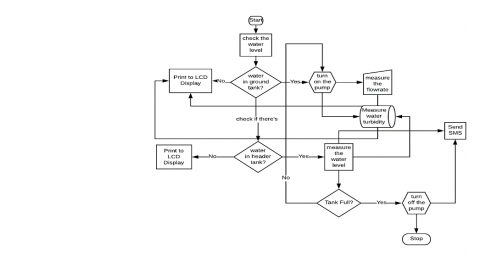
This segment explores the modality by which the system functions. It also shows how the communication between sensors and electronic components inter-relates. Arduino is the major prime controller of the system. Other components, readings, and measurement components are conditioned to comply with the programmed algorithms so as to produce a fully controlled system. Figure 16 illustrates the mode of interaction of the various components and sensors, whereas Figure 17 represents the working chart for the Mechatronics System.
Figure 16. The control and programming segment chart
3.2.4 Program pseudocode for the system
The system was programmed using the Arduino Integrated Development Environment (IDE) which is software programmed and developed to send commands to the Arduino board.
The way that section titles and other headings are displayed in these instructions, is meant to be followed in your paper.
Figure 17. Working chart for the mechatronics system
3.2.5 Flow demonstration procedure I
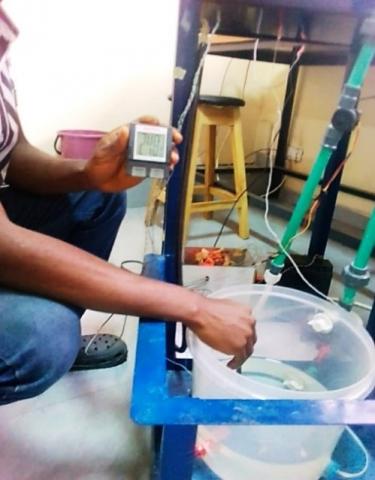
Performance evaluation was carried out using a fully developed pumping system with a stanchion containing both surface and header tank, a single stage centrifugal pump and complete pipe reticulation to evaluate the advantages of this device and it is dedicated to Thermo-fluid laboratory of Afe Babalola University as a training rig for the students after evaluation.
The system programme was written using Arduino IDE which is a software programme developed to send commands to the Arduino board in this study. With the Arduino Board as the major prime controller of the system, the command was initiated in its environment whereby all the components' readings and measurements are conditioned to comply with the programmed algorithms so as to produce a fully controlled system. Water was filled manually into the surface thank to a static head of 0.15M from the center line. The flow level was placed at 0.05M height above the centre line. With the suction valve fully opened, the command was initiated to pump water from the surface tank to the header tank using a 12V DC centrifugal pump.
In the process, the temperature of the water was measured and the vapour pressure being a function of the temperature was obtained from the water physical property table. The volume of water was collected within a set time of sixty (60) seconds and the flow rate was calculated using discharge $Q=\frac{v}{t}$. All parameters were noted, calculated, and recorded. After repeating the exercise six times using the same sixty seconds, the suction head and the retained head of 0.05M to avoid cavitation. The discharge Q is calculated to know if the pump performance is up to its designed capacity or not.
3.2.6 Flow demonstration procedure II
The flow simulation was conducted with the same set and procedure followed in 1, but to confirm if time variation will affect the flow type, the time was set at a range of ten (10) to sixty (60) seconds. Here, the Reynolds number was calculated to determine the type of flow. There are more than three types of flows, but Reynolds number placed emphasis on three which are Laminar, Transitional and Turbulent.
In this work, the three types of flow were involved.
This was achieved by regulating the valve on the delivery line. The essence of this was to confirm if the system will be suitable for a flow demonstration rig for the students. It was not comprehensive in this paper because we have gathered sufficient results from other parameters to justify the pumping is safe and will effectively be devoid of the negative outcomes associated with manually operated pumping systems.
4.1 Results for constant timed flow demonstration
A steady state flow is a condition in which the quantity of liquid flowing per unit of time is constant. Analysis was carried out on the flow process of the plant, to ascertain the stability of the flow. At a fixed time of sixty seconds, some volume of water was collected to determine the flow rate of the water from the ground tank to the header tank. This was repeated six times. The temperature with negligible intervals was also recorded. The results obtained in the course of the demonstration were analysed and recorded in Table 2.
Table 2. The results from the constant timed flow demonstration
|
S/N |
Tempt. (℃) |
Maximum Static Pressure KN/m2 |
Minimum Static Pressure KN/m2 |
Vapour Pressure KN/m2 |
Volume (m3)×10-3 |
Time (Secs) |
Flow Rate (m3/s) |
|
1 |
22.50 |
102.80 |
101.82 |
2.71 |
3.62 |
60 |
6.03×10⁻⁵ |
|
2 |
22.00 |
102.80 |
101.82 |
2.64 |
3.60 |
60 |
6.00×10⁻⁵ |
|
3 |
22.40 |
102.80 |
101.82 |
2.70 |
3.60 |
60 |
6.00×10⁻⁵ |
|
4 |
21.90 |
102.80 |
101.82 |
2.62 |
3.61 |
60 |
6.02×10⁻⁵ |
|
5 |
22.70 |
102.80 |
101.82 |
2.75 |
3.61 |
60 |
6.02×10⁻⁵ |
|
6 |
22.70 |
102.80 |
101.82 |
2.75 |
3.61 |
60 |
6.00×10⁻⁵ |
Cavitation will occur when the inlet pressure in the fluid is less than the vapour pressure (Pvp) of the fluid (Pinlet is less than Pvp). With Pinlet < Pvp, vapour bubbles will form in the fluid at the impeller inlet [6, 23]. The fluid level in the reservoir (surface tank) changes with time as the pump works. As the volume reduces if the recharging source is not high the suction pump will run until the water level will get to a susceptible cavitation level. To develop a cavitation-free system, both maximum and minimum static pressures were calculated using the maximum and minimum suction head.
Comparing both results obtained with vapour pressure of the fluid, which is the function of its temperature, confirms that the system is safe.
4.1.1 Flow rate and jet monitoring
Flow and jet monitoring are very important indicators in system performance evaluation. Fluctuation in any of these parameters shows the system is not delivering or releasing sufficient water enough to enhance the pump performance [24]. Flow rates from the proposed system in the course of the simulation, from 1-6 appear steady. There were no significant changes in volume collected with time. The changes noted are negligible. The pump designed flow rate, $Q=\frac{4 L}{M}$ and the developed system discharge, $Q=\frac{3.62 L}{M}$.
The result indicates that the system performance is good enough to prevent the pump from cavitation and ingression of air.
The water jet issuing from the delivery pipe into the header tank maintained the same trajectory with laminar-like jets. A jet maintaining the same trajectory in the course of pumping indicates that there is no ingression of air.
4.1.2 Results for variable timed volume collection flow demonstration
Analysis was carried out to examine the effect of time on flow velocity and volumetric flow rate under room temperature. A scheduled time, from a higher value of 60 seconds to a lower value of 10 seconds was allowed for the flow demonstration. A timed volume collection flow demonstration was conducted six times giving an interval of 10 seconds. The results obtained in the course of the demonstration were analysed and recorded in Table 3.
Discharge Formula: $Q=\frac{V O L U M E}{T I M E}\left(\frac{M^3}{S}\right)$
V=Average velocity, to be derived from continuity equation: Q=AV
A=the area of the cylindrical pipe
Table 3. The results from the variable timed flow demonstration
|
S/N |
Volume (m3) |
Time (Secs.) |
Temp of Fluid (℃) |
Dynamic Viscosity Kg/m2/s |
Average velocity (m/s) |
Discharge or flow rate (m3/s) ×10-5 |
Vapour Pressure KN/m2 |
|
1 |
3.6×10⁻³ |
60 |
24.8 |
0.00092 |
0.191 |
6.00 |
3.12 |
|
2 |
3.1×10⁻³ |
50 |
24.9 |
0.0009 |
0.197 |
6.20 |
3.14 |
|
3 |
2.4×10⁻³ |
40 |
25.0 |
0.00089 |
0.191 |
6.00 |
3.16 |
|
4 |
1.9×10⁻³ |
30 |
25.3 |
0.0009 |
0.201 |
6.33 |
3.22 |
|
5 |
1.2×10⁻³ |
20 |
25.0 |
0.00087 |
0.191 |
6.00 |
3.29 |
|
6 |
6.2×10⁻⁴ |
10 |
25.1 |
0.00082 |
0.197 |
6.20 |
3.37 |
When all properties of a flow are independent of time, then the flow is steady [24]. From the results obtained, all the properties are independent of time, which clearly indicates that the flow is steady from its definition. A timed volume collection was conducted for a range of time ranging from ten seconds to sixty seconds to monitor, collect and analyze data to determine some flow properties. Despite time variation, flow properties arrived at, are all independent of time. Constant temperature, velocity and flow rate were constant with negligible difference in values.
Buzzer application connected to the ground tank is to show that the entire circle of water, from generation, storage and distribution can be checked and to ensure that other measured areas are necessarily checked. No system is 100% accurate. Though, during performance evaluation no false and missed alarm was registered. It may still come up because of wear and tear in the near future if proper maintenance measures are not followed.
On this premise, other measures were also adopted before the buzzer. Sensors were placed on the wall of the reservoir from bottom to the top and these sensors were connected to LEDs of different colours. Each LED is triggered on as water touches each sensor. The buzzer is like the last resort.
Water is required in our day-to-day activities for our survival. Its importance spans from domestic to industrial applications. It is used for drinking, washing, cooking, lucrative, transportation, food processing, irrigation, power generation, and lots more.
Automation of the water pumping system becomes very imperative to the quality of water delivery and the performance of the system. The facilities or gadgets installed are being protected since the system senses abnormalities associated with its operation. The programme helps to avert or reduce the negative impacts on the system to the barest minimum.
In this work, the water level is being controlled by means of liquid level sensors placed at some strategic locations and connected to the Microcontroller (Arduino Mega) which gives commanding signals to the pump either to turn ON or OFF as the situation warrants. The system is equipped with a GSM module that sends messages in the form of SMS to the operator simultaneously.
The system geometry plays a very important role in curbing cavitation by enhancing a zero-cavitation flow rate. The design features of the system give room for a positive pressure head. Water by gravity naturally floods or fills the suction to a corresponding static head on the pump manifold without priming.
To curb air ingression into the suction and to avoid the static head going below the vapour pressure, a liquid level sensor is placed at a suitable height to retain a constant static head of 0.05m water.
The authors would like to acknowledge Afe Babalola University for the payment of APC for this publication.
[1] Seib, M.D. (2013). Drinking water quality assessment at source and point-of-use in rural Mali: A case study. In WEFTEC 2013. Water Environment Federation, pp. 1848-1857. https://doi.org/10.2175/193864713813673389
[2] Lin, Z., Ruan, X.D., Zou, J., Fu, X. (2014). Experimental study of cavitation phenomenon in a centrifugal blood pump induced by the failure of inlet cannula. Chinese Journal of Mechanical Engineering, 27(1): 165-170. https://doi.org/10.3901/CJME.2014.01.165
[3] Toloian, A. (2015). The cause of cavitation and prevention methods of this desctructive phenomenon in pumps. Technical Council of East Azerbaizan Province, 3(2): 141-149.
[4] Saidpatil, V.V., Thakare, A.S. (2014). Design & weight optimization of pressure vessel due to thickness using finite element analysis. International Journal of Emerging Engineering Research and Technology, 2(3): 1-8.
[5] Smith, E.J., Kpochi, K.P., Ibrahim, A.A. (2018). An ultrasonic & GSM module based water level monitoring system via Iot. American Journal of Engineering Research, 7(8): 21-25.
[6] Sreedhar, B.K., Albert, S.A., Pandit, A.B. (2017). Cavitation damage: Theory and measurements–A review. Wear, 372: 177-196. https://doi.org/10.1016/j.wear.2016.12.009
[7] Jiang, Z.Y., Yang, L.M., Gao, Z., Moan, T. (2014). Numerical simulation of a wind turbine with a hydraulic transmission system. Energy Procedia, 53: 44-55. https://doi.org/10.1016/j.egypro.2014.07.214
[8] Wang, W.T., Lu, H., Meng, G.Q.Q.G. (2018). Pressure fluctuation characteristics induced by cavitation in a centrifugal pump. IOP Conference Series: Earth and Environmental Science, 163(1): 012040 https://doi.org/10.1088/1755-1315/163/1/012040
[9] Prima, E.C., Munifaha, S.S., Salam, R., Aziz, M.H., Suryani, A.T. (2017). Automatic water tank filling system controlled using ArduinoTM based sensor for home application. Procedia Engineering, 170: 373-377. https://doi.org/10.1016/j.proeng.2017.03.060
[10] Lee, G.A. (1982). Turbidity measurement. Measurement and Control, 15(12): 450-451. https://doi.org/10.1177/002029408201501201
[11] Olorunsola, A.B., Ikumapayi, O.M., Oladapo, B.I., Alimi, A.O., Adeoye, A.O. (2021). Temporal variation of exposure from radio-frequency electromagnetic fields around mobile communication base stations. Scientific African, 12: e00724. https://doi.org/10.1016/j.sciaf.2021.e00724.
[12] Li, K., Lv, Z., Lu, K., Yu, P. (2014). Thermal-hydraulic modeling and simulation of the hydraulic system based on the electro-hydrostatic actuator. Procedia Engineering, 80: 272–281. https://doi.org/10.1016/j.proeng.2014.09.086
[13] Afolalu, S.A., Ikumapayi, O.M., Ogedengbe, T.S., Kazeem, R.A., Ogundipe, A.T. (2022). Waste pollution, wastewater and effluent treatment methods–An overview. Materials Today: Proceedings, 62: 3282-3288. https://doi.org/10.1016/j.matpr.2022.04.231
[14] Zoran, A. (2011). The 3D printed flute: Digital fabrication and design of musical instruments. Journal of New Music Research, 40(4): 379-387. https://doi.org/10.1080/09298215.2011.621541
[15] Jensen, J., Dayton, K. (2000). Detecting cavitation in centrifugal pumps. ORBIT, Second quarter, 25-30.
[16] D’Ausilio, A. (2012). Arduino: A low-cost multipurpose lab equipment. Behavior research methods, 44: 305-313. https://doi.org/10.3758/s13428-011-0163-z
[17] Bodunde, O.P., Adie, U.C., Ikumapayi, O.M., Akinyoola, J.O., Aderoba, A.A. (2019). Architectural design and performance evaluation of a ZigBee technology based adaptive sprinkler irrigation robot. Computers and Electronics in Agriculture, 160: 168-178. https://doi.org/10.1016/j.compag.2019.03.021
[18] Afolalu, S.A., Ikumapayi, O.M., Abdulkareem, A., Soetan, S.B., Emetere, M.E., Ongbali, S.O. (2021). Enviable roles of manufacturing processes in sustainable fourth industrial revolution-A case study of mechatronics. Materials Today: Proceedings, 44: 2895-2901. https://doi.org/10.1016/j.matpr.2021.01.099
[19] Liu, X.M., He, J., Zhao, J.Y., Long, Z., Li, W.H., Li, B.B. (2016). Biofluid flow through a throttle valve: A computational fluid dynamics study of cavitation. Journal of Mechanics in Medicine and Biology, 16(03): 1650034. https://doi.org/10.1142/S0219519416500342
[20] Gupta, A.K., Jha, V., Gupta, V.K. (2014). Design and development of remote controlled autonomous synchronic hexaroter aerial (ASHA) robot. Procedia Technology, 14: 51-58. https://doi.org/10.1016/j.protcy.2014.08.008
[21] Daraghmi, Y.A., Daadoo, M. (2017). Smart water leakage detection using wireless sensor networks. International Journal of Networks and Communications, 7(1): 1–16. https://doi.org/10.5923/j.ijnc.20170701.01
[22] World Health Organization. (2017). Water Quality and Health-Review of Turbidity: Information for Regulators and Water Suppliers (No. WHO/FWC/WSH/17.01). https://apps.who.int/iris/handle/10665/254631, accessed on May 11, 2023.
[23] Omar, A.F.B., MatJafri, M.Z.B. (2009). Turbidimeter design and analysis: A review on optical fiber sensors for the measurement of water turbidity. Sensors, 9(10): 8311-8335. https://doi.org/10.3390/s91008311
[24] Falkenberg, L.J., Styan, C.A. (2015). The use of simulated whole effluents in toxicity assessments: A review of case studies from reverse osmosis desalination plants. Desalination, 368: 3-9. https://doi.org/10.1016/j.desal.2015.01.014