Jakub Szymiczek
© 2020 IIETA. This article is published by IIETA and is licensed under the CC BY 4.0 license (http://creativecommons.org/licenses/by/4.0/).
OPEN ACCESS
Air density is a parameter used in numerous applications. Its correct determination can have a key impact on the outcome of an experiment. In calculation of the drag coefficient or pneumatic piping energy loss air density value is crucial for obtaining accurate results. In order to precisely measure this parameter, the electronic air density measuring device was designed and built. The following article presents design, construction, calibration and tests of the mentioned device. The device was designed with a target of reaching set assumptions. It was constructed with open-source programming environment and easily accessible components. Calibration of the device’s sensors was performed in order to ensure high accuracy of results. Calibration of the humidity sensor was performed with use of saturated salt solutions. Exemplary measurement was made to ensure device performance. Created tool provides excellent and cheap fulfillment of the assumptions set in the article.
air density measurement, saturated salt solutions, humidity calibration, moist air density
Air density is a parameter used in many fields of science and industry. Starting from aviation, refrigeration [1] to meteorology and agriculture [2]. In rough calculations this variable can be typically considered as constant. However, variations of the temperature, humidity and air composition cause it to change. In the temperature range from 0 to 25℃ and at the constant atmospheric pressure the air density increases by 9% [3]. Therefore, in precise measurements, the exact determination of air density has a key impact on the outcome of the experiment.
Wang et al. [4] built a device capable of measuring air density based on 4 parameters: temperature, pressure, humidity and CO2 content. The resulting air density was calculated based on CIPM-2007 equation [5].
Till now, in laboratory practice of the Department of Power Systems and Environmental Protection Equipment of the AGH University of Science and Technology, measurements of air density were performed using a method based on reading the values from the instruments (barometer, hygrometer and thermometer). Read values were used to calculate temperature-dependent tabulated values, finally allowing calculation of air density. This method is time-consuming and has a large error due to:
• low measuring resolution of analog sensors,
• misread by the person operating the device,
• placement of the instruments away from the tested system.
To eliminate these limitations an electronic measuring device can be used. Such a solution increases the accuracy of experiments and makes them much easier to perform. Possibility to make continuous measurements of the air density opens new measuring prospects. For example, correlation of the different results to the air density allows to eliminate disturbances caused by changes in density.
There are air density measuring devices available on the market. However, most of them were designed for engine tuning [6] that do not display numerical value of air density and do not provide continuous measurement. Another type of air density measuring instrument are air quality monitors [7]. They allow for continuous measurement. However, due to their different purpose and function of assessing air pollutants such devices are expensive, while they still do not display numerical air density.
Due to the fact that none of the available devices has been able to fulfill desired requirements, we decided to create our own device.
2.1 Design assumptions
In experiments including fluid mechanics or heat transfer, with air as a working fluid, the density of the medium (air) is the basic parameter required for the calculations. An example is the examination of heat exchange in the air/water heat pump evaporator. These experiments require accurate and continuous determination of the air density during measurements, due to thermal conductivity of air being dependent on temperature, pressure and humidity – components of air density. The value of the air density can also be required for other researches, like testing of air flows or acoustic measurements. Therefore, the mobility of the device is desirable in order to quickly change the place of measurement.
The feature of testing of air parameters in an exact point allows to increase the accuracy of the performed measurement in practice. Continuous measurement allows the value of density of air to be used as a variable in a function of air density and other variables. This can be used to investigate new relations, for example density of air and energetic efficiency. Another advantage is reduction of the measurement error by analysis of the instantaneous value of the air density.
In order to design a new measuring instrument, there was created a list of requirements:
• continuous measurement - capability to measure air density over time and save the results.
• accurate measurement - high accuracy sensors increase the importance of air density measurement in calculations and experiments, for example in air/water heat pumps.
• mobility - the device should be fitted with internal power supply in order to make the measurements independent from the power network. In addition, small dimensions and handheld character should allow easy use of the device in different laboratory stands.
• measurement at any point - many measuring stands require the sensor to be inserted into a narrow pipe. This requires the sensors to be separated from the main body of the instrument. The simplest solution is to install the sensors on an extended cable or connect them wirelessly.
• measurement of humidity and pressure at various points - when the measurement is performed in an intensive air flow, the pressure and humidity measurements must be made at various points.
When designing the instrument, the above assumptions were necessary to be met. The implementation of these assumptions is the main task of the new measurement instrument.
2.2 Construction of the device
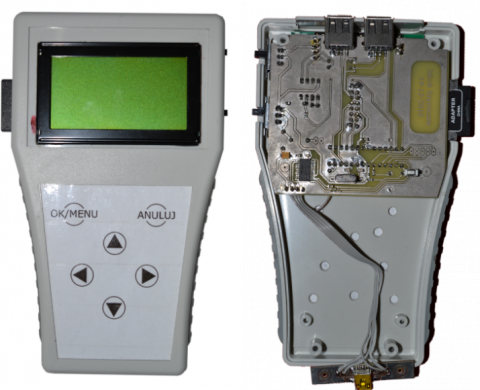
The assumptions presented in Section 2, especially the requirement regarding mobility had a key impact on the form and shape of the device (Figure 1). The integrated circuit and components have been placed in a plastic casing. The keyboard layout, screen and switches were placed in a manner that allow ergonomic use of the device.
Figure 1. Air density measuring device
The screen is intended to display the measured values and allows adjustments of the device settings. For this purpose, a monochrome LCD screen was chosen. It allows simultaneous display of the measured parameters: Temperature, humidity and air pressure as well as the calculated air density value. The screen backlight level is adjustable as a software setting. Also, a complete shutdown of screen is possible while the device is working. These functions were designed to extend the worktime on battery power.
The original keyboard has been used to limit the number of connections with the microprocessor. The displayed variables are saved on the SD card together with time. During the measurement the instrument is supplied from battery or via a USB port.
The interior of the device is an ATMega 328p microprocessor working on Arduino, a free environment that allows easy programming of devices. Additional elements required for the operation of the device are (Figure 2): USB converter for communication between the device and the computer; the power system to filter the power signal and enable alternating between battery and network supply; RTC clock for correlation of the measured values with time value and maintaining the time count when the instrument is turned off.
The whole device was mounted in a small handheld housing. Due to the necessary sensor connection, the upper part of the device are USB ports for easy, direct mounting of sensors or placing them on an extended cable.
Pressure and humidity sensors were used. These sensors are: Aosong electronics DHT22 humidity sensor [8] and Bosch model BMP085 pressure sensor [9]. They were selected for their availability, ease of assembly and measurement accuracy. Both sensors have built-in temperature sensor and allow temperature measurement.
Figure 2. Algorithm of the device measuring principle
All components have been mounted on a single printed circuit board. Only the keyboard and micro USB connection ensuring communication with the device have been mounted on separate, embedded in the housing, PCB boards.
The design and arrangement of the components was prepared in the EAGLE (Easily Applicable Graphical Layout Editor) program. This program simplifies the design of connections between components and creates a project of connection on a PCB. Three PCBs were made: main board, keyboard and USB connection board. Each one of them were protected with the Lichtenberg alloy. The challenge in design was to fit all components in a limited space, while ensuring ergonomic use of the device.
2.3 Calculation of air density
The mathematical description of codependence of air density and air parameters differs, depending on the adopted physical and mathematical models. These models allow the calculation of air density with accuracy depending on the number of variables analyzed.
The easiest way to calculate density is to use the ideal gas law; it assumes a simple relationship in which the variables are the air temperature and pressure. Accuracy of this measurement is reduced by a few percent in comparison with the used model due to the fact that water vapor in the composition of the air is omitted.
To increase the measurement accuracy of the device it is possible to calculate the air density by analyzing the chemical composition [10]. However, such an analysis requires stable conditions and a measuring chamber. Therefore, it would not be possible to meet the mobility requirements and conduct a quick and simple analysis on the existing test stand.
One of most widely used air density models is CIPM-2007 equation [5]. Except basic parameters of temperature, pressure and relative humidity, the air density in this model is also dependent on composition of air.
In order to obtain higher accuracy, while ensuring mobility of the device, the moist air density model was used. In this model, atmospheric air density is dependent on three varying parameters: temperature, pressure and relative humidity of the air.
According to Dalton’s law [3] pressure of gas mixture is sum of partial pressures of mixture components:
$p=p_{a}+p_{v}(1)$ (1)
By application of Dalton’s law - moist gas density is equal to sum of dry air and water vapor density at their corresponding partial pressure:
$\rho=\rho_{a}+\rho_{v}$ (2)
Applicating ideal gas law:
$\rho=\frac{p_{a}}{R_{a} \cdot T}+\frac{p_{v}}{R_{v} \cdot T}$ (3)
Water vapor partial pressure can be presented as ratio of water vapor pressure at corresponding temperature and relative humidity. Air pressure is the difference between measured pressure and previously mentioned ratio:
$\rho=\frac{p-R H \cdot p_{s}}{R_{a} \cdot T}+\frac{R H \cdot p_{s}}{R_{v} \cdot T}$ (4)
In the second part of Eq. (4), by applying ideal gas law, a vapor-liquid equilibrium density at corresponding temperature is obtained. The final moist air density model for the designed device is described as:
$\rho=\frac{p-R H \cdot p_{s}}{R_{a} \cdot T}+R H \cdot \rho_{p}^{\prime \prime}$ (5)
In addition to the measured air pressure, temperature and humidity, there are two temperature-dependent values in the Eq. (5): water vapor pressure and vapor-liquid equilibrium density.
Until now, these values were tabulated and read for the given measured temperature. In order to calculate them in a device with limited computing power, there were prepared polynomial approximation of the tabulated data and the temperature was limited to a range of 0℃ to 40℃.
A polynomial approximation of third degree was applied. A higher order equation would allow for higher accuracy; however, it would increase computational demand. This would result in reduced battery lifetime, lower sampling rate and then lower accuracy of the results in a varying measurement condition.
Figure 3. Water vapor pressure as function of a temperature
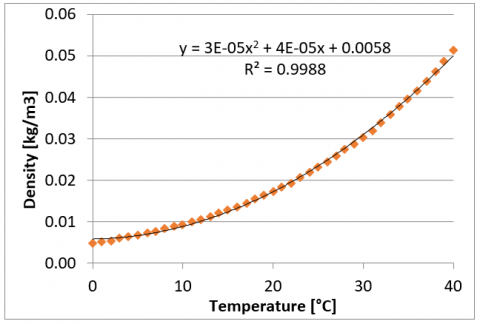
Figure 4. Vapor-liquid equilibrium density as function of a temperature
Figure 3 and Figure 4 present functions approximating tabulated values in Eq. (1) and the coefficient of determination (R2) resulting from the approximation. In both cases, the R2 value was higher than 0.998, which is sufficient for the performed task. As a result, we obtained the following formulas:
$p_{s}=4.118 \cdot T^{2}-4.178 \cdot T+775.7$ (6)
$\rho_{p}^{\prime \prime}=0.00003 \cdot T^{2}-0.0004 \cdot T+0.0058$ (7)
The above equations complement the set of data needed for the operation of the device.
2.4 Humidity calibration
The sensors used in the instrument have their accuracy specified by the manufacturer [8, 9]. However, in order to ensure this accuracy, additional calibrations were done. In case of a pressure sensor, the scaling was performed by comparing the values with the reference sensor, the discrepancies between the calibrated and the reference sensor were smaller than their measuring resolution.
Calibration of the humidity sensor was not possible as a comparison with the standard, as none of the sensors available had greater accuracy then calibrated sensor.
Calibration of the humidity sensor was performed with saline solution [11-13]. By creation of a supersaturated solution of salt in water, in vessel of a limited volume - the air humidity stabilizes at a certain level. Of the many salts available, those that provide representative humidity values were selected. This means that the air humidity values should be evenly distributed in the range from zero to maximum humidity.
Table 1 contains the air humidity values resulting from the preparation of super-saturated solutions of the corresponding salts at a specified temperature. The salts selected for the solution are characterized by good temperature stability, relatively low cost and ease of purchase. Selected substances are non-toxic and do not cause a hazard during the test.
By enclosing the supersaturated solution and the humidity sensor in a small volume of air, almost perfect calibration of the hygrometer was obtained. Calibration was performed for each of the above compounds. During calibration, temperature value was recorded to compensate for temperature-based change in humidity. By using several measuring points, for different humidity values, it was possible to derive a calibration factor.
Table 1. Air Humidity provided by selected salts solutions in a selected temperature range [14]
|
Temperature [°C] |
Potassium acetate CH3COOK [%] RH |
Potassium carbonate K2CO3 [%] RH |
Sodium chloride NaCl [%] RH |
|
20 |
23.1 ± 0.3 |
43.2 ± 0.4 |
75.5 ± 0.2 |
|
25 |
22.5 ± 0.4 |
43.2 ± 0.4 |
75.3 ± 0.2 |
|
30 |
21.6 ± 0.6 |
43.2 ± 0.5 |
75.1 ± 0.2 |
Figure 5. Calibration with salt solution: potassium acetate CH3COOK
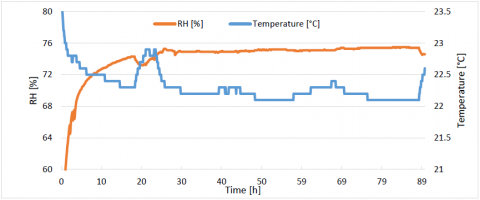
Figure 6. Calibration with salt solution: Potassium carbonate K2CO3
Figure 7. Calibration with salt solution: sodium chloride NaCl
For the lowest humidity value, the calibration was performed with the potassium acetate solution (Figure 5). The test was conducted for over 70 hours. This allowed for exact stabilization of air humidity. Relative humidity (RH) stabilized at a value of 26.4%. This value is overstated. The theoretical value should be exactly 22.9%. The shape of the humidity graph suggests that the conditions were stabilized and the humidity value has reached asymptote. Temperature fluctuations were insignificant, less than 0.5℃.
Calibration for potassium carbonate solution (Figure 6) was performed for 110 hours. During this period of time, the air humidity stabilized at the level of 45.6%. The theoretical value resulting from the salt solution used is 43.2%. The shape of the graph shows that the conditions have completely stabilized. Two temperature fluctuations of 1℃ have occurred at the first halve of the measurement, these fluctuations had low to none effect on the final humidity value.
Calibration with sodium chloride solution (Figure 7) took place for 90 hours. During this period, the thermodynamic conditions were fully stabilized. Humidity reached 75.3%. The humidity resulting from the theoretical value for the solution used is 75.1%. A slight temperature fluctuation occurred during twentieth hour of calibration, which did not have a significant effect on the overall humidity curve.
The obtained values allowed to create a calibration factor that ensured right accuracy. After calibration the instrument was ready for use in real measurements.
Calibrated and fully-operational device was used in exemplary measurements. The aim of the performed experiment was the measure air density, pressure, humidity and temperature during operation of an air-to-water compressor heat pump. The parameters were measured during the initial 15 minutes of the heat pump's operation. The measuring sensors were mounted on an extended cable connection and placed close to the surface of the evaporator lamella. It was important to maintain a minimum distance between the fins and the sensor, so that they would not come in direct contact. It could lead to temperature value being falsified by measuring temperature of the lamella. View of the device during measurement is shown in Figure 8.
The results obtained during the test measurement were saved on the SD card (Figure 9). During the test, sampling time was set to one second.
Figure 8. The device during test measurement
Temperature and humidity values changed as expected during heat transfer from air to heat exchanger. The "tearing" of the pressure value was a result of a pressure variations similar to the measurement resolution of a pressure sensor. Pressure varied within a range of 90 Pa. By calculating air density value in extreme values of barometric pressure and comparing them to each other, it can be concluded that this was a negligible value, influencing the air density value under 0.1%.
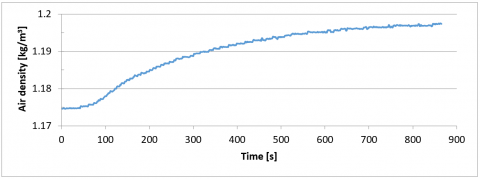
These values were the input data for the air density calculations performed using, humid air model (Eq. (5)). Results are shown in Figure 10.
The air density value calculated by the device agrees with the resulting calculation for specific points. We conclude that the device works properly and meets the set requirements.
The relative effect of increased measurement accuracy obtained by air density calculation based on Eq. (5) can be measured by comparison with standard value of air density.
For the parameters of the test results (Pressure = 100775 Pa, Temperature = 19℃, Humidity = 62%) air density calculated by the device was 1.196 kg/m3.
The standard value of air density is 1.293 kg/m3 [3]. The relative error between these values is 8.5 % and therefore use of the device ensures higher accuracy of performed experiments.
Figure 9. Results of measured air parameters during test measurement
Figure 10. Air density calculated by the device
The purpose of this paper is creation of the device for a fast and accurate measurement of air density parameters. For this reason, the design, construction, calibration and tests were performed. The device was built using easily accessible electronic parts. The main conclusions are as follows:
(1) The mathematical model adopted for the air density measurement allowed calculation of air density based on parameters of air temperature, pressure and humidity.
(2) The calibration of humidity was performed in a simple, repeatable method. The saturated salts method used for humidity calibration was easily applicable and ensured high accuracy of performed humidity measurement.
(3) During testing, the device worked flawlessly in continuous measurement. Avoided measurement error obtained by application of the device was 8.5% in comparison with standard value of air density.
(4) The future research directions are experiments regarding heat exchange between air and evaporator in different values of temperature, pressure and humidity. This study can be used to increase energetic efficiency of air heat pumps.
|
p |
[Pa] |
moist air pressure |
|
$p_{a}$ |
[Pa] |
dry air Partial pressure |
|
$p_{v}$ |
[Pa] |
water vapor Partial pressure |
|
$\rho$ |
[kg/m3] |
moist air density |
|
$\rho_{a}$ |
[kg/m3] |
dry air density |
|
$\rho_{v}$ |
[kg/m3] |
water vapor density |
|
$R_{a}$ |
[J/kg∙K] |
dry air gas constant |
|
$R_{v}$ |
[J/kg∙K] |
water vapor gas constant |
|
$T$ |
[°C] |
air temperature |
|
$T$ |
[s], [h] |
time |
|
RH |
[%] |
relative humidity |
|
Ps |
[Pa] |
water vapor pressure at corresponding temperature |
|
$\rho_{p}^{\prime \prime}$ |
[kg/m3] |
vapor -liquid equilibrium at corresponding temperature |
[1] Balicki, W., Głowacki, P., Szczecinski, S., Chachurski, R., Szczeciński, J. (2014). Effect of the atmosphere on the performances of aviation turbine engines. Acta Mechanica et Automatica, 8(2): 70-73. https://doi.org/10.2478/ama-2014-0012
[2] Prakash, O., Szarma, R. (2012). Estimation of air density and its importance in barometric pressure measurements. 2nd National Conference on Advances in Metrology (Admet 2012), No. PM002.
[3] Moran, M.J., Shapiro, H.N. (2010). Fundamentals of Engineering Thermodynamics. John Wiley & Sons.
[4] Wang, X., Zhang, Y., Cai, Z.Q., Wang, J., Zhong, R.L., Yao, H., Ding, J.A. (2012). Research on Air density Measurement for measuring weights. 20th IMEKO World Congress, pp. 739-741.
[5] Picard, A., Davis, R., Glaser, M., Fujii, K. (2008) Revised formula for the density of moist air (CIPM-2007). Metrologia, 45(2): 149-155. https://doi.org/10.1088/0026-1394/45/2/004
[6] Longacre Racing Digital Air Density Gauge 70% - 130%. http://www.longacreracing.com, accesed on Oct. 30, 2019.
[7] Raeco E-Instruments AQ Pro Handheld Indoor Air Quality Monitor. http://www.raeco.com/ accesed on Oct. 30, 2019.
[8] Aosong Electronics Co. Digitial-output realtive humidity & temperature sensor/module DHT22, datasheet. https://www.sparkfun.com/datasheets/Sensors/Temperature/DHT22.pdf, accesed Oct. 30, 2019.
[9] Bosch BMP085 Digital pressure sensor. datasheet. https://www.sparkfun.com/datasheets/Components/General/BST-BMP085-DS000-05.pdf, accesed on Oct. 30, 2019.
[10] Picard, A., Fang, H. (2003). Three methods of determining the density of moist air during mass comparisons. Metrologia, 39(1): 31. https://doi.org/10.1088/0026-1394/39/1/5
[11] OIML International Recommendation. (1996). The scale of realtive humidity of air certified against saturated salt solutions. https://www.oiml.org/en/publications/recommendations/publication_view?p_type=1&p_status=1.
[12] ASTM International. (2012). Standard Practice for Maintaining Constant Relative Humidity by Means of Aqueous Solutions. https://doi.org/10.1520/E0104-20A
[13] The Institute of Measurement and Control. (1996). A Guide to the Measurement of Humidity. https://www.humidity-calibration.eu/resources/a_guide_to_the_measurement_of_humidity.pdf.
[14] Greenspan, L. (1977). Humidity fixed points of binary saturated aqueous solution. Journal of research of the National Bureau of Standards - A. Physics and Chemistry, 81(1): 89-96.