
Ramgopal Reddy Bijjam* | Srinivas Chandanam | Deva Raj Chilakala
© 2026 The authors. This article is published by IIETA and is licensed under the CC BY 4.0 license (http://creativecommons.org/licenses/by/4.0/).
OPEN ACCESS
Fiber-reinforced composite materials are increasingly adopted in today’s manufacturing environment due to their excellent specific strength, resistance to corrosion, and tailorability. However, machining these materials, particularly through computer numerical control (CNC) milling, remains a significant challenge because of their abrasive and heterogeneous nature. This study investigates and compares the machinability of glass/epoxy and jute/epoxy composites using two statistical optimization techniques: the Taguchi method and response surface methodology (RSM). Four machining variables, such as rotational spindle speed (S), feed rate (FR), depth of cut (DOC), and tool diameter (D), were optimized to achieve minimal surface roughness (Ra) and maximum material removal rate (MRR). The influence of process parameters was analyzed using signal-to-noise ratios (S/N ratios) and analysis of variance (ANOVA). DOC showed the greatest influence on MRR for both composites, followed by FR, while the dominant factor for Ra was material-dependent. For jute/epoxy, FR was the only parameter with a statistically significant effect on Ra (p < 0.05), whereas for glass/epoxy, both FR and DOC were significant, with DOC exerting the strongest influence. The optimal parameters for maximum MRR were 3000 rpm rotational spindle speed (S), 200 mm/min FR, 3 mm DOC, and 12 mm tool diameter (D). Response-table optimization identified this combination as yielding the highest predicted MRR, while the highest MRR recorded across the experimental trials was 400 mm³/s. The lowest Ra recorded was 2.32 µm for jute/epoxy and 3.21 µm for glass/epoxy, confirming measurable machining quality improvements from the optimization process. Glass/epoxy exhibited lower Ra, while jute/epoxy provided better sustainability and lower material cost. These findings support improved machining strategies for composite materials, enabling higher quality and cost-efficient manufacturing.
computer numerical control milling, optimization, milling parameters, jute/epoxy, glass/epoxy, Taguchi method, response surface methodology
Composite materials have revolutionized multiple industries through their superior specific strength, corrosion resistance, and ability to be designed for particular applications. By combining two or more distinct materials, composites offer properties that often exceed those of traditional engineering materials such as metals and alloys [1-3].
One of the major industries benefiting from composites is aerospace, where fiber-reinforced polymers (FRPs) allow substantial weight reduction in components without compromising mechanical integrity. This reduction leads directly to improved fuel efficiency and performance [4-7]. Among FRPs, glass fiber-reinforced polymers (GFRPs) dominate global markets due to their excellent mechanical properties, environmental durability, and cost-effectiveness [8-11].
However, the production and disposal of synthetic fiber composites present ecological and financial limitations. Natural fibers like jute offer a renewable, biodegradable, and cost-efficient alternative [12-15]. Jute, often called the “golden fiber,” occupies the second rank in terms of usage of plant-based fiber globally. It comprises mainly cellulose, hemicellulose, and lignin [16, 17], offering good mechanical performance at low cost. Nonetheless, natural fibers face issues including moisture sensitivity, weaker adhesion to resins, and variability in properties [18-21].
Natural fiber reinforced composites (NFRCs) are typically fabricated through the hand lay-up technique due to its ease of use, inexpensive tooling, and suitability for fiber mat laminates [22-27]. Machining remains a critical step in shaping these components for end-use. Among machining methods, milling is widely employed due to its versatility and precision. However, improper selection of machining parameters can lead to poor surface finish, excessive tool wear, and increased production costs.
Optimization methods are therefore essential for achieving high-quality machining at minimal cost. Statistical tools like the Taguchi approach and response surface methodology (RSM) are generally utilized in manufacturing for parameter optimization. Taguchi’s approach reduces the experimental runs conducted by employing orthogonal arrays, allowing efficient screening of significant factors [28-34]. RSM, based on regression modeling and factorial designs, explores the interaction between parameters, enabling fine-tuned optimization [29-35].
Earlier studies have shown the effectiveness of these techniques in machining composites. Rajendran et al. optimized cutting parameters for jute fiber composites [36]; Muche et al. reported the effect of rotational spindle speed (S) and depth of cut (DOC) on end milling of natural fibers [37], and Ramulu et al. observed improvements in surface finish with increased cutting speed for polymer composites [38]. Palanikumar et al. applied Taguchi and analysis of variance (ANOVA) approaches to minimize surface roughness (Ra) in GFRP machining [39, 40].
Although the studies cited above confirm that both Taguchi analysis and RSM are effective for optimizing the machining parameters of composite materials, none of them has directly compared a synthetic and a natural fibre system, machined and optimized under the same experimental conditions, using both methods together. Consequently, manufacturers currently have little basis for judging whether jute/epoxy, despite its environmental and cost advantages, can be milled to a surface finish comparable with the industry-standard glass/epoxy system, or for deciding which optimization approach is better suited to each material. This study presents a comparative study of the milling performance of jute/epoxy and glass/epoxy composites using an integrated optimization approach based on the Taguchi method, ANOVA, and RSM. The work sets out, in particular, to determine the Ra and material removal rate (MRR) achieved when milling each composite, to identify which process parameters most strongly govern these two responses for each material, and to derive material-specific parameter settings, through Taguchi and RSM optimization, that jointly minimise roughness while maximising removal rate. Unlike previous studies that primarily focused on a single composite system or a single optimization technique, the proposed methodology simultaneously evaluates Ra and MRR under identical machining conditions while identifying material-dependent machining behaviour. This study provides material-specific optimization guidelines and predictive models to improve machining performance while advancing the understanding of sustainable composite machining.
Glass fiber mat and jute fiber mat were employed as reinforcement materials for the fabrication of composite laminates. The jute fiber mat possesses a density of 1.3 g/cm³, an elongation of 1.7%, a tensile strength of 230 MPa, and an elastic modulus of 26.5 GPa. In comparison, the glass fiber mat had a density of 2.6 g/cm³, an elongation of 2.75%, a tensile strength of 2500 MPa, and an Elastic Modulus of 75 GPa. These distinct mechanical characteristics provided an effective basis for evaluating the comparative machinability of FRP composites with natural and synthetic fibers. The matrix system consisted of LY556 epoxy and HY951 curing agent, which together possessed a density of about 1.2 g/cm³, a tensile strength of 75 MPa, and an elastic modulus of 3 GPa. The jute fiber mat & glass fiber mat are purchased from Go Green Products from Chennai, India. LY556 epoxy and HY951 curing agent are procured from Bindu Agencies in Vijayawada.
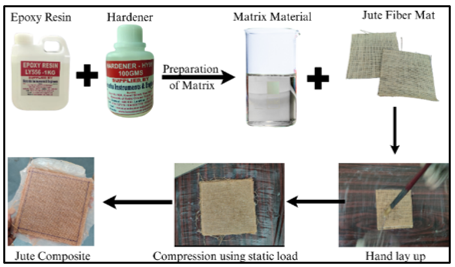
The hand lay-up technique is among the most widely used and straightforward processes for fabricating FRP composites [41]. In this study, the matrix system comprised epoxy resin with 10% hardener by weight. Prior to fabrication, the jute and glass fiber mats were shaped to conform to the specified dimensions to match the mold size. The amount of resin and reinforcement was carefully calculated to achieve the desired fiber volume fractions. For the composites of jute/epoxy, a fiber volume fraction of 25% and a resin volume fraction of 75% were maintained. The mold surface was thoroughly cleaned and treated with a release agent to allow easy removal of the cured laminate. The top layer of jute fiber mat was positioned on the mold, followed by the application of resin. The resin was spread evenly to fully impregnate the fiber, and a roller was employed for the removal of entrapped air and to ensure proper wetting. This process of alternating fiber layers and resin was repeated until the predetermined quantity of materials was used. A polythene sheet was then placed over the stacked layers, and the top plate was positioned to ensure uniform thickness. The assembly was subjected to static loading for 24 hours at ambient conditions to allow complete curing. Once cured, excess fibers were trimmed from the edges to obtain a clean specimen.
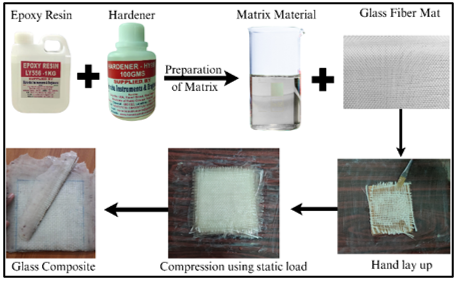
The same fabrication procedure was followed for the glass/epoxy composites. In this case, the fiber and resin were maintained at equal volume fractions of 50 vol% fiber and 50 vol% resin. The illustrative schematic of the hand lay-up technique employed in the production of the jute/epoxy and glass/epoxy laminates is presented in Figures 1 and 2, respectively.
Figure 1. Graphical representation of the hand lay-up technique of jute/epoxy composite
Figure 2. Graphical representation of the hand lay-up technique of glass/epoxy composite
Each laminate was built up from four plies of fiber mat arranged in a 0°/90° cross orientation, yielding a nominal cured thickness of 4 ± 0.2 mm for both the jute/epoxy and glass/epoxy panels. Curing took place at room temperature 28 ℃ under static load for 24 h, and the laminates were then allowed a further 24 h post-cure at room temperature before any machining was carried out. Once trimmed, specimens intended for milling were cut to a nominal size of 150 mm × 100 mm × 4 mm. Controlling the ply count, orientation, and cured thickness in this way ensured that variations in Ra and MRR observed between the two composites could be attributed to the reinforcement type rather than to differences in laminate geometry.
Prior to initiating the machining operation, a systematic design of experiments (DOE) approach was employed to establish an optimal number of trials capable of generating comprehensive and reliable data. For this investigation, the Taguchi method with an L9 orthogonal array was implemented to plan nine experimental runs efficiently. The selection of process variables and their corresponding levels was guided by the operational limits of the machine tool. A broad range of parameter levels was deliberately chosen to better capture the effect of machining variables on the Ra over an extended range. Machining trials were performed at spindle speeds of 1000-5000 rpm and feed rates of 100-200 mm/min, within the operating capacity of the 4-axis computer numerical control (CNC) milling machine. The DOC and end-mill tool diameter (D) were set at 1-3 mm and 10-16 mm, respectively, based on laminate thickness and tooling availability. Preliminary trials were conducted to eliminate conditions causing edge delamination or excessive vibration, after which three practical levels were selected for each variable. The chosen ranges are consistent with previous studies on fibre-reinforced composite milling [36, 37, 39, 40], supporting the selection of spindle speed and feed rate (FR) as key variables affecting Ra and MRR.
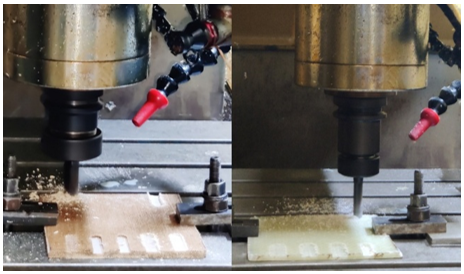
The finalised variables, along with their levels, are listed in Table 1. Once the design was established, milling operations were performed on both glass/epoxy and jute/epoxy composite specimens. All machining trials were performed using a 4-Axis CNC vertical milling machine, ensuring consistent cutting conditions across all tests. The experimental configuration for the milling operation is shown in Figure 3.
Table 1. Process parameters and levels for roughness measurement
|
Input Parameters |
Level 1 |
Level 2 |
Level 3 |
|
Rotational Speed of Spindle (S in rpm) |
1000 |
3000 |
5000 |
|
Feed Rate (FR in mm/min) |
100 |
150 |
200 |
|
Depth of Cut (DOC in mm) |
1 |
2 |
3 |
|
Tool Diameter (D, mm) |
10 |
12 |
16 |
Figure 3. Machining of jute/epoxy & glass/epoxy composites
4.1 Calculation of surface roughness
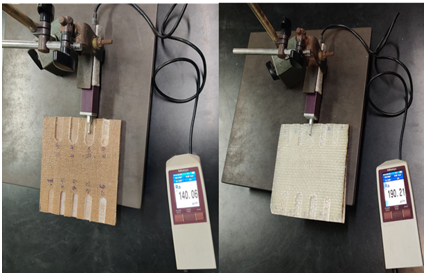
The Ra of the machined specimens was evaluated with a Form Talysurf 50 surface profilometer, manufactured by Taylor Hobson Co Ltd. This precision instrument is designed to assess surface texture, form, and contour with high accuracy. It operates on a stylus-based mechanism, where a fine stylus traverses the machined surface and detects variations in height. These variations cause a displacement of the armature, which in turn modulates the alternating current in the coil, converting mechanical movement into an electrical signal. For each specimen, the roughness was recorded over a sampling length of 5-8 mm, and the results were expressed in micrometres (µm). This ensured consistent and reliable surface characterization across all test samples. The instrument and the measurement setup are illustrated in Figure 4.
Figure 4. Measuring surface roughness (Ra) of jute/epoxy & glass/epoxy composites
4.2 Calculation of material removal rate
The experimental trials were conducted following the L9 orthogonal array derived from the Taguchi method. Milling operations on the composite specimens were carried out following the specific parameter combinations assigned to each experimental run. The MRR, expressed in mm³/s, was determined to evaluate machining performance.
MRR was calculated using a standard mathematical relationship that considers the variation in weight or volume of the workpiece pre- and post-machining, along with the machining time. This approach ensures a consistent and accurate estimation of the MRR during the milling process.
The formula to determine the MRR is given in Eq. (1).
$\mathrm{MRR}=D_o D_f V_f \mathrm{~mm}^3 / \mathrm{sec}$ (1)
where,
Dp = Depth of cut-axial, mm
Dr = Depth of cut-radial, mm
Vf = Velocity of Feed, mm/min
The results of the machining obtained for the glass/epoxy and jute/epoxy composite specimens are summarized in Table 2, while the corresponding calculated MRR values for both materials are listed in Table 3.
Table 2. Experimental results of the jute/epoxy & glass/epoxy composites
|
No. |
S |
FR |
DOC |
D |
Ra-Jute |
Ra-Glass |
|
1 |
1000 |
100 |
1 |
10 |
7.59 |
4.83 |
|
2 |
1000 |
150 |
2 |
12 |
4.45 |
4.64 |
|
3 |
1000 |
200 |
3 |
16 |
2.32 |
5.47 |
|
4 |
3000 |
100 |
2 |
16 |
4.89 |
4.80 |
|
5 |
3000 |
150 |
3 |
10 |
3.39 |
5.99 |
|
6 |
3000 |
200 |
1 |
12 |
2.85 |
3.75 |
|
7 |
5000 |
100 |
3 |
12 |
5.33 |
6.07 |
|
8 |
5000 |
150 |
1 |
16 |
3.57 |
3.21 |
|
9 |
5000 |
200 |
2 |
10 |
3.11 |
4.50 |
Table 3. Calculated material removal rate (MRR) results of the jute/epoxy & glass/epoxy composites
|
No. |
Vf mm/min |
Dp mm |
Dr mm |
MRR mm3/sec |
|
1 |
100 |
1 |
40 |
66.67 |
|
2 |
150 |
2 |
40 |
200 |
|
3 |
200 |
3 |
40 |
400 |
|
4 |
100 |
2 |
40 |
133.33 |
|
5 |
150 |
3 |
40 |
300 |
|
6 |
200 |
1 |
40 |
133.33 |
|
7 |
100 |
3 |
40 |
200 |
|
8 |
150 |
1 |
40 |
100 |
|
9 |
200 |
2 |
40 |
266.67 |
5.1 Regression equation
Mathematical Expressions (2) and (3) describe the relationships used to calculate the Ra for jute/epoxy and glass/epoxy composites, respectively, while Eq. (4) provides the formula for determining the MRR. These equations incorporate the key process variables such as rotational spindle speed (S), FR, DOC, and tool diameter (D), and are based on the assumption of linear behaviour.
By applying these regression models, Ra and MRR can be estimated using mathematical expressions for all combinations of the selected process variables. Analysis of the regression results indicates that all input variables significantly affect Ra, with DOC exhibiting the most pronounced influence for both composite types. The derived regression equations thus provide a reliable predictive tool for evaluating the machining performance of jute/epoxy and glass/epoxy composites.
$\begin{gathered}\mathrm{R}_{\mathrm{a}} \text {-Jute}=12.78-0.000196 \mathrm{~S}-0.03177~ \mathrm{FR}-0.495\text { DOC }-0.1796~ \mathrm{D}\end{gathered}$ (2)
$\begin{aligned} \mathrm{R}_{\mathrm{a}} \text {-Glass }= & 5.431-0.000097 \mathrm{~S}-0.00660 ~\mathrm{FR}+ 0.957 ~\mathrm{DOC}-0.0993~ \mathrm{D}\end{aligned}$ (3)
$\begin{gathered}\mathrm{MRR}=-190.1-0.00833 \mathrm{~S}+1.333 ~\mathrm{FR}+100.0 ~\mathrm{DOC}+1.19\end{gathered}$ (4)
5.2 Main effect plots
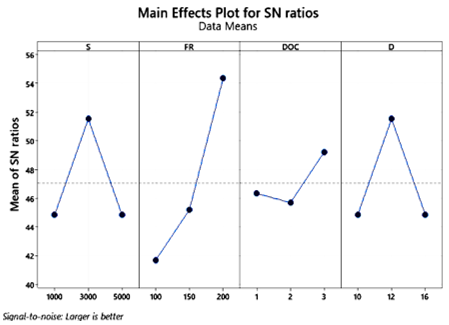
The main effect plots provide insight into how each machining variable influences the machining quality. The steepness of the line in these plots indicates the magnitude of a parameter's effect: a steeper slope corresponds to a stronger influence. Figure 5 depicts the impact of machining parameters on the average MRR for the glass/epoxy and jute/epoxy composites
Figure 5. Primary response plots depicting material removal rate (MRR) behavior in glass/epoxy and jute/epoxy composites
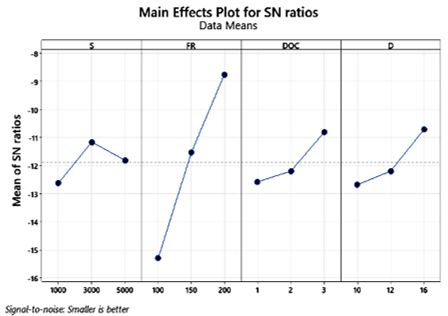
From the four variables analysed, FR exhibits the most significant gradient, highlighting its dominant effect on the MRR. Even minor adjustments in FR can lead to significant changes in MRR, and therefore, it is recommended to maintain this parameter close to its optimal value. In contrast, tool diameter (D) shows a gradual slope, indicating an average effect on Ra, allowing for small variations if necessary. Speed of spindle (S) and DOC display relatively gentle slopes, suggesting minimal influence. This implies that these parameters can be tuned across the chosen limits without substantially affecting the machining performance.
During the machining of jute/epoxy composite, the FR again exhibits the steepest slope, confirming its dominant effect on Ra. In comparison, the tool diameter (D) shows a moderate slope, suggesting that only moderate adjustments to this parameter are advisable. As with the previous analysis, speed of spindle and DOC demonstrate minimal influence, allowing these parameters to be set at any value within the chosen range without significantly affecting Ra. Figure 6 presents the main effect plot of the glass/epoxy composite. The dominant influence of FR on MRR agrees with the observations of Rajendran et al. [36] and Muche et al. [37], who reported that increasing FR improves material removal efficiency. However, the present comparative analysis further shows that the magnitude of this response depends on the reinforcement type. This indicates that fibre characteristics influence machining performance in addition to the selected process parameters, emphasizing the importance of material-specific optimization. Furthermore, recent investigations [14, 19, 21, 41] on natural and synthetic fibre composites have reported similar trends, but most studies evaluated only a single material system. By comparing jute/epoxy and glass/epoxy under identical machining conditions, the present work demonstrates that reinforcement characteristics govern the sensitivity of machining parameters, providing a stronger scientific basis for material-specific process optimization.
Figure 6. Primary response plots depicting surface roughness (Ra) for jute/epoxy composites
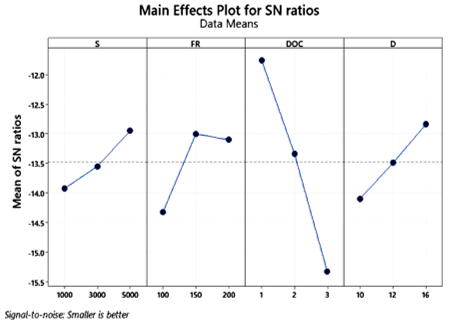
During the machining of glass/epoxy composites, the DOC exhibits the steepest slope, suggesting it has the most significant influence on Ra. In comparison, the tool diameter (D) and FR show moderate slopes, indicating that adjusting these parameters moderately is advisable. The parameter S, on the other hand, can be maintained at any value within the chosen range without substantially affecting the surface finish. Figure 7 presents the main effect plot for the glass/epoxy composite. The higher influence of DOC indicates that brittle glass fibres are more susceptible to matrix cracking and fibre fracture at increased cutting loads, whereas the greater compliance of jute fibres promotes fibre bending and pull-out. Glass fibres have a high elastic modulus and low elongation at break, so as DOC increases, the cutting edge tends to shear the fibres cleanly with limited elastic recovery, producing localized brittle fracture and micro-cracking of the surrounding matrix that raises Ra sharply once the DOC exceeds a critical value. Jute fibres, in contrast, are more compliant and undergo elastic bending ahead of the tool edge before failure; at low feed and DOC, this bending allows the fibre to be sheared cleanly, but as FR increases, the fibre is more often pulled out of the matrix rather than cut, leaving open cavities, fibrillation, and torn surface texture that dominate the roughness of jute/epoxy specimens. This explains why FR, which governs the fibre-tool engagement time, is the dominant factor for jute/epoxy Ra, while DOC, which governs the stress magnitude imposed on the stiffer glass fibres, dominates for glass/epoxy. This mechanistic interpretation agrees with recent studies [14, 21, 41] on fibre-reinforced polymer machining and explains the different surface responses observed.
Figure 7. Primary response plots depicting surface roughness (Ra) for glass/epoxy composites
5.3 Analysis of variance
ANOVA was performed for two composite materials, such as glass/epoxy and jute/epoxy, to evaluate their effects on MRR and Ra at a 95% confidence level. Tables 4 and 5 list the ANOVA analysis results for the jute/epoxy and glass/epoxy composites. The analysis indicated that the type of reinforcement influences the dominant factors affecting Ra. For the jute/epoxy composite shown in Table 4, only FR was statistically significant at the 95% confidence level (p = 0.003); DOC (p = 0.124) and D (p = 0.098) showed a comparatively minor, statistically non-significant influence, and speed of spindle (p = 0.199) was the least influential factor. For the glass/epoxy composite shown in Table 5, both DOC (p = 0.001) and FR (p = 0.043) were statistically significant, with DOC exerting the dominant effect; D (p = 0.054) was marginally non-significant, and speed of spindle (p = 0.161) remained the least significant factor. These findings suggest that the S parameter can be set with greater flexibility during the machining of both composites.
Table 4. Analysis of variance (ANOVA) results for surface roughness (Ra) of the jute/epoxy composite
|
Source |
DF |
Adj SS |
Adj MS |
F-Value |
p-Value |
|
S |
1 |
0.9204 |
0.9204 |
2.36 |
0.199 |
|
FR |
1 |
15.1368 |
15.1368 |
38.79 |
0.003 |
|
DOC |
1 |
1.4702 |
1.4702 |
3.77 |
0.124 |
|
D |
1 |
1.8072 |
1.8072 |
4.63 |
0.098 |
|
Error |
4 |
1.5610 |
0.3903 |
|
|
|
Total |
8 |
20.8956 |
|
|
|
Table 5. Analysis of variance (ANOVA) results for surface roughness (Ra) of the glass/epoxy composite
|
Source |
DF |
Adj SS |
Adj MS |
F-Value |
p-Value |
|
S |
1 |
0.2243 |
0.22427 |
2.95 |
0.161 |
|
FR |
1 |
0.6534 |
0.65340 |
8.61 |
0.043 |
|
DOC |
1 |
5.4913 |
5.49127 |
72.34 |
0.001 |
|
D |
1 |
0.5520 |
0.55203 |
7.27 |
0.054 |
|
Error |
4 |
0.3036 |
0.07591 |
|
|
|
Total |
8 |
7.2246 |
|
|
|
The DOC was recognized as the primary variable affecting the MRR of both composites, whereas tool diameter (D) had the least effect. This indicates that careful selection of the DOC is essential when machining these composites. Table 6 lists the results of ANOVA for both composites. In contrast to earlier studies [36, 37, 40] that identified significant parameters for individual composites, the present analysis demonstrates that the dominant machining factor changes with reinforcement type. This finding highlights that parameter optimization should be tailored to the composite architecture rather than applying a common machining strategy.
Table 6. Analysis of variance (ANOVA) results for material removal rate (MRR) of the jute/epoxy & glass/epoxy composites
|
Source |
DF |
Adj SS |
Adj MS |
F-Value |
p-Value |
|
S |
1 |
1666.8 |
1666.8 |
2.47 |
0.191 |
|
FR |
1 |
26666.2 |
26666.2 |
39.52 |
0.003 |
|
DOC |
1 |
60000.0 |
60000.0 |
88.93 |
0.001 |
|
D |
1 |
79.3 |
79.3 |
0.12 |
0.749 |
|
Error |
4 |
2698.8 |
674.7 |
|
|
|
Total |
8 |
91111.1 |
|
|
|
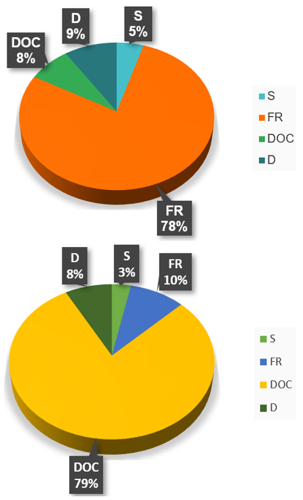
Figure 8 illustrates the F-values and proportional impacts of the various input parameters on Ra. FR was found to be the most critical factor for the jute/epoxy composite, having an F-value of 38.79, accounting for 78% of the contribution to Ra. Tool diameter (D) was the next factor, with an F-statistic of 4.63 and an impact level of 9%, followed by DOC with an F-statistic of 3.77 and an impact level of 8%. The spindle speed (S) had the smallest effect, showing an F-statistic of 2.36 and an impact level of 5%.
Figure 8. Percentage impact of each input parameter on the surface roughness (Ra) of the jute/epoxy & glass/epoxy composite
In contrast, for the glass/epoxy composite, DOC played the most critical role, with an F-statistic of 72.34 and an impact level of 79% on Ra. FR was the second most influential factor, with an F-statistic of 8.61 and an impact level of 10%, while tool diameter (D) contributed 8% with an F-value of 7.27. The parameter S had a minimal effect, with an F-statistic of 2.95 and an impact level of 3%, indicating its negligible influence on Ra.
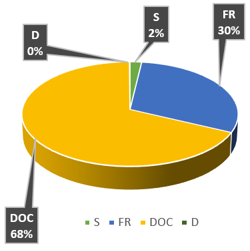
Figure 9 presents the F-statistics and relative influence of each process parameter on the MRR. The DOC was found to be the governing parameter for both glass/epoxy and jute/epoxy composites, with an F-value of 88.93, accounting for 68% of the contribution to MRR. FR was the second most significant factor, with an F-value of 39.52 and a 30% contribution. The spindle speed (S) had a minor effect, with an F-statistic of 2.47 and an impact level of 2%, while tool diameter (D) showed a negligible contribution to MRR.
The higher sensitivity of glass/epoxy composites to DOC can be attributed to the greater stiffness and brittleness of glass fibres, which increase the likelihood of matrix cracking under higher cutting loads. In contrast, the comparatively compliant jute fibres undergo greater elastic deformation before fracture, producing a different surface generation mechanism. Similar trends have been reported in recent studies on fibre-reinforced polymer composites [14, 21, 41], supporting the interpretation of the present findings.
Figure 9. Percentage impact of each input parameter on material removal rate (MRR) of the glass/epoxy & jute/epoxy composites
5.4 Optimization through the Taguchi method
Machining variables can be optimized by using the Taguchi method to achieve minimal Ra and MRR by analyzing the response tables. These tables provide details on the MRR and Ra corresponding to each combination of process parameter levels. Through the appropriate selection of process variable levels that result in the lowest Ra and the highest MRR, the most suitable set of machining variables can be evaluated. The experimental response outcomes for the jute/epoxy composite are summarized in Table 7.
Table 7. Response analysis of surface roughness (Ra) for jute/epoxy composite (smaller is better)
|
Level |
S |
FR |
DOC |
D |
|
1 |
-12.627 |
-15.309 |
-12.585 |
-12.688 |
|
2 |
-11.162 |
-11.542 |
-12.203 |
-12.200 |
|
3 |
-11.814 |
-8.754 |
-10.816 |
-10.716 |
|
Delta |
1.465 |
6.555 |
1.769 |
1.972 |
|
Rank |
4 |
1 |
3 |
2 |
The variable levels corresponding to the minimum Ra are highlighted in the table. Choosing these highlighted levels allows determination of the optimal parameter settings. In the case of the jute/epoxy composite, the optimal set is S1, FR1, DOC1, and D1, leading to the minimum Ra during milling. Similarly, the experimental response outcomes for the glass/epoxy composite are summarized in Table 8, where the highlighted values correspond to the lowest Ra for each parameter level. The optimal combination for this composite is S1, FR1, DOC3, and D1.
Table 8. Response analysis of surface roughness (Ra) for glass/epoxy composite (smaller is better)
|
Level |
S |
FR |
DOC |
D |
|
1 |
-13.92 |
-14.32 |
-11.76 |
-14.10 |
|
2 |
-13.55 |
-13.00 |
-13.34 |
-13.49 |
|
3 |
-12.95 |
-13.10 |
-15.32 |
-12.84 |
|
Delta |
0.97 |
1.32 |
3.56 |
1.26 |
|
Rank |
4 |
2 |
1 |
3 |
Similarly, Table 9 shows the response table for the MRR of both jute/epoxy and glass/epoxy composites, with the highlighted values representing the highest MRR achieved at each parameter level. The parameter combination that yields the optimal results for maximizing MRR is S3, FR3, DOC3, and D1.
Table 9. Response analysis for material removal rate (MRR) of jute/epoxy and glass/epoxy composites (larger is better)
|
Level |
S |
FR |
DOC |
D |
|
1 |
44.85 |
41.67 |
46.33 |
44.85 |
|
2 |
51.51 |
45.19 |
45.68 |
51.51 |
|
3 |
44.85 |
54.35 |
49.20 |
44.85 |
|
Delta |
6.67 |
12.69 |
3.52 |
6.67 |
|
Rank |
3 |
1 |
4 |
2 |
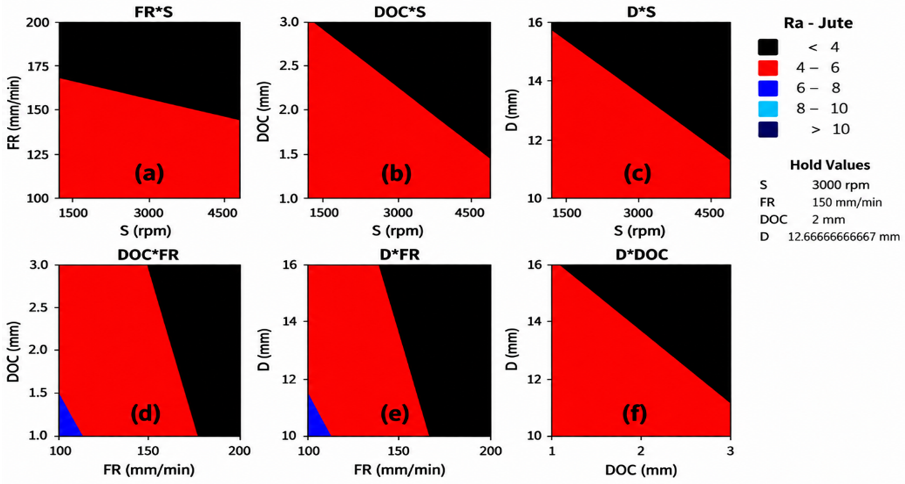
These findings indicate that the optimal combination of parameter levels varies depending on the material being machined. The observed variation results from the differing characteristics of the reinforced materials. Therefore, the type of reinforcement is critical in determining the parameter settings required to achieve improved Ra and higher MRR. Contour plots are applied to show how Ra responds to simultaneous variations of two process variables, whereas the remaining variables are held constant. Specifically, the contour plot for the jute/epoxy composite illustrates the variation in Ra as any two variables are adjusted, with the other two parameters maintained at fixed levels.
Figure 10(a) FR × Rotational spindle speed (S): The lowest Ra (dark red region) occurs at high rotational spindle speed (S) and relatively low FR.
Figure 10(b) DOC × rotational spindle speed (S): Minimal Ra appears at high rotational Spindle speed (S) and low DOC.
Figure 10(c) Tool diameter (D) × rotational spindle speed (S): The dark red region indicating the lowest Ra is observed at high rotational spindle speed (S) and smaller tool diameter (D).
Figure 10(d) DOC × FR: The lowest Ra is achieved at low FR and low DOC.
Figure 10(e) Tool diameter (D) × FR: Minimal Ra occurs at low FR and smaller tool diameter (D).
Figure 10(f) Tool diameter (D) × DOC: The lowest Ra is observed at smaller tool diameter (D) and lower DOC.
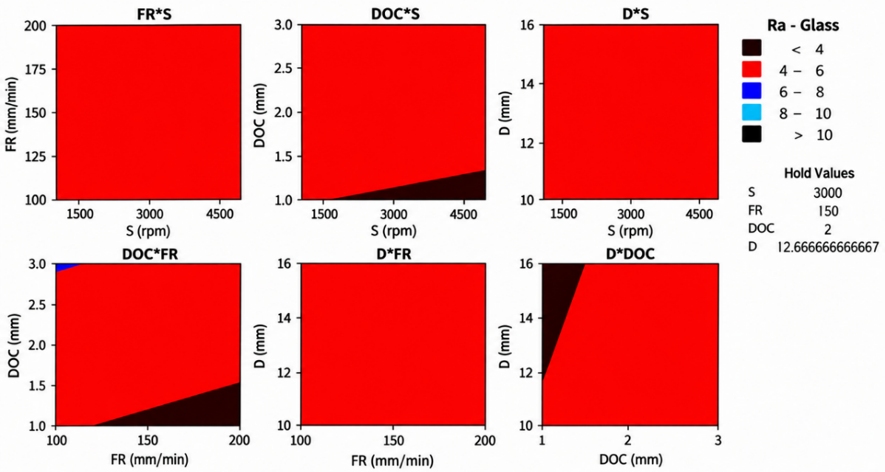
By choosing the parameter levels from these plots that correspond to the lowest Ra and combining them, the optimal set of variables can be determined to minimize Ra. This provides an alternative method of optimizing machining variables using the Taguchi approach. The optimal parameter set for the jute/epoxy composite, as indicated by the contour plots (S3, FR1, DOC1, D1), agrees with the findings from the response table method. The same approach can be employed for the glass/epoxy composite. By analyzing each contour plot shown in Figure 11 and selecting the parameter levels that produce the lowest Ra, the optimal combination for this material is found to be S3, FR1, DOC1, and D1. Notably, both approaches yielded the same optimal set of process parameters.
Figure 10. Contour plots of jute/epoxy composites depicting the minimum surface roughness (Ra) for different combinations of process variables
Figure 11. Contour plots of glass/epoxy composites depicting the minimum surface roughness (Ra) for different combinations of process variables
5.5 Optimization using response surface methodology
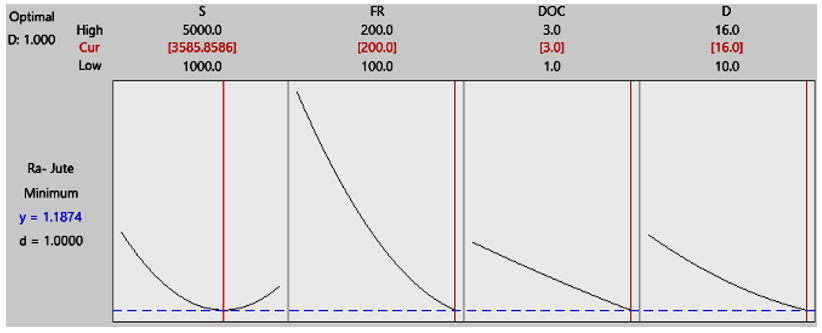
RSM optimization plot for Ra of the jute/epoxy composite is presented in Figure 12. This plot allows the determination of the optimal parameter combination that minimizes Ra within the specified limits. Red brackets denote the optimal values. Adopting these parameter settings during milling results in the lowest Ra. The optimal combination for minimizing Ra in the jute/epoxy composite is S2, FR3, DOC3, and D3, which contrasts with the results from the previous methods. This discrepancy arises because the Taguchi response table treats each factor independently through the S/N ratio and ranks levels using only the discrete values tested in the L9 array, whereas the RSM model is fitted from a continuous second-order regression surface that also accounts for parameter interactions and curvature. With only nine experimental runs, small differences in the fitted response near the optimum can shift the predicted optimal level, particularly for factors such as FR and DOC whose effect on Ra is not strictly monotonic. The RSM prediction is therefore considered the more reliable estimate within the tested range, while the Taguchi result remains useful for quickly narrowing down the influential factors. One advantage of RSM optimization plots is that they allow estimation of Ra at intermediate parameter levels within the defined limits by adjusting the vertical slider across the range.
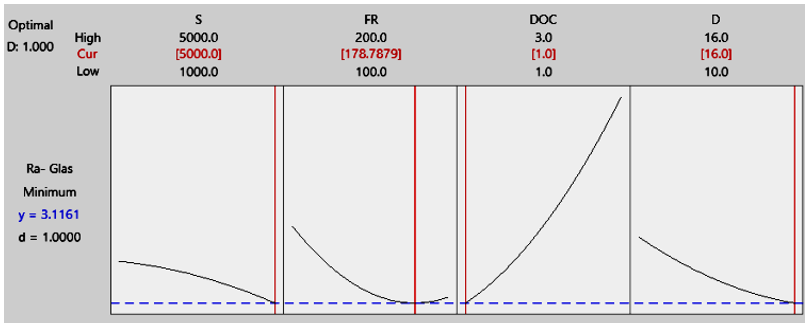
Figure 13 presents the Response surface plot for Ra of the glass/epoxy composite. The optimal set of parameters for achieving the minimum Ra is S3, FR3, DOC1, and D3, which is consistent with the combination derived from the response table method. These findings confirm that different experimental design optimization techniques can lead to the same optimal parameter settings, regardless of whether the goal is to maximize or minimize the response.
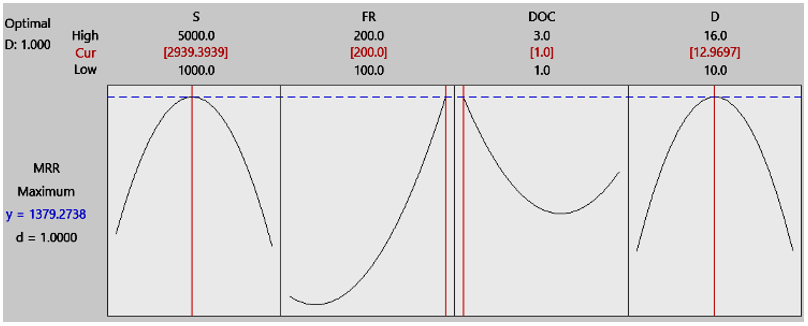
Figure 14 shows the response surface plot for MRR of both glass/epoxy and jute/epoxy composites. The optimal set of parameters to achieve the maximum MRR is S2, FR3, DOC1, and D2, which aligns with the results determined through the response table analysis. The outcomes of this study demonstrate that various experimental design optimization techniques consistently produce optimal parameter settings, regardless of whether the aim is to maximize or minimize the output. The close agreement between the Taguchi method and RSM confirms the reliability of the optimization framework. Taguchi efficiently identifies optimal parameter combinations with a limited number of experiments, whereas RSM provides predictive capability across the design space, thereby improving confidence in selecting machining conditions.
Figure 12. Response surface methodology (RSM)-based surface roughness (Ra) optimization plot for jute/epoxy composites
Figure 13. Response surface methodology (RSM)-based surface roughness (Ra) optimization plot for glass/epoxy composites
Figure 14. Response surface methodology (RSM) optimization plot for maximum material removal rate (MRR)
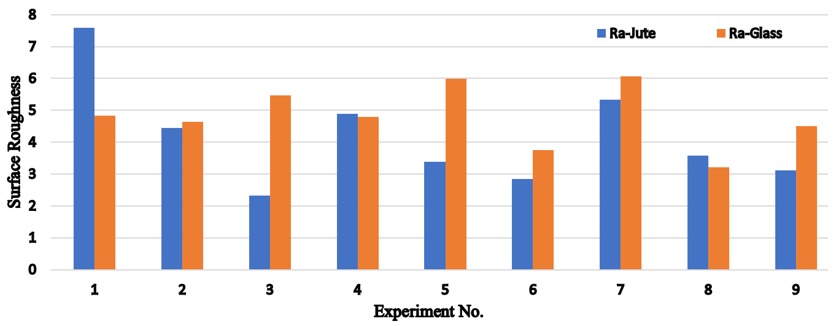
Figure 15. Surface roughness (Ra) obtained while machining jute/epoxy and glass/epoxy composite materials
Figure 15 presents a comparative investigation of Ra obtained in the machining of glass/epoxy and jute/epoxy composites. It is evident from the data that, in general, the glass/epoxy composite exhibits lower Ra values compared to the jute/epoxy composite. Experimental results indicate that the jute/epoxy composite exhibits an average Ra of 6.685 μm, while the glass/epoxy composite shows 3.08 μm under identical milling conditions. Although both composites share the same matrix and machining parameters, the difference in their reinforcing materials leads to a notable variation in Ra. This observation highlights that, under the current experimental setup, the reinforcement type has a major impact on the resulting Ra value. In this study, the difference may be attributed to the hardness of the reinforcing fibers, as harder fibers are more easily cut by the tool, minimizing fiber pull-out. This behaviour also indicates that fibre stiffness and fibre–matrix interfacial characteristics significantly influence machined surface integrity, supporting recent reports [14, 19, 21, 41] that reinforcement properties are decisive in achieving superior machining quality.
Experiments were designed according to the Taguchi approach and RSM to study Ra and MRR in glass/epoxy and jute/epoxy composites. The main findings are listed as follows:
•The FR has a pronounced effect on the MRR.
•DOC is a critical factor influencing MRR in both composite types, whereas tool diameter (D) has the least impact.
•ANOVA results for jute/epoxy composites indicate that FR is the only statistically significant factor affecting Ra (p < 0.05), with DOC, tool diameter (D), and spindle speed (S) contributing comparatively minor, non-significant effects.
•For glass/epoxy composites, Ra is most sensitive to changes in DOC.
•Overall, for both composites, all process parameters significantly influence Ra, with DOC being the most impactful.
•The optimal parameter set for maximizing MRR in both jute/epoxy and glass/epoxy composites consists of a rotational spindle speed (S) of 3000 rpm, FR of 200 mm/min, DOC of 3 mm, and tool diameter (D) of 12 mm.
•To attain the minimum Ra in jute/epoxy composites, the ideal conditions are a rotational spindle speed (S) of 1000 rpm, FR of 100 mm/min, DOC of 1 mm, and tool diameter (D) of 10 mm.
•For glass/epoxy composites, the lowest Ra is obtained at a rotational spindle speed (S) of 1000 rpm, FR of 100 mm/min, DOC of 3 mm, and tool diameter (D) of 10 mm.
The findings of this study show that combining the Taguchi method with RSM offers an effective approach for optimizing the milling performance of fibre-reinforced polymer composites. The Taguchi method efficiently identifies influential process parameters and optimal machining conditions with a limited experimental effort, whereas RSM establishes predictive relationships that enable process behaviour to be estimated within the selected operating range. The agreement between the experimental observations and statistical predictions confirms the reliability of the proposed optimization strategy. In addition to improving machining quality and productivity, the comparative evaluation of jute/epoxy and glass/epoxy composites offers practical insights into selecting appropriate machining parameters based on reinforcement characteristics, thereby supporting the broader adoption of sustainable composite materials in engineering applications.
[1] Peters, S.T. (2013). Handbook of Composites. Springer Science & Business Media, pp. 1-1118. https://doi.org/10.1007/978-1-4615-6389-1
[2] Tong, L., Mouritz, A.P., Bannister, M.K. (2002). 3D Fiber Reinforced Polymer Composites. London: Elsevier.
[3] Clyne, T.W., Hull, D. (2019). An Introduction to Composite Materials. Cambridge University Press, pp. 1-346. https://doi.org/10.1017/9781139050586
[4] Barile, C., Casavola, C. (2019). Mechanical characterization of carbon fiber-reinforced plastic specimens for aerospace applications. In Mechanical and Physical Testing of Bio Composites, Fibre-Reinforced Composites and Hybrid Composites, pp. 387-407. https://doi.org/10.1016/B978-0-08-102292-4.00019-9
[5] Boegler, O., Kling, U., Empl, D., Isikveren, A.T. (2015). Potential of sustainable materials in wing structural design. Bonn, Germany: Deutsche Gesellschaft für Luft-und Raumfahrt-Lilienthal-Oberth eV, 16-18. https://www.dglr.de/publikationen/2015/340188.pdf.
[6] Jakab, P.L. (1999). Wood to metal: The structural origins of the modern airplane. Journal of Aircraft, 36(6): 914-918. https://doi.org/10.2514/2.2551
[7] Hull, D., Clyne, T.W. (1996). An Introduction to Composite Materials. Cambridge: Cambridge University Press, 1-326. https://doi.org/10.1017/CBO9781139170130
[8] Bannister, M. (2001). Challenges for composites into the next millennium-a reinforcement perspective. Composites Part A: Applied Science and Manufacturing, 32(7): 901-910. https://doi.org/10.1016/S1359-835X(01)00008-2
[9] Kishore, R.A., Tiwari, R., Singh, I. (2009). Investigation of drilling in [(0/90)/0]s glass fibre reinforced plastics using Taguchi method. Advances in Production Engineering and Management, 4(1-2): 37-46. https://apem-journal.org/Archives/2009/APEM4-1_2_037-046.pdf.
[10] Faizal, M.A., Beng, Y.K., Dalimin, M.N. (2006). Tensile property of hand lay-up plain-weave woven e-glass/polyester composite: Curing pressure and ply arrangement effect. Borneo Science, 19: 27-34. https://wwwsst.ums.edu.my/data/file/BUdjlTT3SyVE.pdf.
[11] Mohanty, A.K., Misra, M., Drzal, L.T. (2005). Natural Fibers, Biopolymers, and Biocomposites. CRC Press.
[12] Hossein Abdollahiparsa, A. Shahmirzaloo, P. Teuffel, R. Blok (2023). A review of recent developments in structural applications of natural fiber-reinforced composites (NFRCs). Composites Advanced Materials, 32: 1-18. https://doi.org/10.1177/26349833221147540
[13] Soni, A., Kumar, S., Majumder, B., Dam, H., Dutta, V., Das, P.K. (2024). Synergy of waste plastics and natural fibers as sustainable composites for structural applications concerning circular economy. Environmental Science and Pollution Research, 31(27): 38846-38865. https://doi.org/10.1007/s11356-023-26365-y
[14] Kumar, J., Singh, Y., Rakesh, P.K., Singh, I., Davim, J.P. (2023). The impact of hole diameter on the molded and drilled holes in jute-fiber-reinforced epoxy composites. Journal of Composites Science, 7(9): 376. https://doi.org/10.3390/jcs7090376
[15] Venkatesan, G., Jayakumar, M., Nemera, A., Balachandar, R. (2023). Natural fiber-reinforced polymer composite manufacturing processes. Encyclopedia of Green Materials, 1-14. https://doi.org/10.1007/978-981-16-4921-9_258-1
[16] Shah, S.S., Shaikh, M.N., Khan, M.Y., Alfasane, M.A., Rahman, M.M., Aziz, M.A. (2021). Present status and future prospects of jute in nanotechnology: A review. The Chemical Record, 21: 1631-1665. https://doi.org/10.1002/tcr.202100135
[17] Song, H.W., Liu, J., He, K.Y., Ahmad, W. (2021). A comprehensive overview of jute fiber reinforced cementitious composites. Case Studies in Construction Materials, 15: e00724. https://doi.org/10.1016/j.cscm.2021.e00724
[18] Bambach, M.R. (2020). Direct comparison of the structural compression characteristics of natural and synthetic fiber-epoxy composites: Flax, jute, hemp, glass and carbon fibers. Fibers, 8: 62. https://doi.org/10.3390/fib8100062
[19] Dev, B., Rahman, M.A., Repon, M.R., Rahman, M.M., Haji, A., Nawab, Y. (2023). Recent progress in thermal and acoustic properties of natural fiber reinforced polymer composites: Preparation, characterization, and data analysis. Polymer Composites, 44: 7235-7297. https://doi.org/10.1002/pc.27633
[20] Kumar, T.S., Kumar, S.S., Kumar, L.R. (2022). Jute fibers, their composites and applications. In Plant Fibers, Their Composites, and Applications, pp. 253-282. https://doi.org/10.1016/B978-0-12-824528-6.00020-5
[21] Wang, Y., Du, T.Q., Ma, W.K., Song, P.Y., Chen, Y.Y. (2024). Research on mechanics and acoustic properties of jute fiber composite material. Heliyon, 10: e33869. https://doi.org/10.1016/j.heliyon.2024.e33869
[22] Davidovits, J. (2020). Geopolymer Chemistry and Applications. Geopolymer Institute: Saint-Quentin, France.
[23] Sanjay, M.R., Yogesha, B. (2017). Studies on natural/glass fiber reinforced polymer hybrid composites: An evolution. Materials Today: Proceedings, 4: 2739-2747. https://doi.org/10.1016/j.matpr.2017.02.151
[24] Billah, M.M., Rabbi, M.S., Hasan, A. (2021). A review on developments in manufacturing process and mechanical properties of natural fiber composites. Journal of Engineering Advancements, 2: 13-23. https://doi.org/10.38032/jea.2021.01.003
[25] Kornmann, X., Rees, M., Thomann, Y., Necola, A., Barbezat, M., Thomann, R. (2005). Epoxy-layered silicate nanocomposites as matrix in glass fibre-reinforced composites. Composites Science and Technology, 65: 2259-2268. https://doi.org/10.1016/j.compscitech.2005.02.006
[26] Li, X., Tabil, L.G., Panigrahi, S. (2007). Chemical treatments of natural fiber for use in natural fiber-reinforced composites: A review. Journal of Polymers and the Environment, 15: 25-33. https://doi.org/10.1007/s10924-006-0042-3
[27] Sreekumar, P.A., Joseph, K., Unnikrishnan, G., Thomas, S. (2007). A comparative study on mechanical properties of sisal-leaf fibre reinforced polyester composites prepared by resin transfer and compression moulding techniques. Composites Science and Technology, 67: 453-461. https://doi.org/10.1016/j.compscitech.2006.08.025
[28] Chen, W.H., Uribe, M.C., Kwon, E.E., et al. (2022). A comprehensive review of thermoelectric generation optimization by statistical approach: Taguchi method, analysis of variance (ANOVA), and response surface methodology (RSM). Renewable and Sustainable Energy Reviews, 169: 112917. https://doi.org/10.1016/j.rser.2022.112917
[29] Nguyen, V., Altarazi, F., Tran, T. (2022). Optimization of process parameters for laser cutting process of stainless steel 304: A comparative analysis and estimation with Taguchi method and response surface methodology. Mathematical Problems in Engineering, 1-14. https://doi.org/10.1155/2022/6677586
[30] Aje, O.F., Adie, A.J. (2020). Response surface methodology and Taguchi method based applications-a review. Global Journal of Engineering and Technology Advances, 5(1): 53-59. https://doi.org/10.30574/gjeta.2020.5.1.0062
[31] Romelin, C.Z., Nusantara, B.C. (2024). Comparative analysis of response surface methodology (RSM) and Taguchi method: Optimization hydraulic ram pump performance. Operations Research Forum, 5: 85. https://doi.org/10.1007/s43069-024-00359-z
[32] Gao, G., Xu, F., Xu, J.M. (2022). Parametric optimization of FDM process for improving mechanical strengths using Taguchi method and response surface method: A comparative investigation. Machines, 10(9): 750. https://doi.org/10.3390/machines10090750
[33] Milkey, K.R., Samsudin, A.R., Dubey, A.K., Kidd, P. (2014). Comparison between Taguchi method and response surface methodology (RSM) in modelling CO2 laser machining. Jordan Journal of Mechanical and Industrial Engineering, 8(1): 35-42. https://openurl.ebsco.com/EPDB%3Agcd%3A1%3A9549825/detailv2?sid=ebsco%3Aplink%3Acrawler-gcd&id=ebsco%3Agcd%3A97179871&crl=c&jrnl=19956665&link_origin=scholar.google.com.
[34] Ezeddini, S., Boujelbene, M., Bayraktar, E., Salem, S.B. (2020). Optimization of the surface roughness parameters of Ti-Al intermetallic based composite machined by wire electrical discharge machining. Coatings, 10(9): 900. https://doi.org/10.3390/coatings10090900
[35] Khuri, A.I., Mukhopadhyay, S. (2010). Response surface methodology. Wiley Interdisciplinary Reviews: Computational Statistics, 2(2): 128-149. https://doi.org/10.1002/wics.73
[36] Rajendran, A., Paul, B., Shunmugesh, K. (2021). Optimization of milling parameters in jute fiber reinforced epoxy composite using GRA. Materials Today: Proceedings, 43: 3951-3955. https://doi.org/10.1016/j.matpr.2021.02.663
[37] Muche, A.M., Workneh, H.Z., Zewge, M.G. (2023). Optimization of cutting parameters for milling enset fiber reinforced epoxy composite. Research Square, 1-20. https://doi.org/10.21203/rs.3.rs-2776758/v1
[38] Ramulu, M., Arola, D., Colligan, K. (1994). Preliminary investigation of effects on the surface integrity of fibre-reinforced plastics. Engineering Systems Design and Analysis, ASME, 64(2): 93-101.
[39] Palanikumar, K., Karunamoothy, L., Karthikeyan, R. (2005). Assessment of factors influencing surface roughness on the machining of glass fiber-reinforced composites. Journal of Materials and Design, 27(10): 862-871. https://doi.org/10.1016/j.matdes.2005.03.011
[40] Palanikumar, K. (2008). Application of Taguchi and response surface methodology for surface roughness in machining glass fiber reinforced plastics by PCD tooling. International Journal of Advanced Manufacturing Technology, 36(1-2): 19-27. https://doi.org/10.1007/s00170-006-0811-0
[41] Mukesh, S.K., Bettagowda, N., Praveenkumara, J., et al. (2022). Influence of stacking sequence on flax/kevlar hybrid epoxy composites: Mechanical and morphological studies. Polymer Composites, 43(6): 3782-3793. https://doi.org/10.1002/pc.266