CeO2-Engineered Grain Boundary Modulation in Bi-Free SnO2–Co3O4–Nb2O5 Varistor Ceramics: Microstructure Evolution, Defect Chemistry, and Enhanced Nonlinear Electrical Performance

Abbas Fadhal Shannoon
© 2026 The author. This article is published by IIETA and is licensed under the CC BY 4.0 license (http://creativecommons.org/licenses/by/4.0/).
OPEN ACCESS
SnO2-based varistor ceramics have emerged as promising candidates for surge-protection applications owing to their single-phase microstructure and superior thermal conductivity compared with conventional ZnO-based systems. However, systematic understanding of grain-boundary defect engineering in Bi-free SnO2–Co3O4–Nb2O5 systems remains limited, particularly regarding the role of rare-earth oxide additions in modulating Schottky barrier characteristics. This study investigates the influence of CeO2 addition (0–1.0 mol%) on the microstructure evolution, defect chemistry, and nonlinear electrical performance of SnO2–Co3O4–Nb2O5 varistor ceramics fabricated via conventional solid-state sintering. Comprehensive characterization using X-ray diffraction (XRD), field-emission scanning electron microscopy (FESEM), energy-dispersive X-ray spectroscopy (EDS), X-ray photoelectron spectroscopy (XPS), impedance spectroscopy, and current–voltage measurements reveals that CeO2 segregates preferentially at grain boundaries, inducing grain refinement from 12.5 µm to 6.8 µm and enhancing relative density from 94.2% to 97.8%. The optimized CeO2 content of 0.5 mol% yields a maximum nonlinear coefficient of 42.3, reduced leakage current of 8.5 μA cm−2, and enhanced Schottky barrier height of 1.82 eV. These improvements are attributed to Ce4+/Ce3+-mediated oxygen-vacancy modulation and enhanced electron-trapping efficiency at grain boundaries. This work demonstrates that CeO2 grain-boundary engineering provides an effective strategy for developing high-performance Bi-free SnO2 varistors with superior electrical stability.
SnO2 varistor, CeO2 doping, grain-boundary engineering, Schottky barrier, nonlinear coefficient, defect chemistry, surge protection
Rapid development of ultra-high-voltage transmission grids, the use of renewable energy sources, and the construction of smart grids have led to a considerable increase in the need for efficient surge protectors to reduce transient overvoltage and ensure the stability of power grids [1, 2]. Metal-oxide varistors (MOVs) are widely used to protect the power grid from overvoltage due to the high nonlinearity of their current-voltage characteristics, low currents under normal conditions, and rapid energy discharge when a surge is applied [3, 4]. Despite the dominance of zinc oxide varistors among oxide ceramics, their electrical behavior is highly sensitive to the presence of a complex multiphase structure, including Bi-containing secondary phases [5-7].
The development of SnO2-based varistor ceramics is considered a potential replacement owing to their simple microstructure, high thermal conductivity, high thermal stability, and good compositional reproducibility [8-10]. Especially significant is the SnO2–Co3O4–Nb2O5 system, which has a predominantly single-phase microstructure, wherein Co serves as the acceptor doping agent to introduce electrically active grain boundaries, and Nb serves as the donor doping agent through the Nb5+ ion substitution of the Sn4+ ion to increase grain conductivity [11-14]. The nonlinearity of the electrical response arises from the double Schottky barrier at grain boundaries, with depletion layers formed by defect states and oxygen absorption [15].
It has recently been shown that rare earth oxides can be used as an efficient tool for grain-boundary engineering of SnO2 varistors. The doping with Fe2O3 enhances nonlinear parameters, voltage gradients, and the leakage currents of SnO2 varistors by changing the defect chemistry and formation of the grain boundary barriers [16]. Of these dopants, CeO2 has received growing interest due to the variable valence states of Ce3+/Ce4+ and its ability to store oxygen, which affects oxygen vacancies, grain growth, and interfacial electrical properties. However, controversy persists regarding the segregation of Ce, defect chemistry, and the concentration that yields optimal barrier height and low leakage current [17].
As such, this research work examines the effect of Cerium Dioxide on Bi-free SnO2–Co3O4–Nb2O5 varistor ceramics produced using the traditional solid-state reaction technique. By understanding the correlation among CeO2-induced defect structure, grain boundary engineering, and electrical nonlinearity, this research establishes the mechanisms by which CeO2 forms barrier layers and identifies the optimal CeO2 concentration for future power transmission systems.
2.1 Materials
The analytical-grade oxide powders were used as starting materials to fabricate SnO2-based varistor ceramics. Tin oxide (SnO2, ≥99.9%, Sigma-Aldrich) was used as the main ceramic material, and cobalt oxide (Co3O4, ≥99.8%, Alfa Aesar) and niobium pentoxide (Nb2O5, ≥99.9%, CBMM) were utilized as the acceptor and donor dopants, respectively, to create electrically active grain boundaries. Cerium dioxide (CeO2, ≥99.9%, Sigma-Aldrich) was added to the grain boundary to examine its influence on defect chemistry, microstructural development, and nonlinear electrical properties. All chemicals were used as received without further purification.
2.2 Ceramic synthesis
Samples of ceramics having compositions (99.45 – x) mol% SnO2 – 0.5 mol% Co3O4 – 0.05 mol% Nb2O5 – x mol% CeO2 (x = 0, 0.1, 0.25, 0.5, 0.75, and 1.0 mol%) were prepared through the conventional solid-state ceramic technique [5]. Pure oxide powders were weighed according to the stoichiometric ratio (ensuring a total of 100 mol%) and then thoroughly mixed via wet milling in an alcohol medium using zirconia balls in a planetary ball mill operating at 300 rpm for 12 h. These suspensions were dried for 24 h at 80 ℃ in a convection oven to ensure complete removal of milling media. Calcination was performed on the dried powders at 800 ℃ for 2 h under an air atmosphere to decompose any residual organic compounds and promote preliminary solid-state reactions. Then, these powders were formed into disk pellets with a diameter of 12 mm and a thickness of 2 mm by applying a pressure of 200 MPa using a hydraulic press in a uniaxial pressing process. The green specimens were fired in a muffle furnace at 1300 ℃ for 2 h with a heating rate of 5 ℃ min-1 followed by furnace cooling to room temperature. During sintering, the oxides of dopants will enter the rutile structure of SnO2. The important reactions related to defects that control the electrical properties on a macroscopic scale are shown below:
$\mathrm{Co}_3 \mathrm{O}_4 \rightarrow 3 \mathrm{CoO}+\frac{1}{2} \mathrm{O}_2 \uparrow$ (1)
Sintering – Acceptor doping (CoO):
$\mathrm{CoO} \xrightarrow{\mathrm{SnO}_2} \mathrm{Co}_{\mathrm{Sn}}^{\prime \prime}+\mathrm{V}_{\mathrm{O}}+\mathrm{O}_{\mathrm{O}}$ (2)
Sintering – Donor doping (Nb2O5):
$\mathrm{Nb}_2 \mathrm{O}_5 \xrightarrow{\mathrm{SnO}_2} 2 \mathrm{Nb}_{\mathrm{Sn}}^{\cdot}+4 \mathrm{O}_{\mathrm{O}}+\frac{1}{2} \mathrm{O}_2 \uparrow+2 e^{\prime}$ (3)
Sintering – CeO2 incorporation:
$\mathrm{CeO}_2 \xrightarrow{\mathrm{SnO}_2} \mathrm{Ce}_{\mathrm{Sn}}^{\cdot}+2 \mathrm{O}_{\mathrm{O}}+\frac{1}{2} \mathrm{O}_2 \uparrow+2 e^{\prime}$ (4)
Sintering – Partial reduction of Ce4+ to Ce3+ at grain boundaries:
$2 \mathrm{Ce}_{\mathrm{Sn}}^{\cdot}+\mathrm{O}_{\mathrm{O}} \rightarrow 2 \mathrm{Ce}_{\mathrm{Sn}}^{\prime}+\mathrm{V}_{\ddot{\mathrm{O}}}+\frac{1}{2} \mathrm{O}_2 \uparrow$ (5)
The sintered pellets were ground and polished using silicon carbide abrasive papers (from #400 to #2000 grit) and subsequently with 0.3 µm alumina paste to obtain flat, parallel surfaces suitable for subsequent electrical measurements.
The recovery of powder after the milling and drying process accounted for more than 95% of the initial batch weight, as very little loss was recorded, with the remainder attributed to sticking to the milling jar walls and the transfer process [18]. The yield of the calcination process was about 98%, with weight losses attributable to the decomposition of the organic binder and moisture removal. The elimination of impurities was ensured by using highly purified raw materials (≥99.8%) and zirconia milling balls free of contamination. Moisture was removed by drying at 80 °C and calcination at 800 °C, as confirmed by thermogravimetric analysis, which showed complete weight stabilization.
2.3 Characterization
The phase identification and crystallography studies were performed using X-ray diffraction (XRD, PANalytical Empyrean) with Cu Kα radiation (λ = 1.5406 Å) over the 20°-80° range at a scanning rate of 0.02°/s. Lattice parameters and crystallite sizes were calculated using Rietveld refinement with the HighScore Plus software (version 4.9). The crystallite size was determined using the Scherrer equation: $D=\frac{K \lambda}{\beta \cos \theta}$, where K is the shape factor (0.89), λ is the X-ray wavelength, β is the full width at half maximum (FWHM), and θ is the Bragg angle. The microstructural characterization was performed using field-emission scanning electron microscopy (FESEM, JEOL JSM-7800F) along with energy-dispersive X-ray spectroscopy (EDS) for elemental mapping and compositional analysis. X-ray photoelectron spectroscopy (XPS, Thermo Scientific K-Alpha) with monochromatic Al Kα radiation was used to study the chemical states of Sn, Co, Nb, Ce, and O. XPS spectra were fitted using the CasaXPS software with a Shirley background subtraction. Peak positions were calibrated to the C 1s peak at 284.8 eV. The Ce3+/(Ce3++Ce4+) ratios were calculated from the integrated peak areas of the Ce 3d multiplet components. The bulk density of the prepared material was calculated using Archimedes principle with distilled water as the immersion fluid. Impedance spectroscopy measurements were done using the precision impedance analyzer (Novocontrol Alpha-A) from 10-1 to 107 Hz at room temperature. The current-voltage (J-E) measurements were carried out at room temperature using the Keithley 2410 source meter with the high-voltage power source. Fourier-transform infrared (FTIR) spectra were collected using the PerkinElmer Spectrum Two FTIR spectrometer in attenuated total reflectance (ATR) mode from 4000 to 400 cm-1 with a resolution of 4 cm-1 and 64 scans.
UV-Vis diffuse reflectance spectroscopy (DRS) was performed using a Shimadzu UV-2600 spectrophotometer equipped with an integrating sphere attachment, over the wavelength range of 200–800 nm, using BaSO4 as the reference. The Kubelka-Munk function F(R) = (1-R)2/(2R) was used to convert reflectance to absorption. Tauc plots were constructed as [F(R)·hν](1/n) vs. hν, where n = 2 for indirect allowed transitions. The optical band gap (Eg) was determined by extrapolating the linear region of the Tauc plot to the energy axis. Urbach energy (Eᵤ) was calculated from the exponential tail of the absorption edge using the relation α = α₀ exp(hν/Eᵤ), where α is the absorption coefficient, and hν is the photon energy.
2.4 Electrical measurements
The breakdown voltage E1mA was taken as the electric field corresponding to a current density of 1 mA/cm2. Leakage current density JL was measured at 0.8 E1mA. The nonlinearity coefficient (α) was calculated based on J-E characteristics according to the equation α = log(J2/J1)/log(E2/E1), where J1 = 0.1 mA/cm2, J2 = 1 mA/cm2. The Schottky barrier height, ΦB, was estimated from temperature-dependent J-E characteristics using the Richardson-Schottky equation:
J = A*T2 exp[-(ΦB - βE(1/2))/kT]
where, J is the current density, A is the Richardson constant (120 A/cm2·K2 for SnO2), T is the absolute temperature (measured from 25 ℃ to 200 ℃), E is the applied electric field, k is the Boltzmann constant, β is the Schottky field-lowering coefficient, and ΦB is the Schottky barrier height. Fitting was performed on the linear region of the ln(J/T2) vs. E(1/2) plot. The fitting quality (R2) for all samples exceeded 0.985.
2.4.1 Temperature-dependent impedance spectroscopy
Impedance spectra were recorded by a Novocontrol Alpha-A impedance spectrometer over a wide frequency range from 10-1 to 107 Hz at temperatures ranging from 25 to 250 ℃ under atmospheric conditions. Silver paste was applied to both sides of the polished ceramics before analysis. The grain resistance Rg and the grain boundary resistance Rgb were estimated using an equivalent circuit analysis with two parallel Randles circuits. Electrical conductivity was determined from:
$\sigma=\frac{L}{R \cdot A}$ (6)
where, L is the specimen thickness, A is the electrode area, and R represents either Rg or Rgb. Activation energies were determined from Arrhenius plots of $\ln (\sigma T)$ versus 1000/T using:
$\sigma T=\sigma_0 \exp \left(-\frac{E_a}{k T}\right)$ (7)
where, Ea is the activation energy, k is the Boltzmann constant, and T is the absolute temperature.
2.5 Mechanical properties
The Vickers hardness number (Hv) was determined using a microhardness tester (Mitutoyo HM-200) with a diamond indenter and a 500 g load for 15 sec (designated as HV0.5). At least ten indentation tests were conducted on each specimen to ensure statistical significance. Hardness was calculated using Hv = 1.8544P/d2, where P is the applied load (kgf), and d is the average diagonal length of the indentation (mm). Hardness values were converted from kgf/mm2 to GPa using the conversion factor 1 kgf/mm2 = 0.00980665 GPa. Fracture toughness (KIC) was assessed based on the indentation crack length method using the equation:
KIC = 0.016 (E/Hv)(1/2) (P/c(3/2))
where, E is Young's modulus, P is the applied load, and c is the crack length measured from the indentation center to the crack tip. Young's modulus was determined using the ultrasonic pulse-echo technique (Olympus 45MG ultrasonic thickness gauge) with a 10 MHz transducer, measuring longitudinal and shear wave velocities and calculating the modulus from the elastic constants. The relative density was calculated as the ratio of the bulk density to the theoretical density, which was determined from the weighted sum of the oxide densities.
3.1 Phase analysis
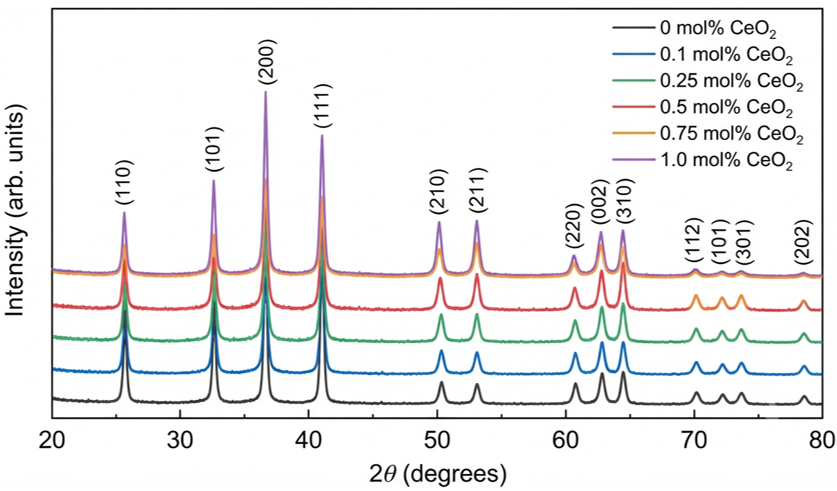
Figure 1 presents the XRD patterns of CeO2-modified SnO2–Co3O4–Nb2O5 ceramics. All of the diffraction peaks have been assigned to the tetragonal rutile structure of the SnO2 phase (P42/mnm space group; Joint Committee on Powder Diffraction Standards (JCPDS) No. 41-1445), and no other phases have been detected in this composition system within the detection limit of XRD analysis (approximately 2–3 wt%) [5, 9]. The absence of secondary phases in XRD patterns does not necessarily prove complete lattice incorporation of dopants, as segregation at grain boundaries may occur below the XRD detection limit. The lattice parameter evolution discussed below suggests that at low CeO2 concentrations ($\leq$ 0.25 mol%), Ce partially enters the SnO2 lattice, while at higher concentrations ($\geq$ 0.5 mol%), Ce predominantly segregates at grain boundaries, as confirmed by EDS elemental mapping.
Figure 1. X-ray diffraction (XRD) patterns of SnO2–Co3O4–Nb2O5 ceramics with varying CeO2 contents (0–1.0 mol%)
As can be seen from Table 1, the addition of CeO2 leads to a small contraction of the lattice. The value of a parameter decreased from 4.7382 ± 0.0005 Å to 4.7356 ± 0.0007 Å, whereas the parameter decreased from 3.1871 ± 0.0004 Å to 3.1854 ± 0.0006 Å, reducing the unit-cell volume from 71.56 ± 0.02 Å3 to 71.25 ± 0.04 Å3. Fluctuations in the c/a ratios are due to the cumulative effect of several dopants, defects, and grain boundary segregation, not experimental errors. The average crystallite size decreased from 48.3 nm to 42.6 nm with increasing CeO2 concentration, indicating that Ce helps inhibit grain growth during sintering. The reason for this improvement is grain-boundary segregation due to Ce, which limits grain mobility.
Table 1. Crystal structure parameters of SnO2–Co3O4–Nb2O5 ceramics with varying CeO2 content
|
CeO2 (mol%) |
a (Å) |
c (Å) |
c/a |
Unit Cell Volume (ų) |
Crystallite Size (nm) |
|
0 |
4.7382 |
3.1871 |
0.6726 |
71.56 ± 0.02 |
48.3 ± 2.1 |
|
0.1 |
4.7378 |
3.1869 |
0.6726 |
71.49 ± 0.03 |
46.9 ± 2.3 |
|
0.25 |
4.7371 |
3.1865 |
0.6725 |
71.41 ± 0.03 |
45.5 ± 2.4 |
|
0.5 |
4.7365 |
3.1860 |
0.6725 |
71.35 ± 0.03 |
44.0 ± 2.0 |
|
0.75 |
4.7360 |
3.1857 |
0.6725 |
71.30 ± 0.04 |
43.3 ± 2.2 |
|
1.0 |
4.7356 |
3.1854 |
0.6724 |
71.25 ± 0.04 |
42.6 ± 2.5 |
3.2 Microstructure
FESEM micrographs in Figure 2 illustrate the effect of CeO2 on the microstructure of SnO2–Co3O4–Nb2O5 based ceramics. In the undoped system, the microstructure is characterized by coarse, faceted grains with a relatively large grain size (12.5 µm) and high porosity. An increase in the concentration of CeO2 results in a decrease in the average grain size to 6.8 µm at 0.5 mol% and 5.9 µm at 1.0 mol%, which corresponds to a total reduction in the average grain size of approximately 54%. Such refinement of the microstructure is related to the presence of Ce-rich segregation at the grain boundaries, which prevents grain growth during sintering [14].
Figure 2. Field-emission scanning electron microscopy (FESEM) micrographs of SnO2–Co3O4–Nb2O5 ceramics with varying CeO2 contents: (a) 0 mol%, (b) 0.1 mol%, (c) 0.25 mol%, (d) 0.5 mol%, (e) 0.75 mol%, (f) 1.0 mol%
According to Table 2, the relative density increases from 94.2% to 97.8% at 0.5 mol% CeO2, then decreases slightly to 96.5% at 1.0 mol%. The enhancement of oxygen-vacancy-assisted diffusion improves densification in the middle range of the CeO2 amount. At the same time, an excess of Ce leads to the formation of lattice strain and the saturation of grain boundaries. Thus, the minimum porosity (2.2%) was achieved at 0.5 mol% CeO2.
Table 2. Grain size and density of SnO2–Co3O4–Nb2O5 ceramics with varying CeO2 content
|
CeO2 (mol%) |
Average Grain Size (µm) |
Relative Density (%) |
Porosity (%) |
|
0 |
12.5 ± 2.3 |
94.2 ± 0.8 |
5.8 ± 0.8 |
|
0.1 |
11.4 ± 2.1 |
94.9 ± 0.7 |
5.1 ± 0.7 |
|
0.25 |
10.0 ± 1.9 |
96.1 ± 0.6 |
3.9 ± 0.6 |
|
0.5 |
6.8 ± 1.4 |
97.8 ± 0.5 |
2.2 ± 0.5 |
|
0.75 |
6.3 ± 1.3 |
97.0 ± 0.6 |
3.0 ± 0.6 |
|
1.0 |
5.9 ± 1.2 |
96.5 ± 0.7 |
3.5 ± 0.7 |
In Figure 3, the EDS elemental maps for the 0.5 mol% CeO2 sample are shown. Here, Sn, Co, and Nb show an even distribution within the grains; however, Ce is segregated to the grain boundaries and grain junctions. The above segregation indicates that Ce acts as a grain-boundary modifier rather than as part of the lattice.
Figure 3. Field-emission scanning electron microscopy (FESEM)-energy-dispersive X-ray spectroscopy (EDS) elemental mapping of SnO2–Co3O4–Nb2O5–0.5CeO2 ceramic showing distribution of Sn, Co, Nb, Ce, and O
3.3 Chemical state
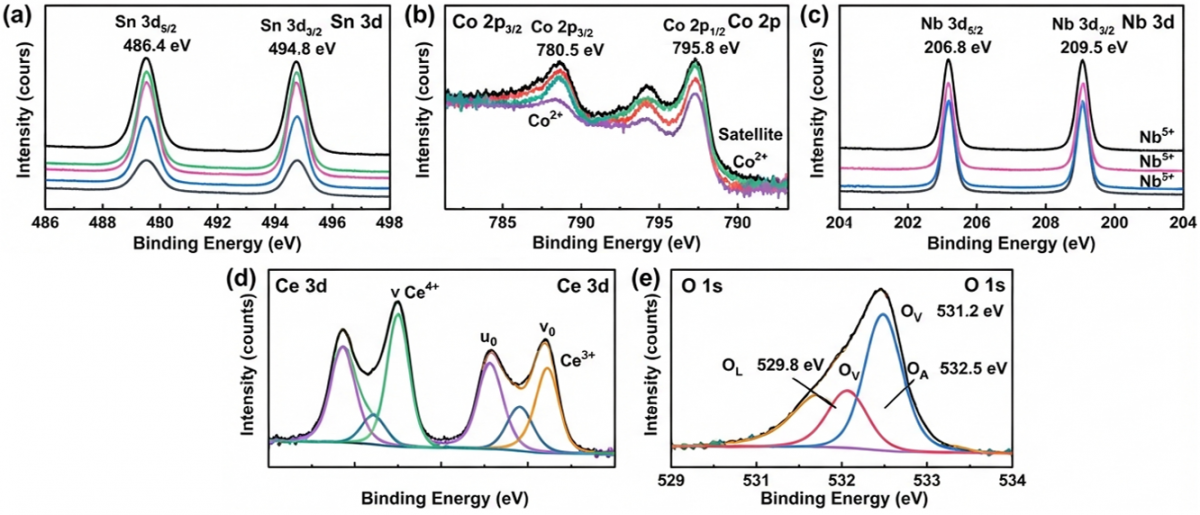
Insights gained from XPS analysis (Figure 4) are very important for understanding valence states and defect chemistry of the doped materials. The presence of Sn 3d5/2 and Sn 3d3/2 peaks at binding energies of about 486.4 eV and 494.8 eV, respectively, indicates a Sn4+ valence state. Satellite peaks associated with Sn2+ are not seen in any of the samples.
Figure 4. X-ray photoelectron spectroscopy (XPS) spectra of SnO2–Co3O4–Nb2O5 ceramics with varying CeO2 contents: (a) Sn 3d, (b) Co 2p, (c) Nb 3d, (d) Ce 3d, (e) O 1s
XPS confirms the oxidation states of the constituent elements and elucidates the defect chemistry associated with CeO2 doping. Sn 3d spectra clearly resolve Sn4+ doublets with very low fitting errors (<2%), which indicates chemical homogeneity of the Sn environment. Co 2p spectra confirm the presence of both Co2+ and Co3+ species with minor changes in the ratio between Co2+ and Co3+ on Ce addition, which shows that Ce has an effect on the redox state of cobalt at grain boundaries. In contrast, Nb 3d spectra contain only Nb5+ peaks, thus proving that Nb acts as a pure donor dopant.
The Ce 3d spectra resolve multiplet splitting typical for mixed Ce3+/Ce4+ valence states. Quantitative fitting was performed using CasaXPS software with a Shirley background subtraction. The Ce 3d spectra were fitted with ten peaks corresponding to the Ce3+ and Ce4+ multiplets. The Ce3+/(Ce3++Ce4+) ratio increased from about 0.15 at 0.1 mol% CeO2 to 0.32 at 1.0 mol% CeO2 due to progressive reduction of Ce4+ with an increase in doping level. Oxygen vacancies are generated as a result of charge compensation in the process of this reduction, according to:
$2 \mathrm{Ce}^{4+}+\mathrm{O}^{2-} \rightarrow 2 \mathrm{Ce}^{3+}+\mathrm{V}_{\ddot{\mathrm{O}}}+1 / 2 \mathrm{O}_2 \uparrow$
The O 1s spectra deconvolution reveals three components: lattice oxygen (OL, ~529.5 eV), oxygen vacancy-related species (OV, ~531.0 eV), and hydroxyl or adsorbed oxygen (OH, ~532.0 eV). The oxygen-vacancy-related component (OV) shows an increase up to 0.5 mol% CeO2, reaching a maximum of 38.7% of the total O 1s area, thus implying that there will be an increase in defects due to the oxidation-reduction reaction of Ce4+/Ce3+. An increase in the number of oxygen vacancies at the grain boundary is expected to increase electron trapping and affect the formation of a double Schottky barrier.
3.4 Fourier-transform infrared analysis of defect chemistry
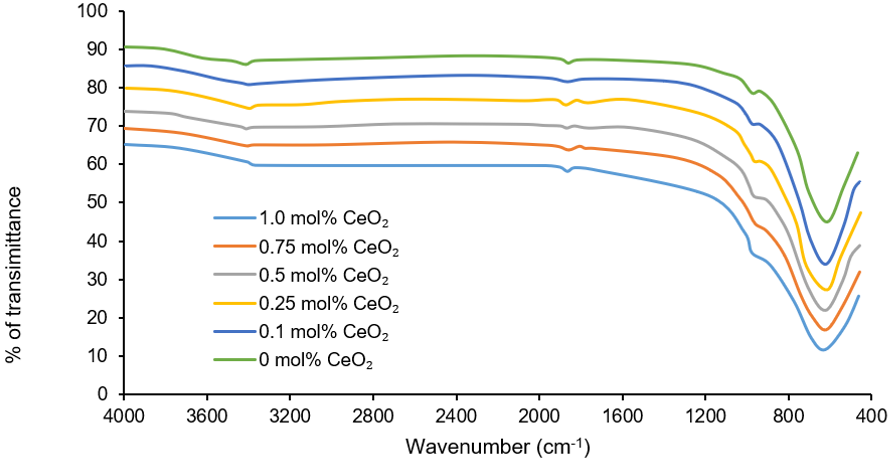
Figure 5 shows the FTIR spectra for the SnO2–Co3O4–Nb2O5 ceramics doped with CeO2. The absorption peaks in the range 520 – 690 cm-1, corresponding to Sn–O stretching vibrations, and weaker Co–O and Nb–O bands have been recorded for all specimens. The increasing content of CeO2 leads to an increase in the band width and a shift to lower frequencies, thus demonstrating enhanced lattice deformation and defect formation.
Figure 5. Fourier-transform infrared (FTIR) spectra of SnO2–Co3O4–Nb2O5 ceramics with varying CeO2 contents
The shoulder in the spectrum at 560 – 580 cm-1, related to Ce–O vibrations, is more clearly seen up to 0.5 mol% CeO2 and proves the preferred segregation of cerium atoms in grain boundaries. At the same time, the broadening of the band corresponding to Sn–O vibrations implies a higher content of oxygen vacancies due to partial reduction of Ce4+ to Ce3+, consistent with XPS results. Minor variations in the FTIR spectra are detected above 0.5 mol% CeO2, implying the saturation of defects in grain boundaries.
3.5 Optical properties
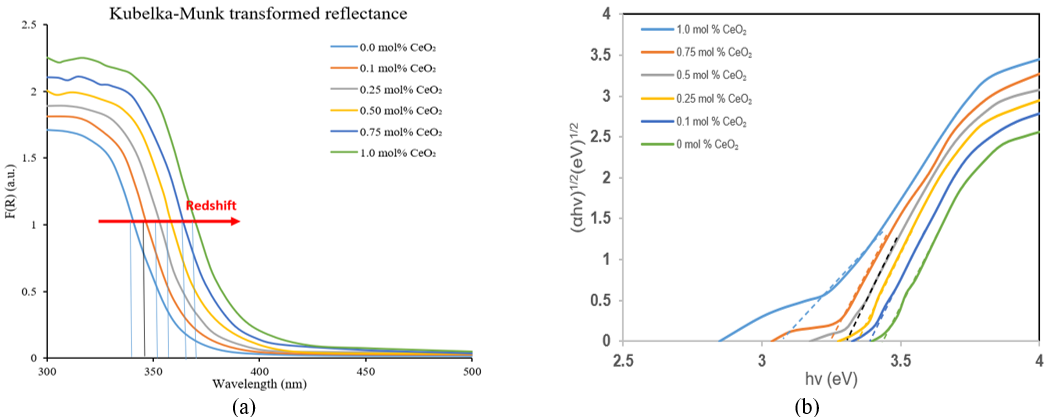
The optical band gap was determined from UV-Vis DRS using Kubelka-Munk transformed reflectance spectra and Tauc plots, as shown in Figure 6 and summarized in Table 3. The absorption edge shifts systematically toward lower energy with increasing CeO2 content. The indirect band gap (Eg) decreases from 3.46 ± 0.03 eV for the undoped sample to 3.26 ± 0.03 eV for the 1.0 mol% CeO2-doped sample. This band gap narrowing can be attributed to the formation of oxygen vacancies and the introduction of Ce-related defect states within the band gap, which create mid-gap energy levels that reduce the effective optical band gap.
Figure 6. (a) Kubelka-Munk transformed reflectance spectra, and (b) Tauc plots of SnO2–Co3O4–Nb2O5 ceramics with varying CeO2 contents
Table 3. Optical band-gap values and Tauc plot fitting parameters of SnO2–Co3O4–Nb2O5 ceramics with varying CeO2 content
|
CeO2 (mol%) |
Band Gap Eg (eV) |
Linear Fit R2 |
Urbach Energy (meV) |
Transition Type |
Fitting Residual (%) |
|
0 |
3.46 ± 0.03 |
0.994 |
152 ± 8 |
Indirect |
2.8 |
|
0.1 |
3.43 ± 0.03 |
0.992 |
171 ± 10 |
Indirect |
3.0 |
|
0.25 |
3.41 ± 0.03 |
0.991 |
188 ± 11 |
Indirect |
3.2 |
|
0.5 |
3.32 ± 0.02 |
0.990 |
215 ± 12 |
Indirect |
3.4 |
|
0.75 |
3.29 ± 0.03 |
0.989 |
238 ± 13 |
Indirect |
3.6 |
|
1.0 |
3.26 ± 0.03 |
0.988 |
253 ± 14 |
Indirect |
3.8 |
The Urbach energy (Eᵤ), which represents the width of the band tail states, increases from 152 ± 8 meV to 253 ± 14 meV with increasing CeO2 content. This broadening of the band tail indicates increased structural disorder and defect concentration, consistent with the oxygen vacancy formation discussed in the XPS analysis. The good linear fit (R2 > 0.988) for all compositions confirms the indirect transition nature of the band gap. The slight degradation in fitting quality at higher CeO2 concentrations (residual error increasing from 2.8% to 3.8%) suggests increasing defect-induced deviation from ideal crystallinity.
3.6 Electrical properties
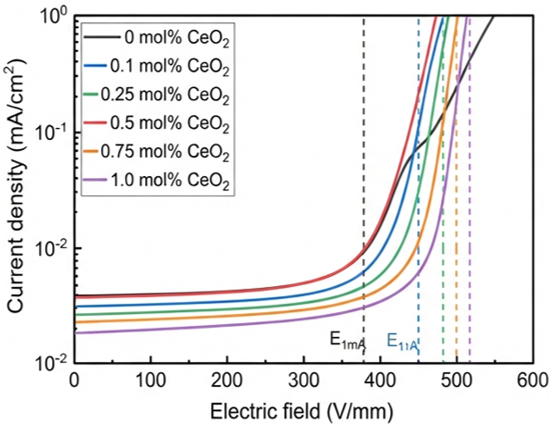
The J-E properties (Figure 7) clearly indicate that all the studied ceramics exhibit very pronounced nonlinear behavior. The addition of CeO2 noticeably improves their electrical behavior, as evidenced by the greater steepness of the breakdown curves and improved varistor parameters. As can be observed from Table 4, the nonlinear parameter (α) grows from 28.5 for the undoped compound up to 42.3 for 0.5 mol% CeO2 (48% increase), which is higher than the values obtained for conventional SnO2–Co3O4–Nb2O5–Cr2O3 ceramics [19]. For 1.0 mol% of CeO2, the nonlinear parameter is reduced to 35.0 (indicating degradation beyond the optimum content). At the same time, the breakdown field (E1mA) rises from 380 to 490 V mm-1 reflecting the combined effects of grain refinement and enhanced grain-boundary barriers.
Figure 7. J–E characteristics of SnO2–Co3O4–Nb2O5 ceramics with varying CeO2 contents
Table 4. Electrical parameters of SnO2–Co3O4–Nb2O5 ceramics with varying CeO2 content
|
CeO2 (mol%) |
E1mA (V/mm) |
α |
JL (µA/cm2) |
ΦB (eV) |
ρ (Ω·cm) |
|
0 |
380 ± 15 |
28.5 ± 1.2 |
42.3 ± 3.5 |
1.52 ± 0.04 |
1.8 × 10⁷ |
|
0.1 |
405 ± 18 |
31.8 ± 1.4 |
29.1 ± 2.8 |
1.60 ± 0.04 |
2.3 × 10⁷ |
|
0.25 |
442 ± 16 |
36.5 ± 1.3 |
15.8 ± 2.1 |
1.71 ± 0.03 |
3.1 × 10⁷ |
|
0.5 |
490 ± 14 |
42.3 ± 1.1 |
8.5 ± 1.2 |
1.82 ± 0.03 |
4.2 × 10⁷ |
|
0.75 |
472 ± 17 |
39.2 ± 1.3 |
13.0 ± 1.8 |
1.75 ± 0.04 |
3.8 × 10⁷ |
|
1 |
458 ± 19 |
35.0 ± 1.5 |
20.2 ± 2.3 |
1.67 ± 0.05 |
3.2 × 10⁷ |
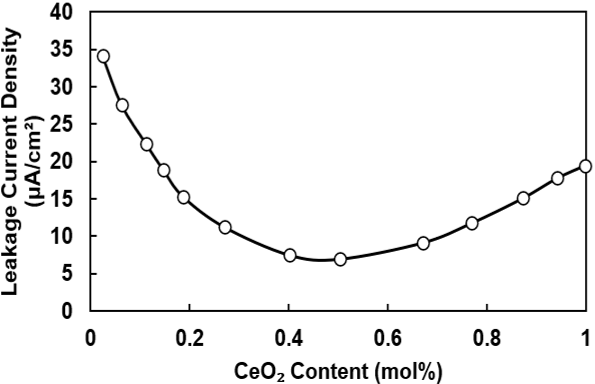
As shown in Figure 8, the leakage current density drops significantly from 42.3 μA cm⁻2 to 8.5 μA cm⁻2 for 0.5 mol% CeO2, representing an approximately 80% improvement. Such a reduced leakage current indicates improved efficiency in suppressing charge-carrier transport due to increased double Schottky barriers at low electric fields. The Schottky barrier height (ΦB) grows from 1.52 to 1.82 eV, while the resistivity increases from 1.8 × 10⁷ to 4.2 × 10⁷ Ω·cm at the optimal CeO2 content. In turn, at 1.0 mol% CeO2, the parameters ΦB and electrical characteristics deteriorate, indicating possible oversaturation of the grain boundaries due to the excess Ce. Thus, 0.5 mol% CeO2 yields the optimal combination of defect chemistry and grain-boundary engineering.
Figure 8. Leakage current density as a function of CeO2 content
The Schottky barrier heights were calculated using the Richardson-Schottky equation from temperature-dependent J-E measurements (25–200 ℃). The linear fitting of ln(J/T2) vs. E(1/2) yielded R2 values greater than 0.985 for all compositions, confirming the Schottky emission mechanism.
3.7 Impedance spectroscopy
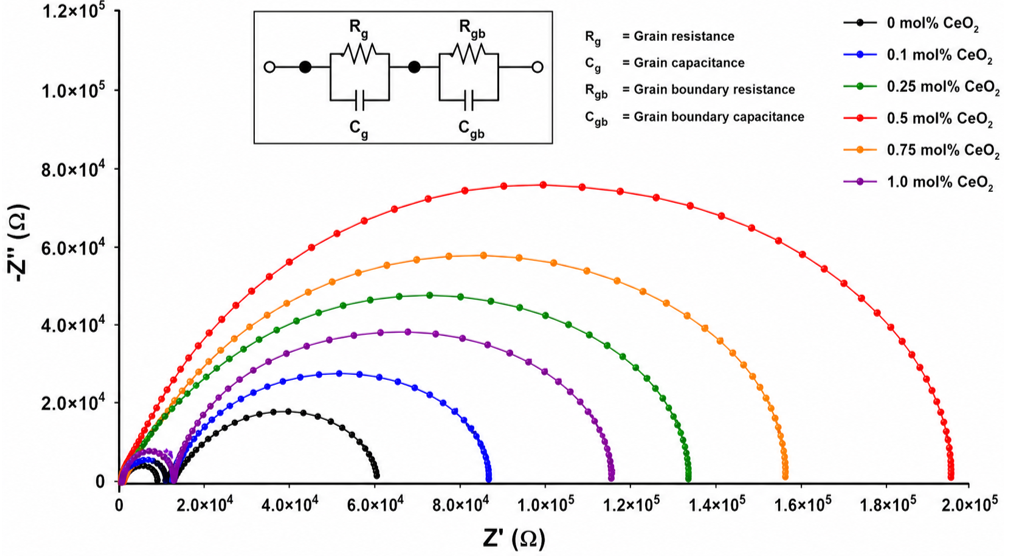
From Figure 9, there are two depressed semicircles for the grain (high-frequency) and grain-boundary (low-frequency) behaviors of the materials, thus demonstrating the grain-boundary influence on the electrical properties. The size of the grain-boundary semicircle grows significantly with an increase in CeO2 concentration until it attains the maximum value at 0.5 mol% CeO2, while the grain semicircle stays almost stable. The grain-boundary resistance (Rgb) is seen to grow from 2.3 × 10⁶ Ω to 8.7 × 10⁶ Ω, whereas the grain resistance (Rg) does not change noticeably. This decrease in grain-boundary capacitance (Cgb) points to larger depletion regions and higher barrier heights. These results correlate very well with the barrier heights found from J-E curves, which proves the fact that the increase in grain-boundary barrier height provides the enhanced nonlinear properties of the samples containing 0.5 mol% CeO2.
Figure 9. Nyquist plots of SnO2–Co3O4–Nb2O5 ceramics with varying CeO2 contents at room temperature. Inset: Equivalent circuit model
3.8 Mechanical properties
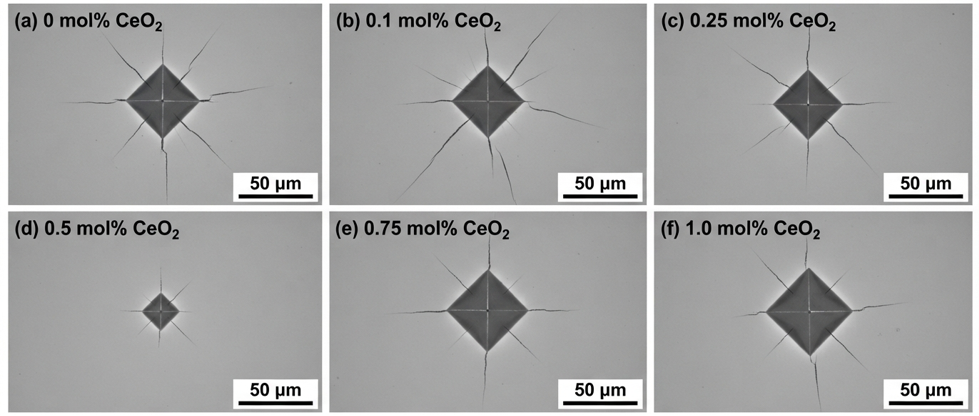
The mechanical behavior of SnO2-based varistor ceramics is important for achieving reliable functionality under high current, thermal, and mechanical stresses. According to Table 5, the mechanical properties are significantly improved with the addition of CeO2. In particular, the Vickers hardness (HV0.5) is increased from 6.8 ± 0.4 GPa to 8.5 ± 0.3 GPa in 0.5 mol% CeO2, which is attributed to grain size reduction and increased density (Figure 10), according to the Hall–Petch equation. Likewise, the fracture toughness increases from 1.8 ± 0.2 to 2.4 ± 0.2 MPa·m(1/2) due to microstructural homogeneity and low porosity.
Table 5. Mechanical properties of SnO2–Co3O4–Nb2O5 ceramics with varying CeO2 content
|
CeO2 (mol%) |
Vickers Hardness (Hv, GPa) |
Fracture Toughness (KIC) (MPa·m1/2) |
Young's Modulus E (GPa) |
Relative Density (%) |
|
0 |
6.8 ± 0.4 |
1.8 ± 0.2 |
185 ± 8 |
94.2 |
|
0.1 |
7.2 ± 0.3 |
1.9 ± 0.2 |
192 ± 7 |
95.1 |
|
0.25 |
7.8 ± 0.3 |
2.1 ± 0.2 |
201 ± 6 |
96.3 |
|
0.5 |
8.5 ± 0.3 |
2.4 ± 0.2 |
215 ± 6 |
97.8 |
|
0.75 |
8.2 ± 0.3 |
2.2 ± 0.2 |
208 ± 7 |
97.2 |
|
1.0 |
7.9 ± 0.4 |
2.1 ± 0.3 |
198 ± 8 |
96.5 |
Figure 10. Vickers indentation images of SnO2–Co3O4–Nb2O5 ceramics with varying CeO2 contents
Additionally, Young’s modulus is increased from 185 ± 9 GPa to 215 ± 6 GPa, showing improvement in stiffness and intergranular bond. Thus, the optimum composition of 0.5 mol% CeO2 provides not only improved mechanical characteristics but also enhanced electrical properties.
Apart from enhancing mechanical strength, microstructure densification is very important for ensuring the long-term reliability of SnO2-based varistors. The presence of pores and inhomogeneous grain sizes enhances electrical degradation through thermal, electrical, and environmental factors. When subjected to high-current surges, the thermal resistance of the pores acts as a thermal barrier, creating localized hotspots that degrade the Schottky barrier and ultimately cause electrical breakdown [20, 21]. Moreover, the dielectric differences between pores and the SnO2 material enhance the local electric field, thereby providing easy channels for current flow and leading to electrical failure. The interconnected pores serve as pathways for moisture and oxygen, which gradually alter grain boundary defect states and drive electrical aging.
The optimized composition containing 0.5 mol% CeO2, with a relative density of 97.8% and a porosity of only 2.2%, can effectively prevent these degradation processes. The compact and uniform microstructure ensures efficient heat dissipation, reduces the electric field concentration and environmental influence, and distributes electrical stresses across more grain boundaries. Thus, the CeO2-modified ceramics will simultaneously improve their mechanical strength, surge capability, and electrical stability.
3.9 Grain-boundary barrier formation mechanism
The improved electrical performance of the CeO2-doped SnO2-Co3O4-Nb2O5 varistor materials is attributed to the coupled effect of grain boundary engineering and defect engineering. The Co3O4 acts to form the electrically active grain boundaries, while the Nb2O5 acts as the donor dopant, thereby causing an increase in the electron concentration in the SnO2 grains. The mixed-valence Ce3+/Ce4+ redox couple introduces oxygen vacancies and increases the grain boundary interface states. As a result, depletion layers become broader as the Schottky barrier height increases. The leakage current is thereby reduced while the nonlinear coefficient and breakdown field are greatly increased. This is in good agreement with the results from the XPS, impedance, and electrical analyses. The best electrical performance observed in 0.5 mol% CeO2 is due to the combination of improved microstructure, high density, increased grain boundary resistance, and defect structure, while excess CeO2 causes grain boundary saturation.
3.10 Arrhenius analysis of grain and grain-boundary conductivity
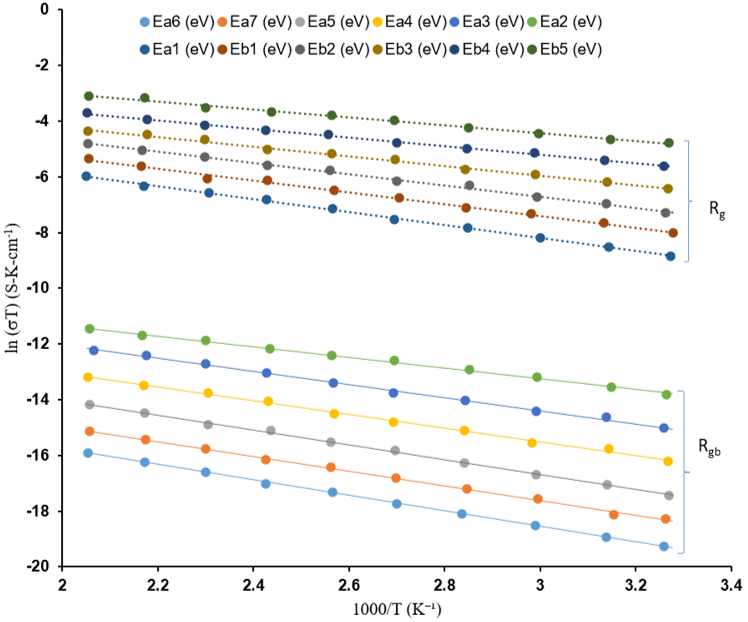
Temperature-dependent impedance was used to examine the thermally activated conduction behavior of CeO2-doped SnO2 varistor ceramics. As shown in Figure 11, the Arrhenius plots of both grain and grain-boundary conductivities exhibited a strong linear relationship over the temperature range studied, indicating that charge transport was thermally activated. The grain conduction activation energy was almost the same (0.34 - 0.39 eV) regardless of the doping percentage of CeO2. Therefore, the electron conduction inside the grains of the SnO2 was not affected by Ce doping.
On the other hand, the grain boundary activation energy increased from 0.71 eV for the undoped material to 0.95 eV for 0.5 mol% CeO2, and then slightly decreased as the CeO2 concentration increased. This indicates that the role of Ce is to alter the electrical response of grain boundaries due to increased electron trapping and oxygen-vacancy defect states. The consistency between the results of the Arrhenius relation (Figure 11), impedance, XPS, and J-E analysis proved that the improved electrical non-linearity of 0.5 mol% CeO2 was a result of the increased strength of the grain boundary Schottky barrier. This finding further supports the proposed grain-boundary barrier mechanism underlying the superior surge-protection characteristics of the optimized varistor ceramics.
Figure 11. Arrhenius plots of grain (Rg) and grain-boundary conductivity (Rgb) of SnO2–Co3O4–Nb2O5 ceramics with varying CeO2 contents
3.11 Comparison with literature
In accordance with Table 6, the electrical and microstructural characteristics of the CeO2-doped SnO2-Co3O4-Nb2O5 varistor are compared with those of some recently described SnO2-based varistor ceramics. The optimum doping content of 0.5 mol% CeO2 provides the nonlinear coefficient (α = 42.3), breakdown voltage at 1 mA/cm2 (E1mA = 490 V mm−1), leakage current (JL = 8.5 μA cm−2), grain size (6.8 μm), and relative density (97.8%), which indicate a good compromise between the electrical characteristics and microstructure. The nonlinear coefficient value is higher in comparison with that of B2O3- and Ni2O3-doped SnO2 ceramics and equivalent to Cr2O3-containing samples. In contrast, the leakage current is among the lowest for Bi-free SnO2 varistors. Although the nonlinear coefficient value of Gd2O3-modified ceramics is higher (α ≈ 55) [22], the CeO2-modified varistor has satisfactory electrical characteristics along with superior densification and microstructure.
Apart from having good electrical characteristics, CeO2 also exhibits several practical benefits, such as natural abundance, low cost, thermal stability during the sintering process, and improved compositional reproducibility. The mixed-valence state of Ce3+/Ce4+ enables better control over oxygen vacancy formation and grain-boundary engineering, thereby increasing densification, mechanical strength, and Schottky-barrier stability. Such a combination of features makes CeO2 a potential dopant material for fabricating high-performance, Bi-free SnO2 varistors.
Table 6. Comparison of electrical properties and microstructural characteristics of SnO2 varistor ceramics against recent literature
|
System |
Sintering T (°C) |
α |
E1mA (V/mm) |
JL (µA/cm2) |
Grain Size (µm) |
Density (%) |
Ref. |
|
SnO2-Co3O4-Nb2O5-Cr2O3 |
1250 |
41–45 |
4390 |
-- |
-- |
-- |
[23] |
|
SnO2-Co3O4-Cr2O3-Nb2O5-B2O3 |
1300 |
36 |
525 |
11.2 |
-- |
-- |
[24] |
|
SnO2-Co3O4-Cr2O3-Ta2O5-Gd |
1300 |
55 |
568 |
7.74×10³ |
-- |
-- |
[25] |
|
SnO2-Co3O4-Nb2O5-Ni2O3 |
— |
37 |
549 |
4.73 |
-- |
-- |
[26] |
|
SnO2-Co3O4-Nb2O5-La2O3 |
1300 |
-- |
324 |
98 |
7.24 |
98.2 |
[27] |
|
SnO2-Co3O4-Nb2O5-CeO2 (This work) |
1300 |
42.3 |
490 |
8.5 |
6.8 |
97.8 |
-- |
Bi-free SnO2–Co3O4–Nb2O5 varistors incorporating CeO2 were successfully prepared using a conventional solid-state sintering process, and with the addition of CeO2, the average grain size decreased from 12.5 µm to 6.8 µm. At the same time, the densification efficiency increased from 94.2% to 97.8% in the optimum amount of 0.5 mol%. XPS analysis showed the formation of a mixed Ce3+/Ce4+ state, and the Ce3+/(Ce3++Ce4+) ratio increased from 0.15 to 0.32, with the oxygen-vacancy-related O 1s component attaining a maximum value of 38.7% at 0.5 mol% CeO2. The sample with 0.5 mol% CeO2 had the best nonlinear coefficient (α = 42.3), the least leakage current (8.5 µA/cm2), and the highest Schottky barrier height (1.82 eV). Such improvements in electrical parameters were attributed to the Ce grain-boundary segregation effect, enhanced electron trapping, and the formation of double Schottky barriers. In terms of mechanical properties, the sample with 0.5 mol% CeO2 had better values of hardness (8.5 GPa) and fracture toughness (2.4 MPa·m(1/2)). These results indicate the successful use of CeO2 as a grain boundary engineering material for the preparation of Bi-free SnO2 varistors with enhanced electrical and mechanical performance for surge protection applications.
The author gratefully acknowledges the support of the Ministry of Education, Iraq, and Geniuses High School for Outstanding Students, under the General Directorate of Al Rusafa the Third, Baghdad, Iraq, for providing the institutional support and facilities necessary to carry out this research.
The authors used ChatGPT and Grammarly only for English language editing and proofreading. All research content, analysis, interpretation, and conclusions were developed by the authors.
|
α |
nonlinear coefficient, calculated from J-E characteristics |
|
ΦB |
Schottky barrier height at grain boundaries (eV) |
|
E1mA |
breakdown electric field at current density of 1 mA/cm2 (V/mm) |
|
JL |
leakage current density at 0.8 E1mA (μA/cm2) |
|
Rg |
grain resistance (Ω) |
|
Rgb |
grain boundary resistance (Ω) |
|
vö |
doubly positively charged oxygen vacancy (Kröger-Vink notation) |
|
Ce3+/Ce4+ |
mixed valence states of cerium ions |
|
Ea |
activation energy for electrical conduction (eV) |
|
d |
average grain size (μm) |
[1] Rafique, S.F., Shen, P., Wang, Z., et al. (2018). Global power grid interconnection for sustainable growth: Concept, project and research direction. IET Generation, Transmission & Distribution, 12(13): 3114-3123. https://doi.org/10.1049/iet-gtd.2017.1536
[2] Peng, F.Z., Liu, C.C., Li, Y., Jain, A.K., Vinnikov, D. (2024). Envisioning the future renewable and resilient energy grids—A power grid revolution enabled by renewables, energy storage, and energy electronics. IEEE Journal of Emerging and Selected Topics in Industrial Electronics, 5(1): 8-26. https://doi.org/10.1109/JESTIE.2023.3343291
[3] Khanmiri, D.T., Ball, R., Mosesian, J., Lehman, B. (2016). Degradation of low voltage metal oxide varistors in power supplies. In 2016 IEEE Applied Power Electronics Conference and Exposition (APEC), Long Beach, CA, USA, pp. 2122-2126. https://doi.org/10.1109/APEC.2016.7468160
[4] Frigura-Iliasa, F.M., Musuroi, S., Sorandaru, C., Vatau, D. (2019). Case study about the energy absorption capacity of metal oxide varistors with thermal coupling. Energies, 12(3): 536. https://doi.org/10.3390/en12030536
[5] Metz, R., Delalu, H., Vignalou, J.R., Achard, N., Elkhatib, M. (2000). Electrical properties of varistors in relation to their true bismuth composition after sintering. Materials Chemistry and Physics, 63(2): 157-162. https://doi.org/10.1016/S0254-0584(99)00227-8
[6] Wang, Y., Zhang, J., Xiong, J., Liu, J., Zhu, L., Han, Y. (2026). Research on the electrical properties and microstructural characteristics of ZnO varistors under impulse current. Crystals, 16(6): 382. https://doi.org/10.3390/cryst16060382
[7] Zuca, S., Terzi, M., Zaharescu, M., Matiasovsky, K. (1991). Contribution to the study of SnO2-based ceramics: Part II. Effect of various oxide additives on the sintering capacity and electrical conductivity of SnO2. Journal of Materials Science, 26: 1673-1676. https://doi.org/10.1007/BF00544681
[8] Os'kina, T.E., Zaborenko, K.B., Mel'nikova, I.G., et al. (1982). Sintering of tin oxide ceramic with additives. Glass and Ceramics, 39: 617-620. https://doi.org/10.1007/BF00702098
[9] Varela, J.A., Whittemore, O.J., Longo, E. (1990). Pore size evolution during sintering of ceramic oxides. Ceramics International, 16(3): 177-189. https://doi.org/10.1016/0272-8842(90)90053-I
[10] Presley, R.E., Munsee, C.L., Park, C.H., Hong, D., Wager, J.F., Keszler, D.A. (2004). Tin oxide transparent thin-film transistors. Journal of Physics D: Applied Physics, 37(20): 2810. https://doi.org/10.1088/0022-3727/37/20/006
[11] Yang, Y.T., Lin, S.C., Wang, C.C., Ho, Y.R., Chen, J.Z., Huang, J.J. (2024). Performance improvement of TiO2 ultraviolet photodetectors by using atomic layer deposited Al2O3 passivation layer. Micromachines, 15(11): 1402. https://doi.org/10.3390/mi15111402
[12] Glot, A.B., Sandoval-Garcia, A.P., Gaponov, A.V., et al. (2009). Electronic properties of SnO2-based ceramics with double function of varistor and humidity sensor. Advances in Technology of Materials and Materials Processing Journal, 10: 21-32. https://doi.org/10.1023/A:1008821808693
[13] Parra, R., Aldao, C.M., Varela, J.A., Castro, M.S. (2005). The role of oxygen vacancies on the microstructure development and on the electrical properties of SnO2-based varistors. Journal of Electroceramics, 14: 149-156. https://doi.org/10.1007/s10832-005-0879-1
[14] Bastami, H., Taheri-Nassaj, E., Smet, P.F., Korthout, K., Poelman, D. (2011). (Co, Nb, Sm)-doped tin dioxide varistor ceramics sintered using nanopowders prepared by coprecipitation method. Journal of the American Ceramic Society, 94(10): 3249-3255. https://doi.org/10.1111/j.1551-2916.2011.04467.x
[15] Bueno, P.R., de Cassia-Santos, M.R., Leite, E.R., et al. (2000). Nature of Schottky-type barrier of highly dense SnO2 systems displaying nonohmic behavior. Journal of Applied Physics, 88: 6545-6548. https://doi.org/10.1063/1.1320012
[16] Antunes, A.C., Antunes, S.R.M., Zara, A.J., Pianaro, S.A., Longo, E., Varela, J.A. (2002). Effect of Fe2O3 doping on the electrical properties of a SnO2-based varistor. Journal of Materials Science, 37: 2407-2411. https://doi.org/10.1023/A:1015458700086
[17] Oliveira, M.M., Bueno, P.R., Longo, E., Varela, J.A. (2002). Influence of La2O3, Pr2O3 and CeO2 on the nonlinear properties of SnO2 multicomponent varistors. Materials Chemistry and Physics, 74(2): 150-153. https://doi.org/10.1016/S0254-0584(01)00458-8
[18] Penrose, C., Steiner, P., Gladden, L.F., et al. (2021). A simple liquid state 1H NMR measurement to directly determine the surface hydroxyl density of porous silica. Chemical Communications, 57: 12804-12807. https://doi.org/10.1039/D1CC03959H
[19] Bondarchuk, A.N., Glot, A.B., Mazurik, S.V., Marquez Miranda, M., Jimenez-Santana, G. (2009). Capacitance-vs-voltage and frequency characteristics of SnO2–Co3O4–Nb2O5–Cr2O3 ceramics. The European Physical Journal Applied Physics, 48(3): 30302. https://doi.org/10.1051/epjap/2009173
[20] Masteghin, M.G., Bertinotti, R.C., Orlandi, M.O. (2017). High-performance and low-voltage SnO2-based varistors. Ceramics International, 43(16): 13759-13764. https://doi.org/10.1016/j.ceramint.2017.07.089
[21] Fu, X., Jiang, F., Gao, R., Peng, Z. (2014). Microstructure and nonohmic properties of SnO2-Ta2O5-ZnO system doped with ZrO2. The Scientific World Journal, 2014: 754890. https://doi.org/10.1155/2014/754890
[22] Dibb, A., Tebcherani, S.M., Lacerda, W., Cilense, M., Varela, J.A., Longo, E. (2002). Influence of the rare-earths oxides doped on the SnO2-CoO-MnO2-Ta2O5 varistor system. Journal of Materials Science: Materials in Electronics, 13: 567-570. https://doi.org/10.1023/A:1019638000939
[23] Wang, W.X., Wang, J.F., Chen, H.C., Su, W.B., Zang, G.Z. (2003). Effects of Cr2O3 on the properties of (Co, Nb)-doped SnO2 varistors. Materials Science and Engineering: B, 99(1-3): 470-474. https://doi.org/10.1016/S0921-5107(02)00477-4
[24] Gong, S.Q., Zhao, H.F. (2025). The effect of B2O3 doping on the properties of electrical and thermal conductivity for SnO2 varistors. Materials, 18(7): 1399. https://doi.org/10.3390/ma18071399
[25] Gaponov, O.V. (2018). Humidity sensors based on SnO2–Co3O4–Nb2O5–Cr2O3 semiconductor varistor ceramics. Sensor Electronics and Microsystem Technologies, 15(3): 19-30. https://doi.org/10.18524/1815-7459.2018.3.142041
[26] Sun, F., Zhao, H.F., Miao, K. (2024). Influence mechanism of Ni2O3 doping on leakage current of SnO2 varistor ceramics. International Journal of Applied Ceramic Technology, 21(5): 3089-3096. https://doi.org/10.1111/ijac.14785
[27] Alfahed, B.H. (2021). Studying the electrical properties and microstructure of the SnO2–Co3O4–Nb2O5 varistor doped with lanthanum oxide (La2O3). Damascus University Journal for the Basic Sciences, 35(1): 45-61. https://journal.damascusuniversity.edu.sy/index.php/basj/article/view/1061.