Aissam Mesbahi | Ghania Nigri* | Brahim Lafifi | Assia Aidoud | Chiraz Kechkar | Charaf Eddine Sellaoui
© 2026 The authors. This article is published by IIETA and is licensed under the CC BY 4.0 license (http://creativecommons.org/licenses/by/4.0/).
OPEN ACCESS
This study investigates the feasibility of producing a sustainable composite cement by partially replacing Portland cement with a finely ground blend of waste glass powder, brick powder, and blast furnace slag. A total replacement level of 20% was adopted to reduce the environmental impact of cement production while maintaining satisfactory performance. The developed cements were characterized through chemical, physical, rheological, and mechanical tests in accordance with relevant standards. Fresh-state properties were evaluated using consistency, setting time, flow spread, and apparent density measurements. The results showed that blended cements had lower densities than the reference cement due to the lower specific gravity of the waste materials. Initial setting times remained close to those of the control cement, whereas final setting times were influenced by the nature of the dominant additive. In particular, brick powder accelerated setting and increased water demand. In the hardened state, the incorporation of supplementary materials enhanced microstructural densification and improved long-term mechanical performance. Statistical analyses using Analysis of Variance (ANOVA) and response surface methodology (RSM) were conducted to evaluate the effects and interactions of the constituents, develop predictive models, and optimize the formulations. The models demonstrated high coefficients of determination, indicating strong predictive capability. The optimal composition was identified as 80% cement, 5% brick powder, 10% blast furnace slag, and 5% glass powder, providing a balanced compromise between mechanical performance, durability, and environmental sustainability.
cement, rheological properties, mineral wastes, valorization, analysis of variance, response surface methodology
Global cement production reached approximately 4.4 to 4.5 billion tonnes in 2021 and continues to grow rapidly to meet the increasing demand from the construction sector [1, 2]. However, the cement industry is among the most energy-intensive and polluting in the world, accounting for between 5 and 9% of global anthropogenic carbon dioxide (CO2) emissions [1, 3-5]. The production of one tonne of Portland cement generates on average between 0.7 and 1 tonne of CO2, primarily due to high-temperature calcination reactions (>1200 ℃) and the high consumption of fossil fuels [1, 4, 6]. This situation contributes significantly to global warming, environmental degradation, and the depletion of non-renewable natural resources, as cement production requires approximately 1.7 tonnes of raw materials per tonne of finished product [3, 5, 6].
Faced with these environmental and energy challenges, research is focusing on the development of alternative cementitious materials and the valorization of industrial waste as partial substitutes for Portland cement [5-7]. The use of by-products such as granulated blast furnace slag, ash, and other industrial residues not only reduces CO2 emissions and the consumption of natural resources but also improves certain properties of concrete, particularly its durability and chemical resistance [6, 7]. Furthermore, the continuous increase in industrial and non-biodegradable waste constitutes a major environmental challenge, reinforcing the need for effective valorization strategies within a sustainable development and circular economy framework [7, 8]. Thus, the partial substitution of cement with valorized waste appears to be a promising solution for reconciling material performance, carbon footprint reduction, and environmental protection.
Concrete is one of the most widely used building materials in the world; however, its main constituent, Portland cement, is responsible for a significant portion of natural resource depletion and greenhouse gas emissions [3, 6]. To mitigate these environmental impacts, much research has focused on the use of additional cementitious materials, such as fly ash, granulated blast furnace slag, and silica fume, due to their pozzolanic or hydraulic properties that improve the mechanical performance, durability, and chemical resistance of concrete while reducing its carbon footprint [2, 4, 6]. However, the decreasing availability of some of these industrial by-products, as well as their sometimes high cost, particularly for silica fume, currently constitutes significant limitations to their widespread use [2, 4]. Furthermore, construction and demolition waste, which represents more than 30% of global solid waste, also appears as a promising source of alternative materials, particularly in the form of recycled brick powder, the incorporation of which improves several properties of concrete [4].
In this context, the valorization of abundant waste such as used glass is attracting increasing interest. Rich in silica (over 70%) and available in large quantities, glass can be ground into a fine powder and used as a complementary cementitious additive or partial substitute for cement [2, 5]. Recycled glass powder exhibits pozzolanic activity, allowing it to react with calcium hydroxide to form calcium silicate hydrates (C–S–H), thus contributing to improved concrete strength and durability [5]. This approach not only reduces the volume of non-biodegradable waste sent to landfills but also decreases the carbon footprint associated with cement production, while aligning with the principles of a circular economy and sustainable development [5, 8].
Several recent studies have highlighted the potential of alternative materials to improve the environmental sustainability and performance of concrete. Kumar et al. [6] showed that partially replacing cement with granulated blast furnace slag (GGBS) and quartz powder reduces the carbon footprint while improving durability, density, and mechanical performance, with an optimal substitution rate of approximately 15% leading to reduced porosity and improved resistance to carbonation. Zhu et al. [9] demonstrated that incorporating blast furnace slag powder into alkali-activated recycled cement pastes significantly increases mechanical strength, achieving compressive strengths of 51.9 MPa at 90 days for a 30% replacement rate, thanks to a denser microstructure observed by scanning electron microscopy. Furthermore, Handel et al. [10] studied the use of alternative aggregates such as recycled gravel and crystallized slag. Showing that a substitution rate of 50% with crystallized slag significantly improves the mechanical strength of concrete, while recycled gravel. Although it can improve compressive strength, it tends to reduce tensile and flexural strengths due to its porosity and fractured nature, thus confirming the importance of the choice of waste type and its incorporation rate to optimize the performance of sustainable concrete.
Numerous studies have demonstrated the potential of recycled clay brick powder as a supplementary cementitious material (SCM) or partial substitute for Portland cement, with a view to reducing carbon footprint and valorizing construction waste. Subramanian et al. [1] showed that the fineness of the brick powder strongly influences the properties of mortars, with a 60-minute grinding time resulting in good workability and satisfactory mechanical performance while reducing energy consumption and CO2 emissions. Lliso-Ferrando et al. [4] observed that replacing 35% to 40% of the cement with recycled brick powder reduced porosity by up to 50% and significantly improved resistivity and resistance to chloride penetration. Kryzhanovskyi et al. [11] confirmed the pozzolanic activity of brick powder by microstructural analyses (TGA, SEM, EDX), highlighting the formation of C–S–H and calcium-aluminate-silicate (C–A–S) phases, with optimal performance at a substitution rate of approximately 15% and a particle size close to 32 µm. These results are consistent with those of Yildirim and Uysal [12], who showed that calcining brick powder at 600–800 ℃ improves its reactivity and its contribution to the development of long-term strength, particularly at 90 days.
Furthermore, several studies have highlighted the influence of the substitution rate and curing conditions on the mechanical, rheological, and thermal properties of modified mortars and concretes. Ramanamurthy and Himabindu [13] and Sinkhonde et al. [14] demonstrated a decrease in workability and, at high concentrations, a reduction in mechanical strength, while identifying relatively low optimal rates (approximately 5% to 10%) to maintain short-term performance. Brixi et al. [15] showed that brick dust improves the thermal insulation properties of mortars, but that its mechanical effect is highly dependent on the curing environment, with an optimal rate of approximately 20% recommended depending on the thermal and hygrometric conditions. Overall, these studies confirm that recycled brick powder is a promising active mineral addition, capable of contributing to the durability of cementitious materials, provided that its fineness, heat treatment, incorporation rate and implementation conditions are optimized [1, 4, 11-15].
Several recent studies have highlighted the strong potential of recycled glass powder as an additional cementitious material or partial substitute for Portland cement, both for reducing carbon footprint and for improving certain properties of concrete and cement pastes. Using a theoretical approach based on the concept of the mole, Chand et al. [2] demonstrated that glass powder could react with portlandite to form additional C–S–H, which theoretically allows substitution rates above 20%. In practice, however, such levels are constrained by slow reaction kinetics, glass particle size, and the presence of unreacted particles.
Qader et al. [5] experimentally confirmed that a substitution rate of approximately 15% significantly increases compressive strength (+14.7%) and tensile splitting strength (+22.7%) at 28 days, while higher rates alter the strength development mechanisms differently. Konin et al. [8] observed that concretes containing glass powder generally exhibit better mechanical and physical properties than those incorporating only glass aggregates, and that glass powder also helps reduce alkali-silica reaction expansion at rates of 5% and 10%.
Furthermore, numerous studies have reported that the positive influence of glass powder on the microstructure, durability, and specific performance of certain cementitious matrices. Alfeluo et al. [16] showed that the addition of glass powder improves the chemical composition of cement and increases its resistance to sulfates, particularly for applications such as oil well cementing. Yannick et al. [17] demonstrated that the incorporation of micrometric glass powder (5–35%) into belite-based cements improves workability, extends setting times, and increases medium- and long-term mechanical strength, with confirmed formation of secondary C–S–H and reduced porosity. Ye et al. [18] showed that the addition of ultrafine glass powder significantly improves the initial mechanical properties, compactness, and permeability of oil well cementitious materials, with very high one-day strength gains at contents close to 9%. Overall, these results confirm that recycled glass powder is a promising active mineral waste addition capable of improving the mechanical performance and durability of cementitious materials.
Recent investigations confirm the potential of alternative materials as partial substitutes for Portland cement to improve the environmental sustainability of concrete while maintaining, or even improving, its mechanical performance. Tan et al. [7] showed that combining steel slag powder, granulated blast furnace slag, and desulfurization gypsum increases the compressive strength of stabilized materials based on recycled aggregates while reducing drying shrinkage and the risk of cracking, thanks to the joint formation of CSH gels, aluminate phases, and ettringite. Khan et al. [19] compared several natural and industrial cementitious additions, highlighting the superiority of natural pozzolans in terms of strength and durability, as well as the promising performance of recycled glass powder as an alternative to fly ash, in a performance-based formulation approach. In the context of ultra-high-performance concrete, Sharma et al. [20] demonstrated that partially replacing cement with blast furnace slag and limestone powder significantly reduces shrinkage and carbon footprint, while maintaining strengths compatible with the ultra-high performance concrete (UHPC) class. Finally, Pagar et al. [21] showed that incorporating up to 20% dolomite powder and brick kiln dust improves the mechanical properties of standard concrete while reducing the environmental impact associated with cement production. All of these studies highlight the potential of alternative materials for developing more durable, high-performance, and economically viable concrete.
Several recent studies have highlighted the growing interest in advanced numerical and statistical methods, particularly response surface methodology (RSM) [22-24], for optimizing formulations of durable concrete and mortars incorporating alternative materials. Donderiya et al. [25] combined a multi-objective optimization approach with cost-performance analysis to identify an optimal formulation based on fly ash and Kota stone powder, while Laidani et al. [26] used artificial neural networks to model the influence of brick powder content and fineness on the properties of self-compacting mortars. Adanu et al. [27] applied RSM based on a centered composite design of experiments to determine the optimal substitution rate of glass powder and eggshell powder that maximizes the compressive strength of the mortar. Similarly, Handel et al. [10] combined a Box-Behnken design with RSM to predict and optimize the mechanical strength of concretes containing alternative aggregates, with excellent predictive accuracy. Bouzeroura-Mansour et al. [28] confirmed, using RSM coupled with Analysis of Variance (ANOVA), the relevance of probabilistic models for predicting the evolution of the mechanical properties of cement pastes incorporating cement kiln dust. Finally, Dahish et al. [29] combined RSM and artificial neural networks to model and optimize the mechanical behavior of concretes containing marble and granite waste powders exposed to high temperatures, showing that these approaches effectively capture nonlinear effects and complex interactions between parameters. Taken together, these studies demonstrate that RSM, alone or coupled with artificial intelligence techniques, is a powerful tool for rational design, multi-criteria optimization, and reliable prediction of the performance of durable cementitious materials.
This study investigates the feasibility of producing CPJ CEM II/A cements through the partial replacement of cement with a finely ground mixture of brick waste, blast furnace slag, and waste glass. A total substitution rate of 20% was adopted, corresponding to the combined contribution of the three waste materials, in line with current standards for blended cements. Eleven cement formulations, including a reference cement without additions, were prepared and systematically evaluated.
The experimental program involved comprehensive chemical, physical, rheological, and mechanical characterization, conducted in accordance with Algerian and international standards. Fresh-state properties were assessed through consistency, setting time, and flow measurements, while hardened-state performance was evaluated using density, porosity, ultrasonic velocity, and mechanical strength tests. To complement the experimental investigation, RSM combined with ANOVA was employed to statistically analyze the individual and interactive effects of the waste materials, develop predictive models, and identify optimal formulations.
The overarching objective of this work is to demonstrate that the synergistic valorization of blast furnace slag, waste glass, and brick waste can lead to environmentally friendly composite cements exhibiting satisfactory rheological behavior, mechanical performance, and durability. By reducing cement content while maintaining compliance with performance requirements, this approach contributes to lowering CO2 emissions and promoting more sustainable cement production practices.
2.1 Raw materials
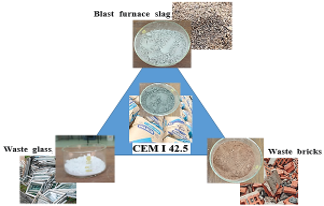
The raw materials used in this study, as shown in Figure 1, included ordinary Portland cement El Beskria (CEM I 42.5) produced by the Biskra plant, along with mineral waste additions consisting of waste brick from the Guelma region, blast furnace slag supplied by the El Hadjar steel plant in Annaba, and waste glass collected from broken transparent window glass. The mineral waste additions were incorporated as supplementary cementitious materials. All raw materials were dried, ground, and sieved to a particle size below 100 µm. Their main physical and chemical properties were subsequently characterized.
Figure 1. Protocol of prepared materials
The chemical compositions of CEM I cement, brick waste, waste glass, and blast furnace slag were determined using X-ray fluorescence (XRF) analysis. The corresponding results are presented in Table 1.
As shown in Table 1, both brick waste and waste glass are characterized by high silica (SiO2) contents and relatively low lime (CaO) contents compared to blast furnace slag. Brick waste exhibits the highest alumina (Al2O3) content among the three materials, followed by slag, while the alumina content of waste glass does not exceed 1%. This compositional profile confirms the predominantly pozzolanic nature of brick, blast furnace slag and glass powders.
Waste glass contains a relatively high sodium oxide (Na₂O) content (14.01 wt.%); therefore, its incorporation into cementitious materials should be carefully controlled.
In the present study, the glass powder was used as a finely ground supplementary cementitious material (particle size < 100 µm) at a maximum replacement level of 10% by mass of cement. At this fineness and replacement level, glass powder generally exhibits pozzolanic activity and reduces the potential risk of alkali–silica reaction (ASR) compared with the use of waste glass as aggregate [30, 31].
Table 1. Chemical composition of the waste materials
|
Materials |
SiO2 |
Al2O3 |
Fe2O3 |
CaO |
MgO |
SO3 |
K2O |
Na2O |
Cl- |
LOI |
|
CEMI |
42.5 |
19.86 |
5.06 |
3.70 |
63.96 |
2.30 |
3.09 |
0.71 |
0.28 |
0.035 |
|
Slag |
37.50 |
8.39 |
0.79 |
43.11 |
3.41 |
0.36 |
0.92 |
0.14 |
- |
0.20 |
|
Brick |
64.30 |
20.80 |
6.60 |
0.85 |
1.25 |
0.10 |
1.94 |
0.23 |
0.028 |
1.96 |
|
Glass |
58.94 |
0.94 |
0.02 |
8.26 |
2.81 |
0.07 |
0.51 |
14.01 |
- |
1.00 |
According to Nigri et al. [32], brick waste with such a chemical composition can be classified as a highly reactive pozzolanic material, making it suitable for use in concrete applications. Blast furnace slag, on the other hand, is characterized by a high CaO content, which promotes hydraulic activity and contributes to setting and strength development. A relatively elevated Al2O3 content is also advantageous, as it enhances early-age strength. The slag used in this study satisfies both requirements. Nevertheless, the influence of MgO content should be carefully considered, as excessive amounts may affect dimensional stability.
The hydraulic activity of slag is known to increase with higher values of both basicity and acidity moduli. In particular, an increase in the acidity modulus accelerates the hardening rate of ground slag. The slag used in this study exhibits an acidity modulus (Ma) of 0.22, classifying it as a basic slag, which is favorable for cementitious applications.
2.2 Preparation of cement samples
After separate grinding, sieving, proportioning, and homogenization of the waste materials, the blended cement formulations were prepared according to a constrained Simplex Lattice mixture design generated using Design-Expert software. The total clinker replacement level was fixed at 20 wt.%, while the proportions of blast furnace slag, brick powder, and glass powder were considered as the mixture components. Each component was constrained between 5 wt.% and 10 wt.%, based on previous studies and practical considerations to ensure adequate workability and mechanical performance.
The experimental design consisted of 14 runs, corresponding to 11 distinct formulations. Two formulations were replicated to estimate the pure experimental error and assess the reproducibility of the measurements: the mixture containing 7.5 wt.% slag, 7.5 wt.% brick powder, and 5 wt.% glass powder was tested twice, whereas the mixture containing 5 wt.% slag, 7.5 wt.% brick powder, and 7.5 wt.% glass powder was tested three times. All 14 runs were used for the statistical analysis and model development, whereas the results presented in the tables and figures correspond to the average values of the replicated formulations.
The selected design points included the vertices, edge points, centroid, and interior points of the constrained Simplex Lattice design, ensuring efficient coverage of the experimental domain for developing the mixture model. The blended cements were subsequently subjected to comprehensive characterization of their chemical, physical, mechanical, and rheological properties, and their performance was compared with that of the reference cement (CPA CEM I 42.5). The compositions of the investigated formulations are listed in Table 2.
Table 2. Designation and proportioning of the prepared cements.
|
Cements |
C0 |
C1 |
C2 |
C3 |
C4 |
C5 |
C6 |
C7 |
C8 |
C9 |
C10 |
|
CEM I (%) |
100 |
80 |
80 |
80 |
80 |
80 |
80 |
80 |
80 |
80 |
80 |
|
Slag (%) |
0 |
7.5 |
8.33 |
5 |
7.5 |
5 |
5 |
10 |
5.83 |
5.83 |
6.67 |
|
Brick (%) |
0 |
7.5 |
5.83 |
7.5 |
5 |
10 |
5 |
5 |
8.33 |
5.83 |
6.67 |
|
Glass (%) |
0 |
5 |
5.83 |
7.5 |
7.5 |
5 |
10 |
5 |
5.83 |
8.33 |
6.67 |
2.3 Preparation of standardized mortars
The tests were conducted on standard mortar prisms measuring (40 × 40 × 160) mm³. The cement samples were mixed with standardized sand and water using the prescribed proportions: 450 ± 2 g of cement, 1350 ± 5 g of standardized sand, and 225 ± 1 g of water. These quantities were sufficient to produce three mortar prisms of (40 × 40 × 160) mm³ for each formulation.
2.4 Test performed
2.4.1 Characterization of cement powders
The cement powders were subjected to chemical, physical, and mechanical characterization. Their chemical composition was determined by XRF. The absolute density, the apparent density and the specific surface Blaine (SSB) area of the anhydrous cement are measured in accordance with standard norms.
2.4.2 Characterization of cement pastes
The normal consistency, as well as the initial and final setting times of the cement pastes, were determined using a Vicat apparatus in accordance with standard EN 196-3:2016 test method [33]. These measurements were performed on fresh pastes maintained at a controlled laboratory temperature of 21 ± 1 ℃ using a Vicat apparatus.
2.4.3 Characterization of cement mortars
The absolute density of fresh mortar was measured in accordance with EN 1015-6:2006 [34], while workability was assessed by the flow table test following EN 1015-3:2006 [35].
Water absorption by total immersion was determined following the experimental procedure described by Bouras et al. [36]. After curing in water for 28 days, the specimens were removed, oven-dried to constant mass, and subsequently immersed in water for an additional 48 hours.
The porosity accessible to water was evaluated using two complementary methods: hydrostatic weighing, as reported by Nigri et al. [37] and the boiling method according to ASTM C642-21:2021 [38]. Capillary water absorption was assessed following EN 13057:2002 [39]. For the mechanical properties, the ultrasonic pulse velocity (UPV) test, was used to evaluate the compactness and internal quality of the cementitious. For the mechanical properties, the ultrasonic pulse velocity (UPV) test, was used to evaluate the compactness and internal quality of the cementitious materials, it was performed in accordance with EN 12504-4:2021 [40]. Compressive and flexural strengths were also determined using standard procedures.
For clarity, the notation C is used to designate the cement samples, while MC refers to the mortar compositions throughout this study.
3.1 Characterization of the prepared cements
3.1.1 Chemical characterization
The chemical compositions of the prepared cements, determined by XRF analysis, together with the experimentally measured free lime (CaO) content and LOI, are presented in Table 3.
Table 3. Oxide content of the anhydrous cements (average mass percentage)
|
Samples |
SiO2 |
Al2O3 |
Fe2O3 |
CaO |
MgO |
SO3 |
K2O |
Na2O |
Cl- |
CaO Free |
LOI |
|
C0 |
20.16 |
5.58 |
3.19 |
64.24 |
1.39 |
1.75 |
0.39 |
0.10 |
0.003 |
0.15 |
3.02 |
|
C1 |
28.64 |
6.11 |
3.35 |
57.99 |
1.69 |
1.39 |
0.51 |
0.61 |
0.005 |
0.13 |
3.01 |
|
C2 |
27.97 |
5.95 |
3.13 |
57.94 |
1.71 |
1.38 |
0.48 |
0.63 |
0.006 |
0.13 |
2.90 |
|
C3 |
29.64 |
5.68 |
3.34 |
57.15 |
1.67 |
1.38 |
0.50 |
0.82 |
0.011 |
0.13 |
2.81 |
|
C4 |
27.85 |
5.42 |
3.13 |
57.66 |
1.68 |
1.48 |
0.47 |
0.79 |
0.005 |
0.10 |
2.70 |
|
C5 |
28.61 |
6.35 |
3.42 |
55.95 |
1.59 |
1.44 |
0.55 |
0.72 |
0.057 |
0.23 |
3.00 |
|
C6 |
29.23 |
5.13 |
3.12 |
56.99 |
1.73 |
1.47 |
0.46 |
1.07 |
0.006 |
0.25 |
2.98 |
|
C7 |
27.14 |
5.73 |
3.08 |
58.04 |
1.68 |
1.52 |
0.48 |
0.66 |
0.010 |
0.23 |
2.60 |
|
C8 |
28.63 |
6.04 |
3.32 |
56.95 |
1.64 |
1.45 |
0.51 |
0.68 |
0.007 |
0.20 |
2.92 |
|
C9 |
28.65 |
5.98 |
3.34 |
57.73 |
1.67 |
1.52 |
0.49 |
0.67 |
0.006 |
0.13 |
2.95 |
|
C10 |
27.76 |
6.34 |
3.32 |
56.97 |
1.68 |
1.47 |
0.49 |
0.61 |
0.005 |
0.18 |
2.95 |
The results presented in Table 3 indicate that the incorporation of waste materials leads to an increase in silica (SiO2) and alumina (Al2O3) contents, accompanied by a reduction in lime (CaO) compared with the reference cement.
These variations directly reflect the chemical composition of the incorporated wastes and confirm their influence on the cement matrix, primarily through siliceous enrichment and a decrease in calcium content. The formulated cements exhibit free lime contents and loss on ignition (LOI) values that comply with the requirements of the EN 197-1:2011 [41] standard, indicating satisfactory chemical stability. The calculated hydraulic indices (Vicat index) reveal a balanced proportion between acidic and basic oxides, further confirming the chemical soundness of the developed formulations. The differences observed among the samples are mainly attributed to the nature of the added materials (brick, glass, and slag), which differently affect the proportions of the major oxides (SiO2, Al2O3, and CaO). Noted that the cement used in this study complies with the applicable standard requirements for alkali content.
3.1.2 Physical characterization
The experimental measurements of the densities of the prepared cements are presented in Figure 2. The results indicate that the composite cements exhibit lower densities compared to the reference cement. This behavior can be primarily attributed to the lower specific densities of the incorporated waste powders relative to that of the reference cement.
Figure 2. Densities of prepared cement powders
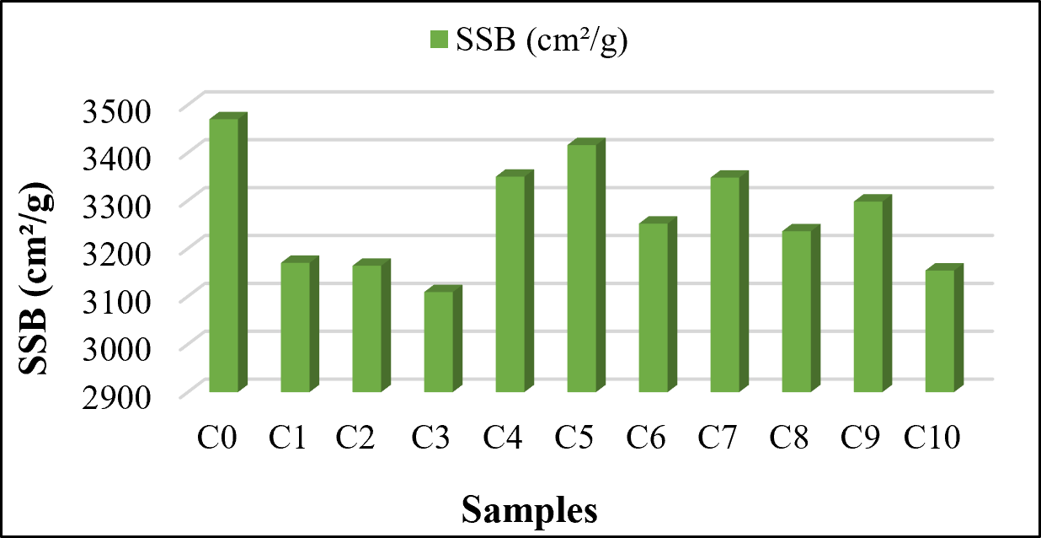
As shown in Figure 3, the observed variations in the measured SSB area are mainly related to the grinding procedure employed, as the constituents were ground separately. Indeed, the different waste materials exhibit distinct grindability characteristics, which directly influence the final fineness of the blended cements.
Figure 3. Specific surface Blaine (SSB) area of prepared cement powders
The normal consistency variations for the different cement formulations, as a function of the type and proportion of additives, are presented in Figure 4.
Figure 4. Normal consistency of the prepared cements
According to Figure 4, the water-to-cement ratio (W/C) required to achieve normal consistency increases from 25.00% to 27.00% depending on the formulation. Mixtures containing higher proportions of waste glass require less water, whereas those incorporating brick powder exhibit increased water demand due to its higher absorption capacity.
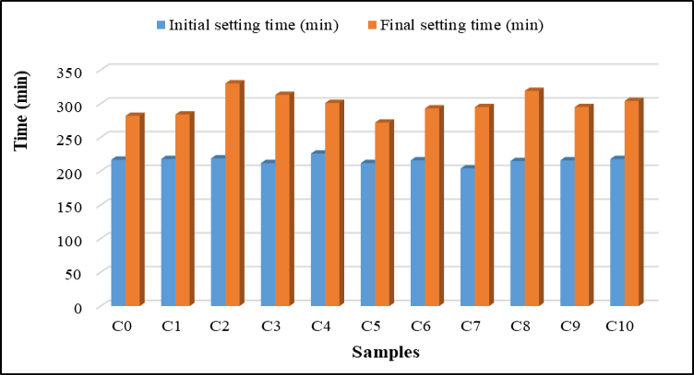
The initial and final setting times were determined on fresh cement pastes. The corresponding results are presented in Figure 5.
Figure 5. Setting time results of the prepared cements
As shown in Figure 5, most cement formulations exhibit comparable initial setting times, whereas noticeable differences are observed in the final setting times, which vary from one mixture to another. Samples C2, C3, and C8 display the longest final setting times. The time interval between initial and final setting ranges from 60 to 110 min. All cement formulations satisfied the requirements of EN 197-1:2011 [41], which specifies a minimum initial setting time of 75 min.
Overall, brick powder contributes more significantly to the acceleration of the setting process compared to glass powder and blast furnace slag, with average final setting times of approximately 272, 293, and 295 minutes, respectively.
3.2 Characterization of the prepared mortars
Following the characterization of the cement powder and paste, the experimental investigation was extended to mortar specimens in order to assess their fresh and hardened properties. The corresponding tests were carried out according to the relevant standards.
3.2.1 Physical characterization
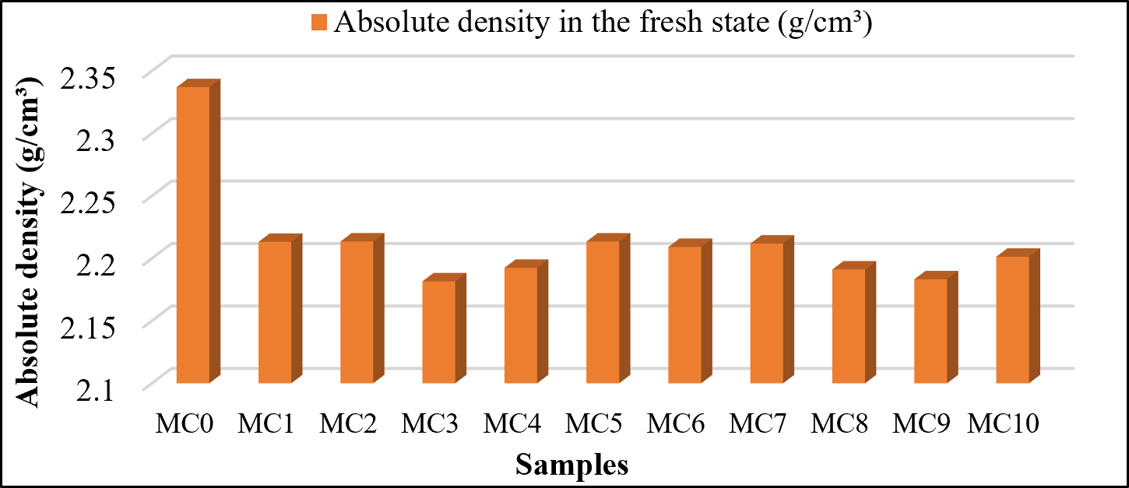
The absolute density of standardized mortar results is summarized in Figure 6.
As shown in Figure 6, the absolute densities of mortars produced with the newly developed cements are lower than those of the reference mortar. This behavior can be attributed to the lower specific densities of the incorporated waste materials compared with the reference CPA CEM I cement. These observations are consistent with the results obtained from the density measurements of the corresponding cement powders, confirming the influence of the additives on the overall material density.
Figure 6. Absolute densities of the prepared cement mortars
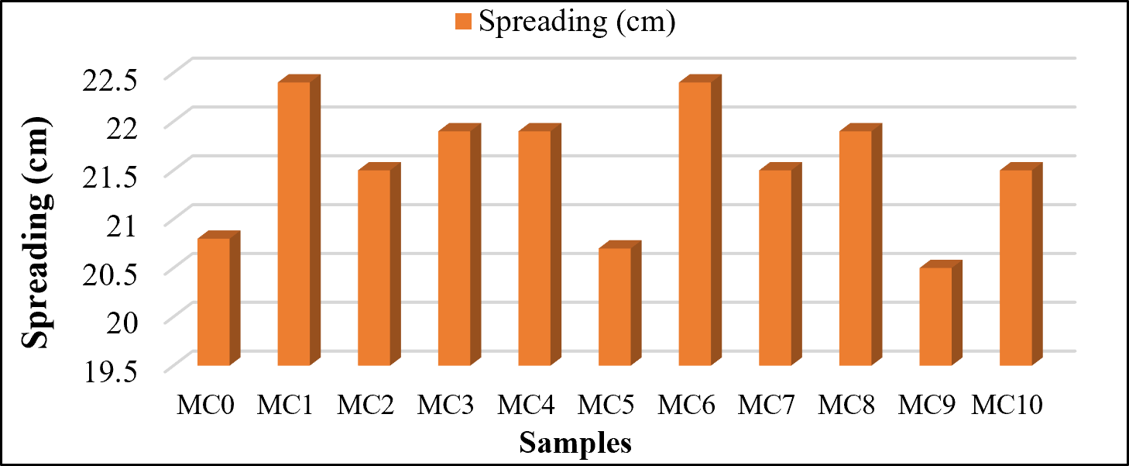
The workability results of standardized mortars prepared with the developed cement formulations are presented in Figure 7.
Figure 7. Flow test results of standardized mortars
As illustrated in Figure 7, the flow values of the prepared mortars exhibit some variability without a clear monotonic trend. To better assess the influence of the different additives on mortar workability, a comparison was performed between samples MC5, MC6, and MC7, containing 10% brick powder, 10% glass powder, and 10% blast furnace slag, respectively.
The results indicate that glass powder absorbs little to no mixing water, while blast furnace slag exhibits slightly lower water absorption than brick powder, which shows the highest water demand among the additives. According to the EN 1015-3:2006 standard [35], all prepared mortars can be classified as highly workable, as their flow diameters exceed 200 mm (D > 200 mm).
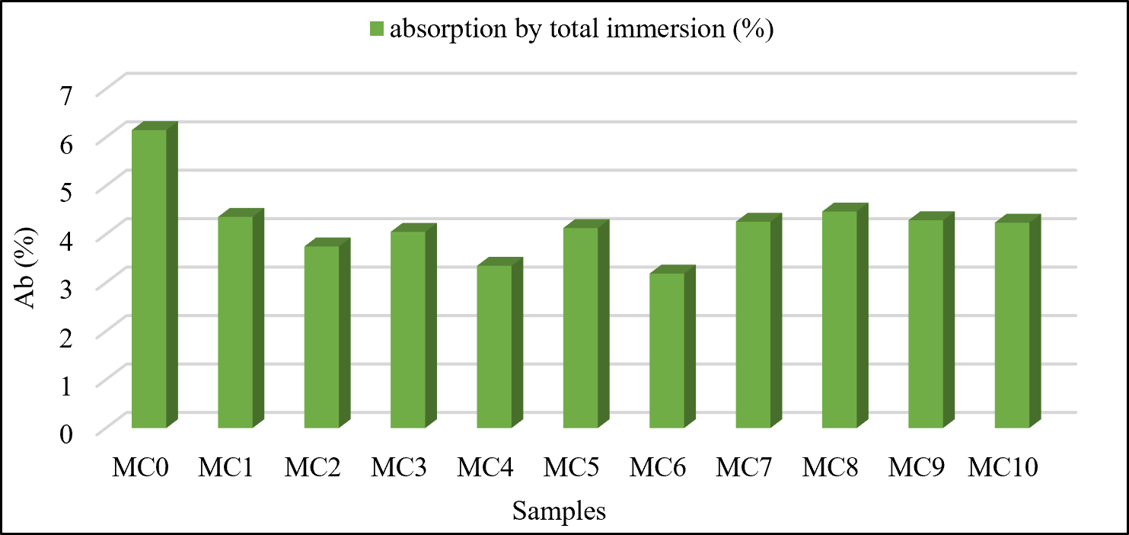
The results of the water absorption by total immersion of the mortars are presented in Figure 8.
Figure 8. Water absorption results by total immersion (28 days)
At 28 days of curing, all mortars prepared with the newly developed cements exhibited lower water absorption compared to the reference mortar. This result highlights the potential durability enhancement offered by the modified cements for use in concrete and construction applications. The observed improvement in compactness is mainly attributed to pore structure refinement, resulting from the pozzolanic reactions of the incorporated waste materials, which lead to the formation of additional cementitious phases.
Based on the measured values, the water absorption capacity of the different cement formulations follows the order:
CPA CEM I > slag-based cement > brick-based cement > glass-based cement.
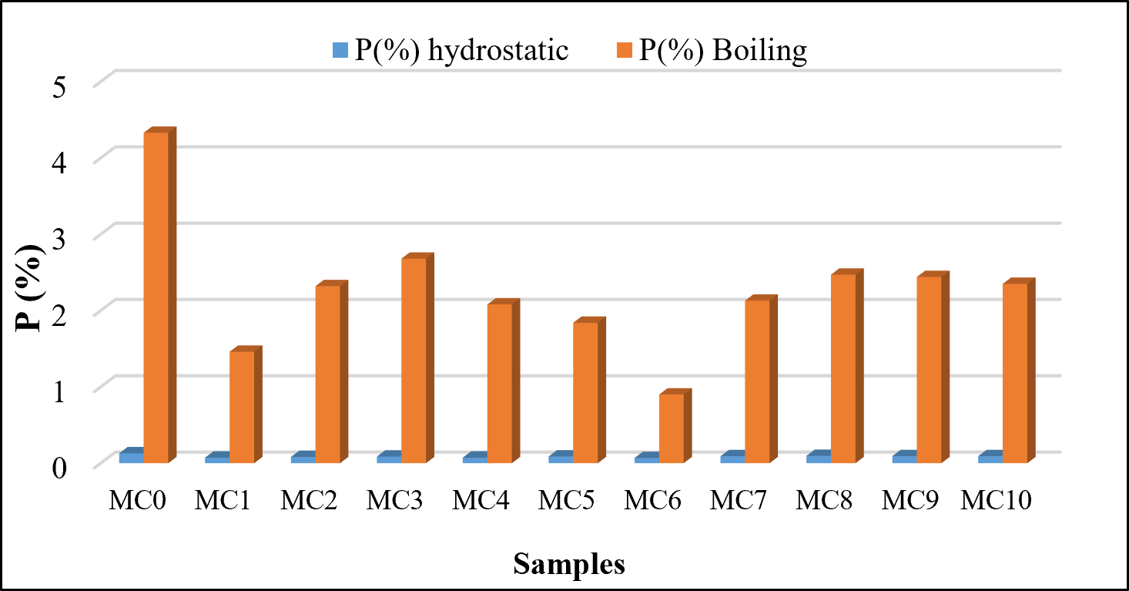
The water-accessible porosity of the mortars was determined using two complementary methods: (i) the hydrostatic weighing, following the procedure reported by Nigri et al. [37], and (ii) the boiling method, following ASTM C642-21:2021 [38].
The results of the water-accessible porosity measurements for standardized mortars containing different proportions of glass powder, brick powder, and blast furnace slag are summarized in Figure 9.
With regard to the water-accessible porosity determined using both the hydrostatic weighing and boiling methods, the results clearly indicate that the reference cement exhibits higher porosity than the mortars prepared with the newly developed cements. Among the blended cement formulations, those incorporating glass powder show the lowest porosity values compared with the other mixtures, highlighting the beneficial effect of glass addition on pore structure refinement.
Figure 9. Water-accessible porosity of the prepared cements
The porosity values obtained from the two measurement methods are consistent and in good agreement, confirming the reliability of the results.
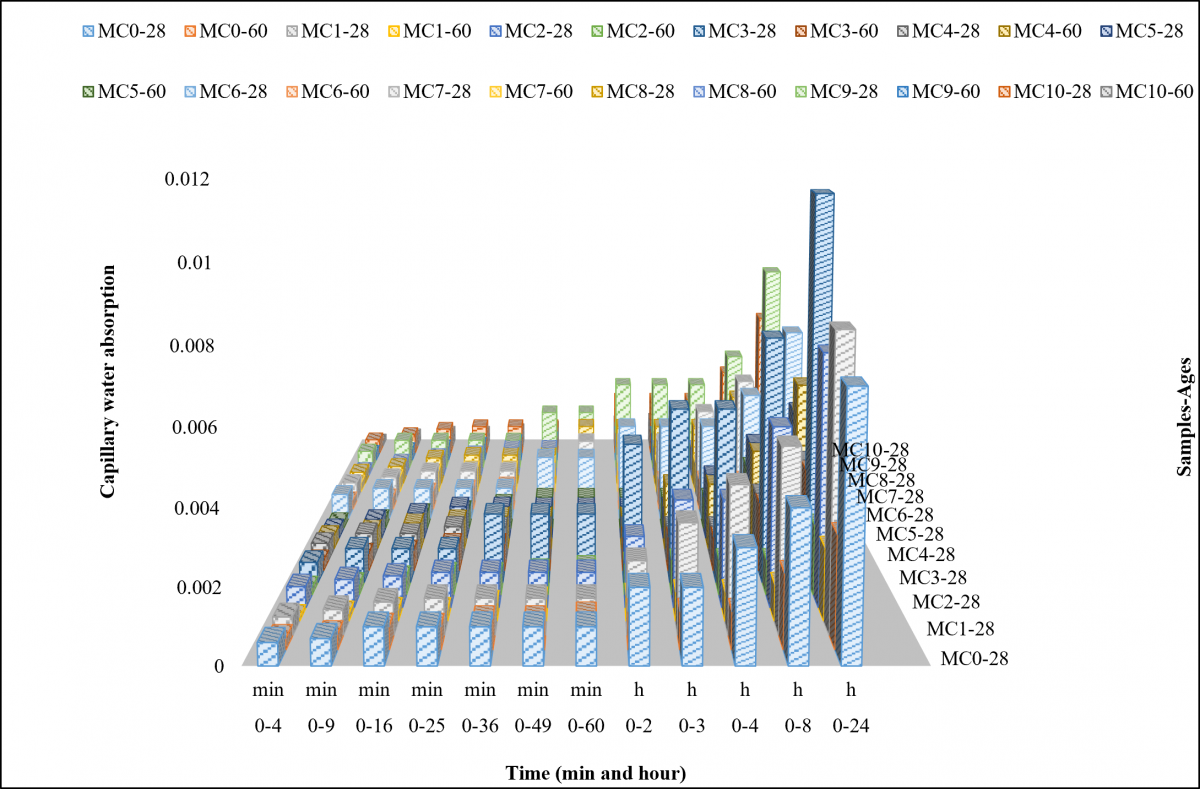
The capillary water absorption test was conducted after the specimens were cured in water for 28 days. To further assess the development of pozzolanic activity of the incorporated waste powders, the test was repeated after 60 days of curing. The corresponding results are presented in Figure 10.
Figure 10. Capillary water absorption of the prepared cement mortars after 28 and 60 days
According to Figure 10, the capillary water absorption measured at 60 days for all developed cement formulations is generally lower than the corresponding values recorded at 28 days. This behavior can be attributed to the continued hydration of the cement matrix over time, as well as to the progressive pozzolanic reactions of the incorporated waste materials, which promote pore refinement and the development of a denser microstructure.
3.2.2 Mechanical characterization
The results of the ultrasonic pulse velocity measurements performed on the mortar specimens at the age of 28 days are presented in Figure 11.
Figure 11. Ultrasonic pulse velocities of the prepared cement mortars
The ultrasonic pulse velocity varies among the different mortar samples; in general, higher velocities indicate better material quality and greater internal compactness. As shown in Figure 10, the measured ultrasonic pulse velocities range from 3686 m/s to 3970 m/s. According to the classification provided by the EN 12504-4:2021 [40] standard, these values fall within the range of good-quality mortars (3500–4500 m/s), confirming the satisfactory internal structure and compactness of the prepared mortars.
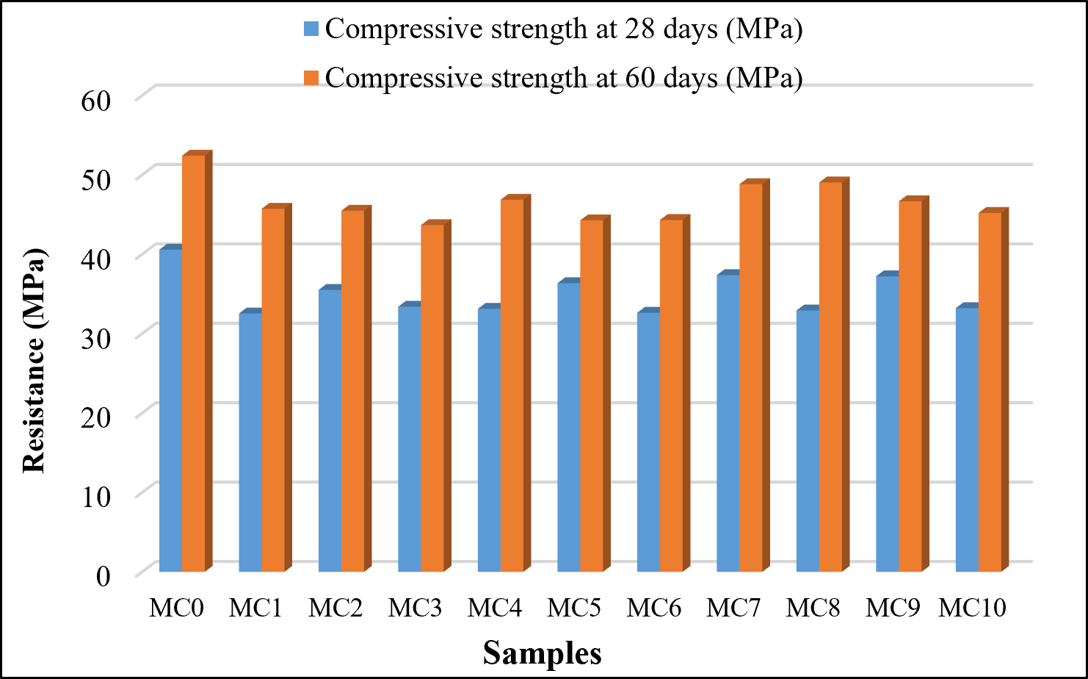
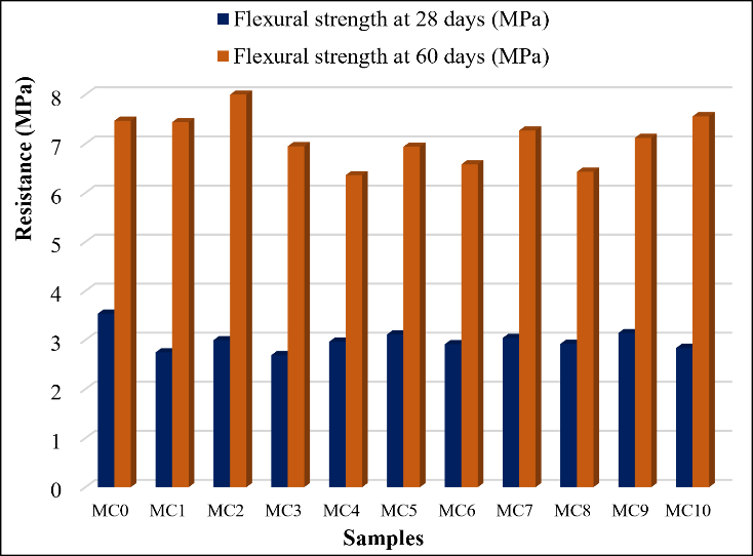
The mechanical characterization conducted in this study includes the determination of compressive strength and flexural tensile strength. The specimens were cured in water at laboratory temperature for 28 and 60 days prior to testing. The results of the compressive and flexural strength measurements are presented in Figures 12 and 13, respectively.
Figure 12. Compressive strength results at 28 and 60 days
Figure 13. Flexural strength results at 28 and 60 days
The objective of this test is to determine the strength class of the developed cements. At the age of 28 days, samples MC2, MC5, MC7, and MC9 exhibited very similar compressive strength values, with an average strength of approximately 36 MPa. In contrast, samples MC1, MC3, MC4, MC6, MC8, and MC10 showed lower average compressive strengths, around 33 MPa, indicating slightly reduced mechanical performance compared with the former group.
At 60 days, all cement formulations exhibited a noticeable increase in compressive strength, with an average strength gain of approximately 11 MPa between 28 and 60 days. Among the blended cement formulations, samples MC7 and MC8 achieved the highest compressive strength values, highlighting the beneficial contribution of the incorporated waste materials to long-term strength development.
Flexural strength showed trends similar to those observed for compressive strength. Overall, mortars prepared with the blended cements exhibited slightly lower flexural strength than the reference mortar at 60 days. However, the progressive strength gain over time can be attributed to the combined effects of pozzolanic reactions and the filler effect of the incorporated waste materials, both of which enhance microstructural refinement and matrix densification.
3.3 Statistical analysis
The statistical analysis of the experimental results is challenging due to the high dispersion of the measured values. In this context, RSM was adopted as a complementary approach to model and interpret the experimental data. This method allows the simultaneous evaluation of the effects of the investigated factors and their interactions, while accounting for potentially non-linear relationships. It is particularly well suited for the analysis of highly variable data and represents an effective tool for the optimization of operating conditions.
The objective of this study is to investigate the influence of variations in three input factors, slag content (%), brick content (%), and glass content (%) on five output parameters characterizing the physical and mechanical properties of the studied mortar, namely absolute density, flow spread, porosity, ultrasonic velocity, and compressive strength. Initially, the effects of these factors on the experimental responses were evaluated using ANOVA in order to identify the individual contribution of each parameter as well as their interactions. This step subsequently enabled the development of predictive mathematical models for each of the investigated responses. All analyses were performed using Design-Expert® software (version 13).
ANOVA was performed for all five responses to evaluate the influence of the three input factors on the behavior of the mortar. The corresponding results are presented in Tables 4 to 9. The coefficient of determination (R²) was used as an indicator of model goodness of fit; a value close to unity indicates that a large proportion of the experimental variability is explained, thereby reflecting the model’s ability to accurately predict the experimental results. According to the ANOVA results, when the probability value (p-value) is less than or equal to 0.05, the developed models are considered statistically significant and exhibit an acceptable level of accuracy [42]. In addition, a model is generally regarded as reliable when its coefficient of variation (CV) is below 15%.
The ANOVA results for absolute density, presented in Table 4, indicate that the overall model is statistically significant (F = 12.10, p = 0.0069), confirming a good agreement between the model and the experimental data. The linear mixture effect is significant (p = 0.0173), demonstrating that the overall composition strongly influences absolute density. Among the binary interactions, BC is the most influential (p = 0.0023), followed by AC (p = 0.0121), highlighting strong synergistic effects involving glass. In contrast, the AB interaction, the ternary interaction, and curvature terms are not significant, indicating the absence of pronounced non-linear effects. The non-significant lack of fit (p = 0.1212), together with a high R² (0.9509), a satisfactory adjusted R² (0.8723), a very low coefficient of variation (0.20%), and an adequate Adeq Precision (10.35), confirms the robustness and reliability of the model for predicting absolute density.
Table 4. Analysis of Variance (ANOVA) summary of absolute density results
|
Source |
Sum of Squares |
Df |
Mean Square |
F-value |
p-value |
|
|
Model |
1866.93 |
8 |
233.37 |
12.10 |
0.0069 |
Significant |
|
⁽¹⁾Linear Mixture |
392.24 |
2 |
196.12 |
10.17 |
0.0173 |
|
|
AB |
68.41 |
1 |
68.41 |
3.55 |
0.1184 |
|
|
AC |
284.67 |
1 |
284.67 |
14.76 |
0.0121 |
|
|
BC |
629.66 |
1 |
629.66 |
32.64 |
0.0023 |
|
|
ABC |
19.26 |
1 |
19.26 |
0.9981 |
0.3636 |
|
|
AB(A-B) |
47.42 |
1 |
47.42 |
2.46 |
0.1777 |
|
|
AC(A-C) |
41.70 |
1 |
41.70 |
2.16 |
0.2015 |
|
|
Residual |
96.46 |
5 |
19.29 |
|||
|
Lack of Fit |
47.32 |
1 |
47.32 |
3.85 |
0.1212 |
|
|
Pure Error |
49.15 |
4 |
12.29 |
|||
|
Cor Total |
1963.39 |
13 |
The ANOVA results presented in Table 5 for flow spread indicate that the overall model is highly significant (F = 27.51, p = 0.0010), demonstrating a robust statistical explanation of the variability of this response. The linear mixture effect is significant (p = 0.0067), confirming the influence of the overall composition on flow spread. Among the interaction terms, the AB interaction is the most influential (F = 98.48, p ≈ 0.0002), revealing a strong synergistic effect between slag and brick, whereas the AC and BC interactions are not significant. In contrast, the ternary interaction ABC (p = 0.0023) and the quadratic terms AB(A–B) and AC(A–C) (p < 0.05) are significant, indicating pronounced non-linear effects. The high coefficient of determination (R² = 0.9778; adjusted R² = 0.9423), together with a low standard deviation and coefficient of variation (CV = 0.74%), confirms the excellent internal fit of the model, while the high Adeq Precision (13.30) indicates an adequate signal-to-noise ratio. However, the significant lack of fit (p = 0.0175) suggests that flow spread is highly sensitive to small variations in mixture proportions, which limits the predictive capability of the model despite its strong descriptive performance.
Table 5. Analysis of Variance (ANOVA) summary of flow results
|
Source |
Sum of Squares |
df |
Mean Square |
|
F-value |
p-value |
|
|
Model |
5.55 |
8 |
0.6941 |
|
27.51 |
0.0010 |
Significant |
|
⁽¹⁾Linear Mixture |
0.8069 |
2 |
0.4035 |
|
15.99 |
0.0067 |
|
|
AB |
2.48 |
1 |
2.48 |
|
98.48 |
0.0002 |
|
|
AC |
0.0024 |
1 |
0.0024 |
|
0.0934 |
0.7722 |
|
|
BC |
0.0259 |
1 |
0.0259 |
|
1.03 |
0.3577 |
|
|
ABC |
0.8252 |
1 |
0.8252 |
|
32.71 |
0.0023 |
|
|
AB(A-B) |
0.8888 |
1 |
0.8888 |
|
35.23 |
0.0019 |
|
|
AC(A-C) |
1.26 |
1 |
1.26 |
|
49.83 |
0 .0009 |
|
|
Residual |
0.1261 |
5 |
0.0252 |
|
|||
|
Lack of Fit |
0.0999 |
1 |
0.0999 |
|
15.22 |
0.0175 |
Significant |
|
Pure Error |
0.0262 |
4 |
0.0066 |
|
|||
|
Cor Total |
5.68 |
13 |
|
Table 6 presents the ANOVA results for porosity; they indicate that the overall model is statistically significant (F = 20.73, p = 0.0020), confirming a good agreement between the model and the experimental data. The linear mixture effect is significant (p = 0.0143), demonstrating that mixture composition strongly influences pore structure. Among the binary interactions, BC is the most dominant factor (F = 60.64, p = 0.0006), while AB and AC also exhibit significant effects. In contrast, the ternary interaction and curvature terms are not significant, indicating the absence of pronounced higher-order or non-linear effects. The high coefficient of determination (R² = 0.9707; adjusted R² = 0.9239), together with a low coefficient of variation (CV = 8.06%) and a high Adeq Precision value (14.58), confirms the robustness of the model and its suitability for exploring the formulation space with respect to porosity.
Table 6. Analysis of Variance (ANOVA) summary of porosity results
|
Source |
Sum of Squares |
Df |
Mean Square |
F-value |
p-value |
|
|
Model |
4.00 |
8 |
0.5005 |
20.73 |
0.0020 |
Significant |
|
⁽¹⁾Linear Mixture |
0.5387 |
2 |
0.2694 |
11.16 |
0.0143 |
|
|
AB |
0.3511 |
1 |
0.3511 |
14.54 |
0.0125 |
|
|
AC |
0.2924 |
1 |
0.2924 |
12.11 |
0.0177 |
|
|
BC |
1.46 |
1 |
1.46 |
60.64 |
0.0006 |
|
|
ABC |
0.0694 |
1 |
0.0694 |
2.87 |
0.1508 |
|
|
AB(A-B) |
0.0001 |
1 |
0.0001 |
0.0028 |
0.9596 |
|
|
AC(A-C) |
0.0050 |
1 |
0.0050 |
0.2061 |
0.6688 |
|
|
Residual |
0.1207 |
5 |
0.0241 |
|||
|
Lack of Fit |
0.1207 |
1 |
0.1207 |
|||
|
Pure Error |
0.0000 |
4 |
0.0000 |
|||
|
Cor Total |
4.2 |
13 |
The ANOVA results for ultrasonic velocity (Table 7) indicate that the overall model is highly significant (F = 312.51, p < 0.0001), demonstrating an excellent agreement with the experimental data. The linear mixture effect is significant (p = 0.0022), while the binary interactions AB and BC show extremely strong effects (p < 0.0001), with AB being the most influential term (F = 1227.62). The AC interaction is also significant, although with a more moderate contribution. In addition, the ternary interaction ABC and the curvature terms AB(A–B) and AC(A–C) are highly significant, indicating pronounced non-linear and synergistic effects. The non-significant lack of fit (p = 0.4414), together with very high R² (0.9980), adjusted R² (0.9948), and predicted R² (0.9565), confirms an outstanding explanatory and predictive performance. The very low coefficient of variation (CV = 0.20%) and the high Adeq Precision (45.97) further attest to the robustness and reliability of the model for predicting ultrasonic velocity.
Table 7. Summary of Analysis of Variance (ANOVA) results for ultrasonic velocity
|
Source |
Sum of Squares |
Df |
Mean Square |
F-Value |
p-Value |
|
|
Model |
1.445E+05 |
8 |
18065.81 |
312.51 |
< 0.0001 |
Significant |
|
⁽¹⁾Linear Mixture |
3025.56 |
2 |
1512.78 |
26.17 |
0.0022 |
|
|
AB |
70967.13 |
1 |
70967.13 |
1227.62 |
< 0.0001 |
|
|
AC |
972.39 |
1 |
972.39 |
16.82 |
0.0093 |
|
|
BC |
31342.13 |
1 |
31342.13 |
542.17 |
< 0.0001 |
|
|
ABC |
39724.88 |
1 |
39724.88 |
687.18 |
< 0.0001 |
|
|
AB(A-B) |
6543.29 |
1 |
6543.29 |
113.19 |
0.0001 |
|
|
AC(A-C) |
12087.92 |
1 |
12087.92 |
209.10 |
< 0.0001 |
|
|
Residual |
289.04 |
5 |
57.81 |
|||
|
Lack of Fit |
44.54 |
1 |
44.54 |
0.7287 |
0.4414 |
|
|
Pure Error |
244.50 |
4 |
61.13 |
|||
|
Cor Total |
1 .448E+05 |
13 |
The ANOVA results for the compressive strength model, presented in Table 8, demonstrate that the proposed reduced quartic mixture model is highly significant (F = 344.92, p < 0.0001), confirming its excellent ability to describe the experimental data. The linear mixture effect is highly significant (p < 0.0001), indicating that compressive strength is strongly influenced by the overall proportions of slag, brick powder, and glass powder. Furthermore, all interaction and higher-order mixture terms, including AB, AC, BC, ABC, AB(A–B), AC(A–C), and AB(A–B)², are statistically significant (p ≤ 0.0002), highlighting the presence of strong synergistic and nonlinear interactions among the three supplementary cementitious materials.
Table 8. Summary of Analysis of Variance (ANOVA) results for compressive strength
|
Source |
Sum of Squares |
df |
Mean Square |
F-Value |
p-Value |
|
|
Model |
49.72 |
9 |
5.52 |
344.92 |
< 0.0001 |
Significant |
|
Linear Mixture |
23.41 |
2 |
11.71 |
730.90 |
< 0.0001 |
|
|
AB |
4.05 |
1 |
4.05 |
253.11 |
< 0.0001 |
|
|
AC |
2.89 |
1 |
2.89 |
180.66 |
0.0002 |
|
|
BC |
4.80 |
1 |
4.80 |
299.42 |
< 0.0001 |
|
|
ABC |
3.36 |
1 |
3.36 |
209.55 |
< 0.0001 |
|
|
AB(A-B) |
16.24 |
1 |
16.24 |
1014.19 |
< 0.0001 |
|
|
AC(A-C) |
2.72 |
1 |
2.72 |
169.92 |
0.0002 |
|
|
AB(A-B)2 |
4.45 |
1 |
4.45 |
277.52 |
< 0.0001 |
|
|
Pure Error |
0.0641 |
4 |
0.0160 |
|||
|
Cor Total |
49.78 |
13 |
The model exhibits excellent statistical performance, with a coefficient of determination (R² = 0.9987) and an adjusted coefficient of determination (Adjusted R² = 0.9958), indicating that more than 99% of the experimental variability is explained by the model. In addition, the very low coefficient of variation (CV = 0.2766%) demonstrates excellent experimental precision, while the Adeq Precision value of 58.56, far exceeding the recommended minimum value of 4, confirms an excellent signal-to-noise ratio and the suitability of the model for navigating the design space.
3.3.1 Response surface methodology modeling
RSM is a statistical modeling approach widely used to establish mathematical relationships between input variables and response variables. It allows not only the representation of these relationships through analytical functions, but also the evaluation of the individual effects of each independent factor as well as their interactions. The primary objective of this method is to optimize the experimental responses by identifying the most influential combinations of factors.
The general mathematical function describing the RSM model can be expressed as follows:
$Y=a_0+\sum_{i=1}^n a_i \cdot x_i+\sum_{i=1}^n a_i b_j \cdot x_i x_j+\sum_{i=1}^n b_i \cdot x_i^2$ (1)
where, $x_i$ represents the input variables, n corresponds to the total number of these variables, $a_0$ is the model constant, $a_i$, $b_i$ and $a_i b_j$ are the model coefficients representing the linear, quadratic, and interaction effects between the factors, respectively.
The regression analysis applied to the experimental results led to the development of statistical models describing the effect of the input variables namely slag content, brick content, and glass content on the measured responses: absolute density, flow spread, porosity, ultrasonic velocity, and compressive strength.
The resulting equations, which describe these relationships and allow the evaluation of the relative influence of each factor as well as their interactions, are summarized as follows:
Absolute density $=6.470 \times A+204.290 \times B+220.350 \times C-0.1652 \times A B-3.994 \times A C-18.202 \times B C+1.068 \times A B C+0.870 \times A B \times(A-B)+0.8068 \times A C \times(A-C)$. (2)
Flow spread $=-5.481 \times A-13.091 \times B+7.741 \times C+2.025 \times A B+0.5188 \times A C+1.030 \times B C-0.2212 \times A B C-0.1192 \times A B \times(A-B)+0.1400 \times A C \times(A-C)$. (3)
Porosity $=2.184 \times A+1.026 \times B-0.7925 \times C-0.4469 \times A B-0.2193 \times A C-0.0665 \times B C+0.0641 \times A B C+0.0010 \times A B \times(A-B)-0.0088 \times A C \times(A-C)$ (4)
Ultrasonic velocity $=2989.276 \times A+612.379 \times B+107.798 \times C-348.321 \times A B-288.359 \times A C-154.439 \times B C+48.551 \times A B C-10.231 \times A B \times(A-B)-13.736 \times A C \times(A-C)$ (5)
Compressive strength $=-163.33 \times A-234.35 \times B+18.840 \times C+40.94 \times A B+16.034 \times A C+20.638 \times B C-2.118 \times A B C-0.680 \times A B \times(A-B)+4.442 \times A C \times(A-C)+0.142 \times A B \times(A-B) 2$ (6)
3.3.2 Graphical validation of the models
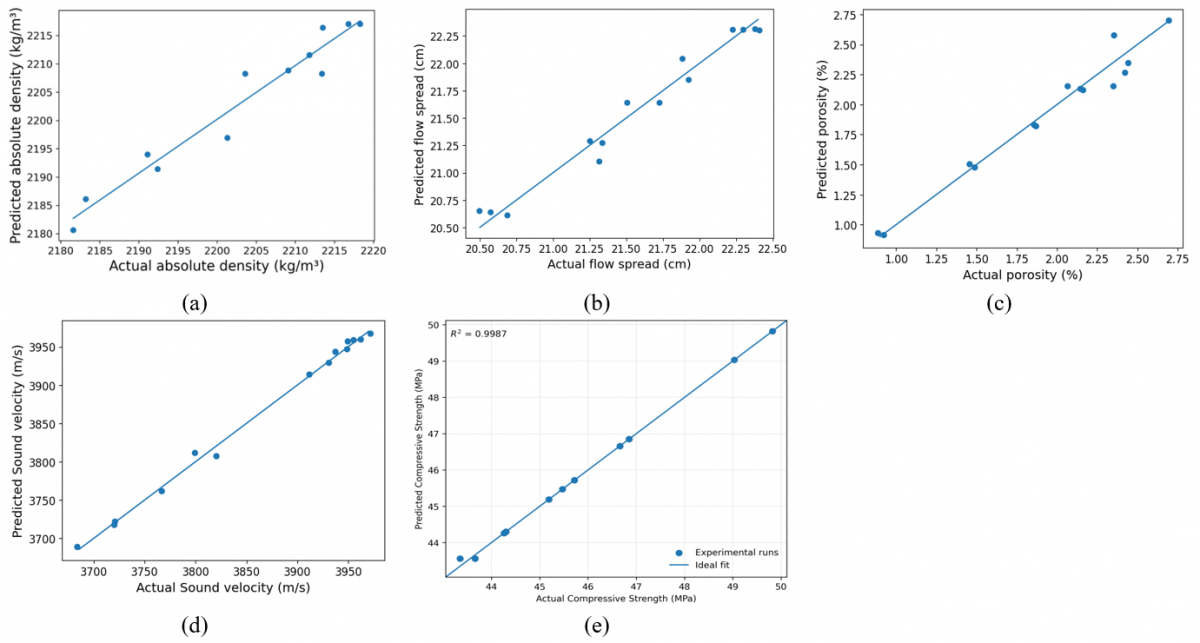
Figure 14 presents the parity plots comparing experimental and model-predicted values for all investigated responses. The data points are generally well distributed along the line of equality, indicating a good agreement between experimental measurements and model predictions. No systematic deviation is observed, suggesting an adequate model structure and reliable estimation of the response variables.
Figure 14. Analysis of model responses ((a) absolute density, (b) flow spread, (c) porosity, (d) ultrasonic pulse velocity, (e) compressive strength) through a comparison between predicted and experimental values
Slight deviations observed for certain responses can be attributed to inherent experimental variability and the complexity of the associated mechanisms, without significantly affecting the overall quality of the fit. Overall, the models exhibit excellent predictive performance for porosity and ultrasonic velocity, good agreement for absolute density and flow spread, and a more moderate accuracy for compressive strength. These results confirm the suitability of the developed models for describing and interpreting the experimental behavior within the investigated design space.
3.3.3 3D surface plots
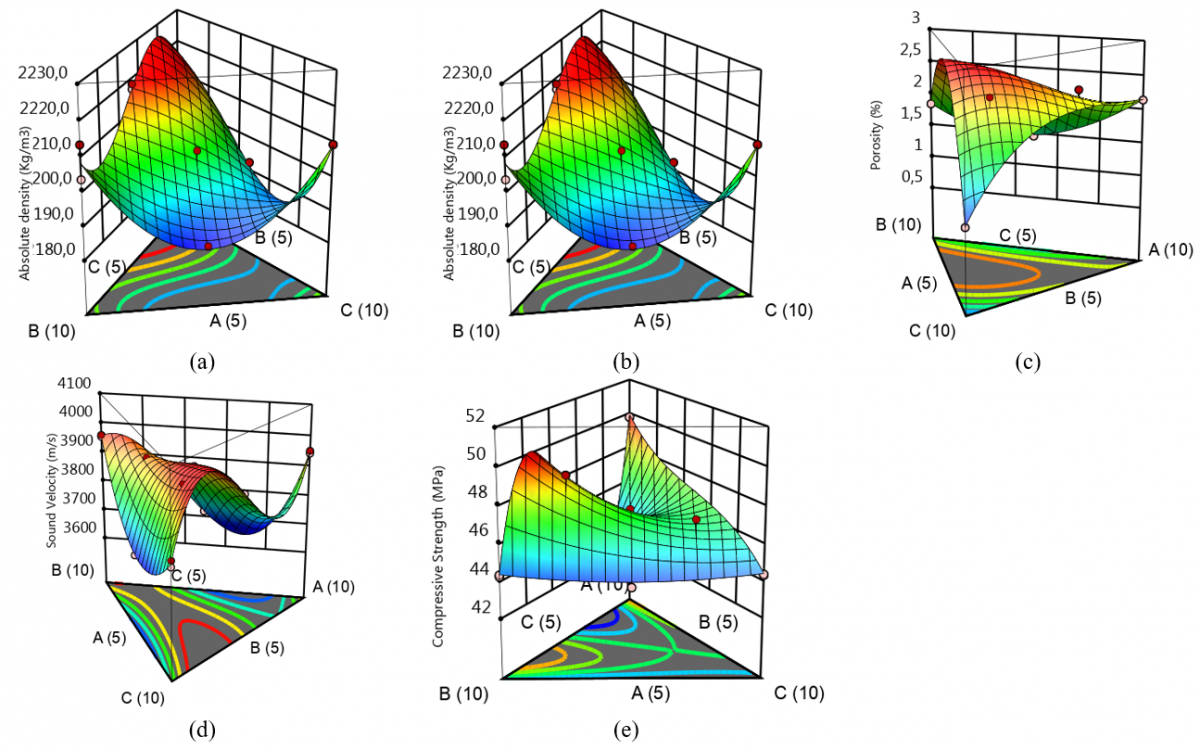
The response surface for absolute density (Figure 15(a)) is consistent with the ANOVA results, with a significant model (p = 0.0069) and a non-significant lack of fit, confirming the reliability of the predictions. The response is mainly controlled by the linear mixture effect, with a dominant contribution of the BC interaction, explaining the pronounced variations observed when glass is combined with slag or brick. The flow spread response (Figure 15(b)) exhibits a strongly non-linear behavior, in agreement with the highly significant model (p = 0.0010). The dominant AB interaction governs the main variations, while the significance of the ABC interaction and quadratic terms confirms the presence of pronounced non-linear effects.
The response surface for porosity presented in Figure 15(c) highlights a clear dependence on mixture composition, primarily driven by binary interactions, particularly BC, identified as the most influential factor. The absence of significant curvature terms indicates a relatively regular evolution of porosity within the studied domain.
For ultrasonic velocity (Figure 15(d)), the highly structured surface reflects strong interactive effects among the three constituents.
Figure 15. 3D surface plots of the different responses ((a) absolute density, (b) flow spread, (c) porosity, (d) ultrasonic pulse velocity and, (e) compressive strength)
The dominant AB and BC interactions, together with significant ternary and quadratic terms, indicate pronounced non-linear behavior and a strong link with microstructural characteristics.
Finally, the compressive strength surface plotted in Figure 15(e) shows a gradual variation with mixture composition.
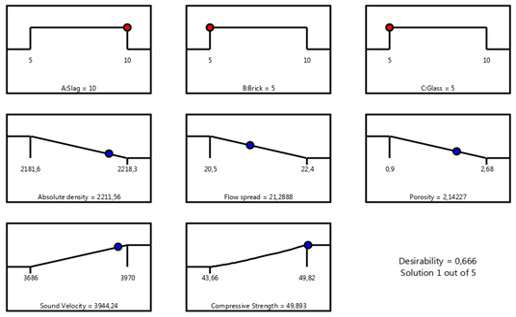
The response is mainly governed by the linear mixture effect, while the significance of the AB(A–B) term suggests a localized non-linear behavior. Overall, the model captures the general trends, despite a more limited predictive accuracy for this response. Multi-objective response optimization is used to identify the combination of input parameters that simultaneously satisfies several performance criteria [43]. In this study, the desirability function (DF) approach, originally proposed by Derringer and Suich [44], was adopted due to its effectiveness in handling both single- and multi-objective optimization problems. This method transforms each response into an individual desirability function scaled between 0 and 1, after which a global desirability value is calculated using a gradient-based algorithm, as described in the study [45]. The optimization procedure aimed to determine the optimal levels of the input factors slag content, brick content, and glass content, each constrained within the range of 5–10% in order to minimize absolute density, flow spread, and porosity, while simultaneously maximizing ultrasonic velocity and compressive strength. Equal weights were assigned to all responses, whereas a higher importance level was attributed to compressive strength to reflect its critical role in mechanical performance. The optimization goals, constraints, and importance levels used in the desirability analysis are summarized in Table 9.
Table 9. Goals and range variation of the optimization parameters
|
Name |
Goal |
Lower Limit |
Upper Limit |
Importance |
|
A: Slag |
is in range |
5 |
10 |
3 |
|
B: Brick |
is in range |
5 |
10 |
3 |
|
C: Glass |
is in range |
5 |
10 |
3 |
|
Absolute density |
Minimize |
2181.6 |
2218.3 |
3 |
|
Flow spread |
Minimize |
20.5 |
22.4 |
3 |
|
Porosity |
Minimize |
0.9 |
2.68 |
3 |
|
ultrasonic pulse velocity |
Maximize |
3686 |
3970 |
3 |
|
Compressive Strength |
Maximize |
43.66 |
49.82 |
5 |
Based on the results presented in Figure 16, the multi-objective optimization process successfully identified several feasible solutions that balance the competing objectives of minimizing absolute density, flow spread, and porosity, while maximizing ultrasonic velocity and compressive strength. Among the proposed solutions, Solution 1 exhibits the highest global desirability value (0.67) and was therefore selected as the optimal formulation. The optimal mixture corresponds to 10% slag, 5% brick, and 5% glass, which satisfies the imposed constraints on the input factors. This formulation achieves a favorable compromise between the targeted responses, characterized by a relatively low absolute density (2211.56 g/cm³), moderate flow spread (21.29 cm), and controlled porosity (2.14%), while simultaneously providing high ultrasonic velocity (3944.24 m/s) and the maximum compressive strength (49.89 MPa) among all candidate solutions. The high desirability value reflects the ability of this formulation to meet the optimization objectives, with particular emphasis on compressive strength, which was assigned the highest importance during the optimization process.
Figure 16. Optimization results using desirability function
This study demonstrates the technical feasibility and environmental relevance of producing composite CPJ CEM II/A cements through the partial substitution of cement with finely ground brick waste, blast furnace slag, and waste glass.
A substitution rate of 20% cement replacement was successfully implemented without compromising compliance with current standards.
The experimental results showed that the incorporation of these waste materials significantly influences the physical, rheological, and mechanical behavior of the developed cements. Blended cements exhibited lower bulk and apparent densities compared to the reference cement, which may be advantageous for reducing the self-weight of concrete elements. In terms of fresh-state behavior, the initial setting times remained comparable to the reference, while final setting times varied depending on the dominant additive, with brick powder accelerating the setting process due to its higher water absorption capacity.
Durability-related properties were notably improved. Mortars prepared with the blended cements showed reduced water absorption and lower accessible porosity, particularly for formulations containing glass powder, indicating a denser microstructure. Ultrasonic pulse velocity measurements classified all mortars as good-quality materials, confirming satisfactory internal compactness.
From a mechanical standpoint, compressive and flexural strengths developed progressively with curing time. Although early-age strength gains were limited, significant improvements were observed at 60 days, attributed to the delayed pozzolanic reactions of the waste materials and the formation of secondary C–S–H phases. All developed cements satisfied the requirements of EN 197-1:2011 for strength class 32.5.
The statistical modeling based on ANOVA and RSM provided valuable insight into the individual and interactive effects of slag, brick, and glass contents on key performance indicators. The optimization process identified an optimal formulation consisting of 80% cement, 5% brick powder, 10% slag, and 5% glass powder, achieving a balanced compromise between mechanical performance, durability, and fresh-state properties.
[1] Subramanian, R., Vijayaprakash, S., Subramaniyan, Y., Venkatraman, Y. (2025). A study on the strength and durability of cement mortar featuring partial brick powder replacement: Economic and sustainability implications. Revista Matéria, 30: e20240792. https://doi.org/10.1590/1517-7076-RMAT-2024-0792
[2] Chand, G., Achintha, M., Wang, Y. (2025). Challenges and opportunities in using high percentage waste glass powder as cement replacement in concrete. Materials Circular Economy, 7: 19. https://doi.org/10.1007/s42824-025-00173-w
[3] Semmana, O., Rihan, M.A.M., Barrie, Z.M., Daniel, C., Abdalla, T.A. (2025). A systematic review of the strength, durability, and microstructure properties of concrete incorporating glass powder. Engineering Reports, 7(1): e70002. https://doi.org/10.1002/eng2.70002
[4] Lliso-Ferrando, J.R., Arenós-Barrachina, A., Monzón-Bello, P., Valcuende, M. (2025). Durability of mortars with partial cement replacement by recycled brick powder. Applied Sciences, 15(8): 4133. https://doi.org/10.3390/app15084133
[5] Qader, D.N., Merie, H.D., Abdulhaleem, K.N. (2025). Structural performance and mechanical characteristics of concrete incorporating waste glass powder as a partial cement replacement. In 5th International Conference on Architectural & Civil Engineering Sciences (CIC-ICACE 2025), pp. 215-223. https://doi.org/10.24086/icace2025/paper.1600
[6] Kumar, B.N., Sunil, B.S., Bhat, P.K. (2025). Exploring the synergistic effects of quartz powder and GGBS in sustainable standard strength concrete: insights from carbonation and electrochemical impedance spectroscopy (EIS). Discover Materials, 5: 147. https://doi.org/10.1007/s43939-025-00346-z
[7] Tan, H., Ji, H., Yuan, P., Fan, X. (2025). Effects of steel slag, desulfurization gypsum, and ground granulated blast-furnace slag on the characterization of recycled cement-stabilized macadam. Materials, 18(4): 874. https://doi.org/10.3390/ma18040874
[8] Konin, A., Serifou, M.A., Gboga, O.J.B.N., Emeruwa, E. (2025). Impact of glass powder and aggregates on concrete. International Journal of Materials Engineering and Technology, 24(1): 21-43. https://doi.org/10.17654/0975044425002
[9] Zhu, C., Gong, Y., Fang, Y. (2018). Effect of slag powder on strength development of alkali-activated recycled cement. In IOP Conference Series: Materials Science and Engineering, Suzhou, China, 397: 012015. https://doi.org/10.1088/1757-899X/397/1/012015
[10] Handel, N., Aidoud, A., Bencheikh, M., Hafsi, H., et al. (2025). Microstructural characterization and multi-objective optimization of concrete containing recycled gravel and crystallized slag: A Box-Behnken design methodology. Iranian Journal of Science and Technology, Transactions of Civil Engineering, 49: 4521-4545. https://doi.org/10.1007/s40996-024-01718-w
[11] Kryzhanovskyi, V., Orlowsky, J., Skocek, J., Macias Barrientos, M. (2025). Utilization of brick powder in blended cement compositions: Rheological, mechanical, and microstructural properties. Materials, 18(22): 5120. https://doi.org/10.3390/ma18225120
[12] Yildirim, M., Uysal, M. (2025). Effect of calcination degree and replacement ratio of waste brick powder on compressive strength of cementitious mortars. In 8th International Bursa Scientific Research Congress, Bursa, Türkiye, pp. 1-10.
[13] Ramanamurthy, B.V., Himabindu, N. (2020). Performance of cement mortar and concrete with partial replacement of cement with clay brick powder- an experimental approach. International Journal of Engineering Applied Sciences and Technology, 5(2): 385-389.
[14] Sinkhonde, D., Onchiri, R., Oyawa, W., Mwero, J. (2021). Effect of waste clay brick powder on physical and mechanical properties of cement paste. Open Civil Engineering Journal, 15(1): 370-380. https://doi.org/10.2174/1874149502115010370
[15] Brixi, A., Ghembaza, M.S., Boudenne, A. (2024). Hydrothermal and mechanical performance of mortars containing waste brick powder. Acta Polytechnica, 64(4): 322-335. https://doi.org/10.14311/AP.2024.64.0322
[16] Alfeluo, J., Aziz, A., Aljfairi, K., Aldeeb, S., Aldubouss, A., Ikrieam, A. (2025). Improving the chemical properties of Libyan cement by waste glass incorporation. Alq Journal of Medical and Applied Sciences, 8(2): 1180-1189. https://doi.org/10.54361/ajmas.258298
[17] Yannick, T.L., Alim, B., Ali, M.A., et al. (2025). Characterization and strength prediction of a Belite cement matrix incorporating micro glass powder. Discover Civil Engineering, 2: 132. https://doi.org/10.1007/s44290-025-00292-y
[18] Ye, S., Cai, X., Zhao, Z., Zhang, J., Liang, J., Guo, Q., Yang, L. (2026). The influence of ultrafine waste glass powder on the properties of oil well cement-based composite materials. Materials Research Express, 13: 015201. https://doi.org/10.1088/2053-1591/ae2fae
[19] Khan, S., Mehairi, A.G., Ghasemalizadeh, S., Khoshnazar, R. (2026). Comparative study of mechanical performance and durability of concrete incorporating supplementary cementitious materials. Canadian Journal of Civil Engineering, 53: 1-13. https://doi.org/10.1139/cjce-2025-0184
[20] Sharma, Y., Yeluri, M., Allena, S., Owusu-Danquah, J., et al. (2024). Incorporating limestone powder and ground granulated blast furnace slag in ultra-high performance concrete to enhance sustainability. International Journal of Concrete Structures and Materials, 18: 79. https://doi.org/10.1186/s40069-024-00723-7
[21] Pagar, J.B., Kasliwal, S.S. (2025). Experimental study on partial replacement of cement with dolomite powder and brick kiln dust. International Journal on Science and Technology, 16(4). https://doi.org/10.71097/IJSAT.v16.i4.9051
[22] Assia, A., Messaouda, B., Salima, B., Ouassila, B., Zitouni, W.Q.E. (2025). Enhancement of the mechanical characteristics of a green mortar under extreme conditions: experimental study and optimization analysis. Iranian Journal of Science and Technology, Transactions of Civil Engineering, 49: 2575-2599. https://doi.org/10.1007/s40996-024-01612-5
[23] Zerig, T., Belachia, M., Aidoud, A., Meftah, N., Djedid, T., Abbas, M. (2024). Statistical analysis using the RSM approach of the physical behavior of green polymerized eco-mortar. Journal of Cleaner Production, 450: 141858. https://doi.org/10.1016/j.jclepro.2024.141858
[24] Zerig, T., Aidoud, A., Belachia, M., Djedid, T., Abbas, M. (2023). Combined sand eco-mortar reinforced with polyethylene terephthalate: Behavior and optimization using RSM method. Construction and Building Materials, 404: 133160. https://doi.org/10.1016/j.conbuildmat.2023.133160
[25] Donderiya, K.M., Shrivastava, H., Shukla, A., Gupta, A. (2025). Multi-objective optimization and experimental evaluation of fly ash and Kota stone powder as sustainable cement replacements in M30 grade concrete. Asian Journal of Civil Engineering, 27: 1033-1048. https://doi.org/10.1007/s42107-025-01547-w
[26] Laidani, Z.E.A., Sahraoui, M., Ouldkhaoua, Y., Benabed, B., Belgacem, M.E.G. (2025). Predictive analysis of brick powder-enhanced self-compacting mortar using artificial neural networks. Vojnotehnički Glasnik, 73(3): 993-1016. https://doi.org/10.5937/vojtehg73-55812
[27] Adanu, O.J., Olubunmi, A., Olu, O.O. (2024). Application of response surface methodology for mortar compressive strength containing glass powder and eggshell powder. Journal of Multidisciplinary Research Advancements (JOMRA), 2(2): 105-113. https://doi.org/10.3126/jomra.v2i2.73070
[28] Bouzeroura-Mansour, G., Djafri, L., Bennacer, C., Chelouah, N., Ghosh, S.K. (2025). Valorisation assessment of industrial waste in the production of Portland cement by developing predictive models using the response surface method. The Journal of Solid Waste Technology and Management, 51(3): 405-420. https://doi.org/10.5276/jswtm/iswmaw/513/2025.405
[29] Dahish, H.A., Alkharisi, M.K., Abouelnour, M.A., Fathy, I.N., Sadawy, M.A., Mahmoud, A.A. (2025). Predicting the compressive strength of waste powder concrete using response surface methodology and neural network algorithm. Buildings, 15: 3934. https://doi.org/10.3390/buildings15213934
[30] Shi, C., Zheng, K. (2007). A review on the use of waste glasses in the production of cement and concrete. Resources, Conservation and Recycling, 52(2): 234-247. https://doi.org/10.1016/j.resconrec.2007.01.013
[31] Idir, R., Cyr, M., Tagnit-Hamou, A. (2011). Pozzolanic properties of fine and coarse color-mixed glass cullet. Cement and Concrete Composites, 33(1): 19-29. https://doi.org/10.1016/j.cemconcomp.2010.09.013
[32] Nigri, G., Cherait, Y., Nigri, S. (2017). Characterization of eco-substituted cement containing waste ground calcined clay brick. Canadian Journal of Civil Engineering, 44(11): 956-961. https://doi.org/10.1139/cjce-2016-0537
[33] European standard EN 196-3:2016. Methods of testing cement – Part 3: Determination of setting times and soundness. Brussels: European Committee for Standardization (CEN).
[34] European Standard EN 1015-6:1998+A1:2006. Methods of test for mortar for masonry — Part 6: Determination of bulk density of fresh mortar. Brussels, European Committee for Standardization (CEN).
[35] European Standard EN1015-3:1999+A1:2004+ A2:2006. Methods of test for mortar for masonry — Part 3: Determination of consistence of fresh mortar (by flow table). Brussels: European Committee for Standardization (CEN).
[36] Bouras, F., Nigri, G., Kechkar, C., Bouroumana, I., Benamara, F.Z., Messbahi, A., Mallem, D., Nigri, S. (2025). Characterization and optimization of olive pomace ash as a partial cement replacement. Revue des Composites et des Matériaux Avancés-Journal of Composite and Advanced Materials, 35(6): 1099-1105. https://doi.org/10.18280/rcma.350610
[37] Nigri, G., Cherait, Y., Nigri, S. (2020). Physical characterization and durability of blended cements based on brick powder. Civil and Environmental Engineering Reports, 30(3): 201-213. https://doi.org/10.2478/ceer-2020-0040
[38] ASTM Standard C642-21. Standard test method for density, absorption, and voids in hardened concrete. ASTM International. https://doi.org/10.1520/C0642-21
[39] European Standard EN 13057:2002. Products and systems for the protection and repair of concrete structures - Test methods - Determination of resistance of capillary absorption. https://ecommerce.sist.si/catalog/standards/sist/86659c01-b5c6-4c5b-85bf-8abd8e5af21f/sist-en-13057-2002.
[40] European standard EN 12504-4:2021. Testing concrete in structures – Part 4: Determination of ultrasonic pulse velocity. Brussels: European Committee for Standardization (CEN).
[41] European standard EN 197-1:2011. Cement – Part 1: Composition, specifications and conformity criteria for common cements. Brussels: European Committee for Standardization (CEN), 2011.
[42] Lafifi, B., Hamrouni, A., Khoualdia, T., Gheris, A., Rouaiguia, A. (2024). Prediction and optimization of the bearing capacity of strip footing resting on soft soil improved with stone columns using RSM, ANN, and multi-objective GA. Innovative Infrastructure Solutions, 9: 146. https://doi.org/10.1007/s41062-024-01452-2
[43] Hamlaoui, A., Lafifi, B., Houicha, H., Kihal, R., Rouaiguia, A. (2025). Enhancement of shear strength of clayey soil using Washingtonia palm biomass: experimental study and statistical analysis. Indian Geotechnical Journal, 56: 1850-1870. https://doi.org/10.1007/s40098-025-01235-1
[44] Derringer, G., Suich, R. (1980). Simultaneous optimization of several response variables. Journal of Quality Technology, 12(4): 214-219. https://doi.org/10.1080/00224065.1980.11980968
[45] Lafifi, B., Rouaiguia, A., Boumazza, N. (2019). Optimization of geotechnical parameters using Taguchi’s design of experiment (DOE), RSM and desirability function. Innovative Infrastructure Solutions, 4: 35. https://doi.org/10.1007/s41062-019-0218-z