Saif H. Muslim*![]() | Bashar O. Bedaiwi
| Bashar O. Bedaiwi![]()
© 2025 The authors. This article is published by IIETA and is licensed under the CC BY 4.0 license (http://creativecommons.org/licenses/by/4.0/).
OPEN ACCESS
Understanding the vibrational and mechanical characteristics of Rotary friction welding joints is essential for ensuring the reliability of shafts used in high-performance applications. This study investigates the mechanical and vibrational behavior of 7075 aluminum alloy rods joined by rotary friction welding (RFW) using an experimental approach. An impact hammer test was used to measure the vibration response at various welding parameters. The results showed that increasing the friction pressure increased the natural frequency, attributed to improved joint stiffness and residual stresses. In contrast, extending the friction time from 4 to 16 seconds decreased the frequency due to local thermal softening. The tensile properties and microhardness distribution were evaluated, showing that the ultimate tensile strength and Vickers hardness increased with increasing forging pressure to 30 bar, while they decreased with increasing friction time from 8 sec to 16 sec. The weld interface exhibited the lowest hardness, while the adjacent heat-affected zones (HAZ) exhibited relatively higher values. These results demonstrate a close correlation between the weld parameters and residual stresses, with the dynamic and mechanical behavior of RFW welded joints.
rotary friction welding, Al-7075alloy, vibration characteristics, mechanical properties
Friction welding (FW) is a process that uses the heat generated by friction to join materials. This process involves pressing two materials together while one is in motion. Frictional heat softens the materials at the contact zone. The parts are bonded in the solid state without attaining the material's melting temperature, enabling the welding of numerous materials that are incompatible with fusion welding techniques [1].
Rotary friction welding is among the most effective welding processes. It provides a method for joining similar and dissimilar parts, rendering it a crucial welding technique for rotary elements in aviation and automotive engines [2].
The process of rotary friction welding (RFW) involves two distinct phases [3]: the friction phase and the forging phase. The initial step is the heating phase, during which the two components are brought into contact for a designated duration to produce heat by rotating one of the workpieces at a constant velocity, while the opposing component is forced to press and rub against the rotating workpiece under a specific amount of normal pressure. After significant plastic deformation occurs, the second stage begins. The rotating part is stopped, with a regular increase in the normal pressure at a specified upset time [4].
Researchers have introduced various two-dimensional and three-dimensional models for distinct types of friction welding, including inertia, linear, and friction stir welding (FSW), to investigate the behavior of thermo-mechanical analysis [5-7]. Prior research on RFW has primarily concentrated on mechanical performance and thermal behavior, often overlooking the implications of residual stress and geometric changes on dynamic response. Studies on related processes, such as FSW, have demonstrated that welding-induced residual stresses can significantly alter natural frequencies and modal shapes. For instance, studies [8, 9] investigated FSW joints and reported that thermal gradients and plastic deformation generate complex stress fields that affect vibrational behavior. These insights suggest that a similar influence may exist in RFW, necessitating a focused investigation [10-17]. However, the influence of process welding and parameter combinations on the dynamic characteristics of friction-welded joints has been inadequately investigated. Li et al. [18] developed a fully coupled three-dimensional model using a plastic friction pair to simulate a Ni-based superalloy's inertia friction welding (IFW). Their results showed that increased initial velocity and friction pressure led to higher peak temperatures. The radial homogeneity was attributed to an increase in linear velocity along the radius and a varying contact pressure distribution.
Chen et al. [19] studied the effect of welding residual stresses on the natural frequencies of reinforced U-shaped steel box girder slabs to analyze the welding process and its dynamic behavior, and they revealed in their analysis that welding residual stresses have a significant influence on the natural frequencies of reinforced plates.
Current research on RFW joints has focused largely on mechanical strength or thermal aspects, without an in-depth study of how changes in friction pressure, time, and forging pressure affect dynamic properties, such as natural frequencies. This represents a critical gap, as dynamic loading is common in the service conditions of many rotating components, particularly in applications where dynamic loading is prevalent.
Aluminum alloy 7075 is a heat-treatable, high-strength material that finds extensive use in automotive and aerospace applications because of its good fatigue resistance and exceptional strength-to-weight ratio. Its main alloying element is zinc, which gives it better mechanical performance than other aluminum series [20-22].
Studying the mechanical and vibrational behavior of RFW welded joints is critical because weld integrity affects not only the static load-bearing capacity but also the dynamic response under service conditions. Welded parts are frequently subjected to varying loads and vibrations in high-performance environments, such as automotive and aerospace systems. By understanding how RFW welds affect these properties, it is possible to improve joint quality, increase fatigue resistance, and enhance overall structural performance.
Despite existing studies, the vibrational characteristics of RFW joints, particularly in high-strength aluminum alloys like 7075-T6, remain insufficiently explored, making it imperative to understand how RFW parameters influence their dynamic behavior.
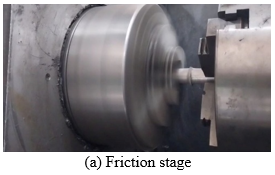
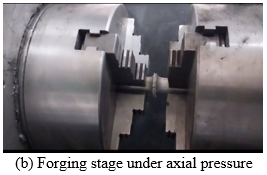
The RFW process was performed using a rotary friction welding continuous-drive machine (Model WL-15, manufactured by Y.S.P), which features a hydraulic system for precise axial force control and a digital control panel for presetting welding parameters. Maintaining precise control over friction and forging pressures, and times is essential for repeatability. The material selected for the experimental study was 7075-T6 aluminum alloy. It was chosen as an alloy widely used for various industrial purposes. It offers strength comparable to many steel alloys, along with ease of machining, corrosion resistance, light weight, and friction weldability compared to other aluminum alloys. Each workpiece has a length of 15 cm and a diameter of 2 cm. Table 1 presents the mechanical properties of 7075-T6 alloy. The confirmed chemical composition is summarized in Table 2. Figure 1 illustrates the welding machine in operation during the material joining stages. The WL-15 machine is capable of rotational speeds up to 3000 RPM and axial forces up to 50 bar. A constant rotational speed of 2,000 RPM was maintained across all experiments, with a fixed forging time of 3 seconds. Table 3 presents the experimental welding parameters. The welded shafts developed axial flash at the weld interface due to plastic deformation during the forging phase.
Table 1. Mechanical properties of Aluminum 7075 [23]
|
Properties |
Unit |
Value |
|
Vickers Hardness |
- |
175 |
|
Elastic (Young's, Tensile) Modulus |
GPa |
71 |
|
Ultimate Tensile Strength |
MPa |
572 |
|
Tensile Strength: Yield |
MPa |
503 |
|
Elongation at Break |
% |
11 |
|
Fatigue Strength |
MPa |
160 |
|
Poisson's Ratio |
- |
0.32 |
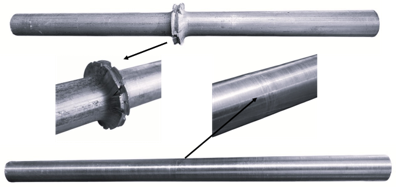
This flash was removed using a lathe machine to maintain dimensional precision and eliminate stress concentrators. Additionally, machining away axial flash without introducing new residual stresses is crucial to obtaining representative test specimens. The turning process was performed at 800 RPM with a feed rate of 0.1 mm/rev. Figure 2 displays the final welded joints.
Table 2. AA-7075-T6 chemical composition (WT%)
|
Element |
Zn |
Ni |
Mg |
Cu |
Cr |
Fe |
Ti |
Si |
Al |
|
Wt % |
3.6 |
0.02 |
1.32 |
1.6 |
0.43 |
0.52 |
0.03 |
0.38 |
Bal. |
Figure 1. Welding stages of Al 7075-T6 alloy
Table 3. The parameter conditions used in welding
|
No. |
Friction Pressure (Pf) bar |
Forging Pressure (Pu) bar |
Friction Time (tf) sec |
|
S1 |
5 |
15 |
4 |
|
S2 |
8 |
15 |
4 |
|
S3 |
11 |
15 |
4 |
|
S4 |
8 |
15 |
8 |
|
S5 |
8 |
15 |
16 |
|
S6 |
8 |
20 |
4 |
|
S7 |
8 |
20 |
16 |
|
S8 |
8 |
20 |
8 |
|
S9 |
8 |
30 |
4 |
|
S10 |
8 |
30 |
16 |
|
S11 |
5 |
30 |
8 |
|
S12 |
5 |
30 |
16 |
|
S13 |
8 |
30 |
8 |
|
S14 |
11 |
30 |
8 |
|
S15 |
11 |
30 |
16 |
Notes: Welding speed was maintained at 2000 rpm and upsetting time at 3 seconds for all tests.
Figure 2. RFW AA 7075-T6 joint
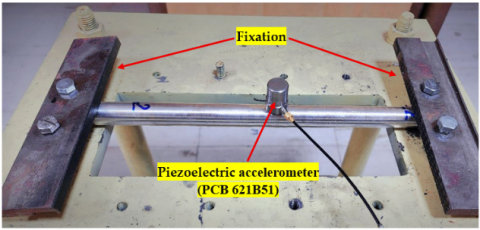
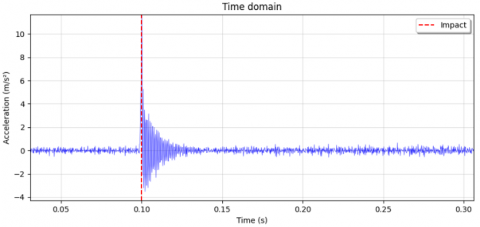
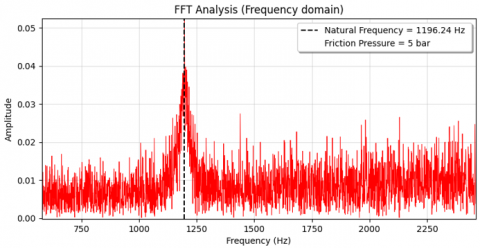
The vibrational properties of Al-7075 RFW joints were measured using an impact hammer test to determine the natural frequencies. The joint was clamped at both ends and was performed by attaching a 621B51 piezoelectric sensor at the weld zone to capture the vibration responses, as shown in Figure 3. The amplified signal was displayed using a HANTEK 4102 dual-channel digital oscilloscope, which plotted the captured waveform. The output acceleration signal was recorded using a data acquisition system. Standard signal processing methods were used to process the impact hammer test's time-domain vibration signals. A low-pass filter was initially used to eliminate high-frequency noise from the signals. To identify the natural frequencies and peak amplitude responses, the time-domain data was then converted into the frequency domain using the Fast Fourier Transform (FFT) [24]. SIGVIEW software was used for the study, and the sampling rate was set to 5000 Hz to guarantee precise frequency resolution. This setup ensured accurate measurement of the vibrational characteristics of welded joints.
Figure 3. Impact hammer experimental setup for vibration measurement of Al-7075 RFW Joints
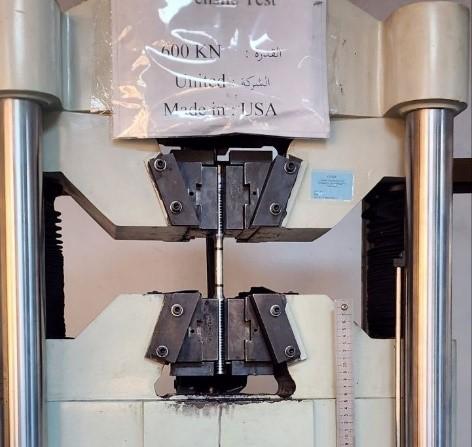
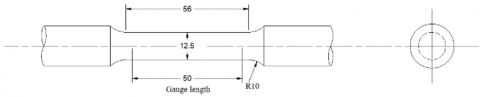
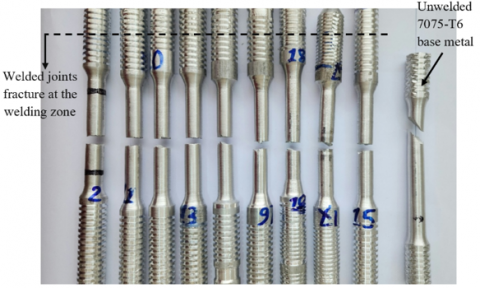
Tensile tests were conducted using a universal testing machine with a maximum load capacity of 600 kN, manufactured by United (Made in USA), as shown in Figure 4. The machine is equipped with wedge-action grips and digital data acquisition, ensuring precise force and displacement measurement in accordance. Specimens were machined using a precision lathe to obtain the standard geometry and surface finish within tolerance under ASTM E8/E8M standards as shown in Figure 5 for metallic materials. The weld interface is positioned precisely at the midpoint of the gauge length to ensure that any failure during testing would originate from the weld zone. Figure 6 shows that the fracture occurred specifically within the weld zone, confirming that it is the critical area subject to tensile stress. This consistent failure behavior provides essential insight into the effect of welding parameter combinations on joint integrity and mechanical reliability.
Figure 4. Universal testing machine used for tensile testing of RFW specimens
Figure 5. Standard dimensions of the tensile specimen according to ASTM E8/E8M (all dimensions in mm)
Figure 6. Tensile specimens after fracture show consistent weld zone failure
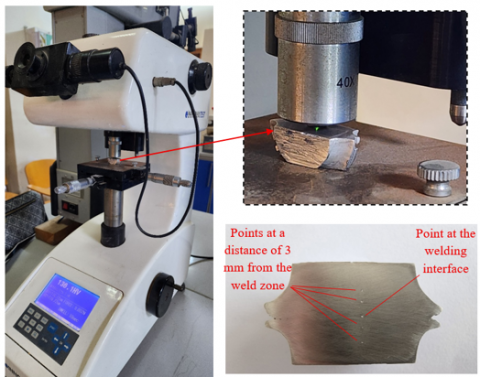
To evaluate localized mechanical properties across the welding zone, a microhardness test was performed on cross-sectional samples taken perpendicular to the weld interface. The specimens were meticulously prepared by sectioning through the weld center, followed by mechanical polishing to create a smooth, flat surface suitable for indentation.
Microhardness measurements were conducted using a Vickers indenter under a constant load of 9.807 N and a hold time of 10 sec to ensure consistency. To assess the hardness distribution and potential softening or hardening effects due to the welding process, several microhardness indentations were made along a horizontal line across the weld. As shown in Figure 7, the first measurement point was located directly at the weld interface, representing the heat-affected or thermo-mechanically affected zone. The second and third points were positioned symmetrically on either side of the weld within the base metal region, serving as reference values for comparison.
Figure 7. Indentation points for Vickers microhardness test: center point at weld interface and adjacent points in base metal
The hardness profile obtained from these three locations provides valuable insight into the localized mechanical changes introduced by the friction welding process. Notably, this method allows for the detection of potential strength degradation in the weld area compared to the base metal.
6.1 Dynamic behavior
The resonance frequency of Al-7075 RFW joints was recorded for the combinations of welding parameters at three levels of friction pressure, friction time, and forging pressure.
The response signal in the time domain (Figure 8) was analyzed via SIGVIEW software. Figure 9 shows the SIGVIEW output for the same welded joint in the frequency domain.
Figure 8. Time domain response of the weld joint at friction pressure: Pf =5 bar
Figure 9. Frequency response spectrum from SIGVIEW of the weld joint at friction pressure: Pf =5 bar
A series of experiments were conducted on samples welded at various friction pressures (5–11 bar), friction times (4–16 sec), and forging pressures (15–30 bar).
The observed frequency response curves exhibited clear shifts in the resonance peaks depending on the welding parameters. As listed in Table 4, increasing friction pressure resulted in noticeable upward shifts in the first-mode frequency. This suggests enhanced bonding at the weld interface and increased stiffness of the overall shaft. Conversely, increasing friction time led to a slight reduction in frequency, which may be attributed to overheating, flash material loss, or microstructural softening in the weld zone. The effect of forging pressure was significant; as the pressure increased from 15 to 30 bar, the resonance frequency consistently rose, indicating that higher axial loads during the forging stage contribute to stronger interfacial consolidation and stiffness gain [25].
Table 4. Fundamental natural frequencies for Al-7075 RFW joints under varied welding parameters
|
Welding Parameters |
Range |
Natural Frequency [Hz] |
|
Friction pressure [bar] |
5 |
1196.24 |
|
8 |
1418.65 |
|
|
11 |
1494.79 |
|
|
Friction time [s] |
4 |
1418.65 |
|
8 |
1426.6 |
|
|
16 |
1397.82 |
|
|
Forging pressure [bar] |
15 |
1418.65 |
|
20 |
1448.72 |
|
|
30 |
1534.4 |
The experimental data demonstrate that even moderate changes in welding parameters can substantially influence the dynamic response of friction-welded aluminum shafts.
6.2 Tensile properties
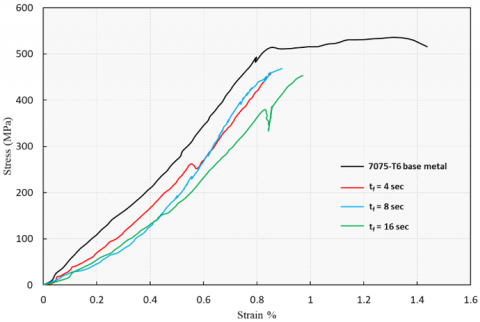
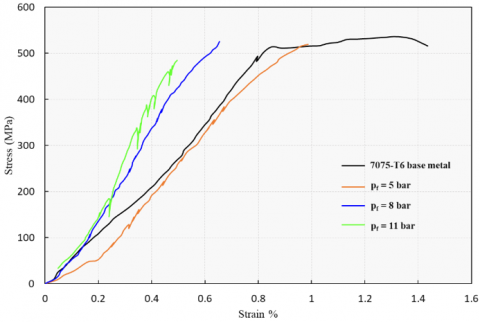
Tensile properties were conducted on rotary friction-welded AA7075 specimens under varying welding parameters to investigate the mechanical performance of the joints. Figures 10, 11, and 12 illustrate stress-strain curves at different levels of friction times, friction pressures, and forging pressures.
Figure 10. Tensile curves of welded joints at different friction times. (Pf=8 bar, Pu=15 bar)
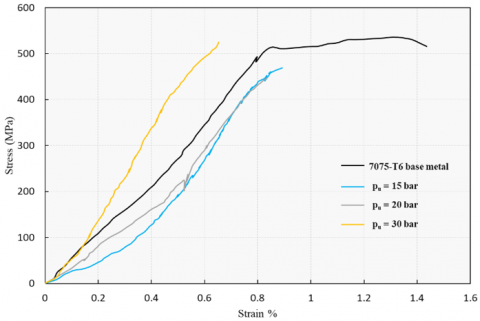
Figure 11. Tensile curves of welded joints at different friction pressures. (tf =8 sec, Pu=30 bar)
Figure 12. Tensile curves of welded joints at different forging pressures: (tf =8 sec, Pf =8 bar)
The results indicate a strong dependency of tensile properties on the welding parameters. Specifically, increasing friction pressure from 5 to 11 bar led to a reduction in UTS (from 518 MPa to 485 MPa) but an increase in modulus of elasticity (from 49.79 to 62.89 GPa), possibly due to the stiffer joint formation, but reduced ductility. UTS showed a decreasing trend with increasing friction time, with the lowest strength (455 MPa) recorded at 16 seconds. This may be attributed to thermal softening, flash expulsion, or microstructural coarsening at longer durations. Forging pressure had a more positive effect; UTS increased from 470 MPa at 15 bar to 507 MPa at 30 bar, suggesting that greater consolidation during the upsetting phase enhanced joint strength. All fractured specimens failed at the weld zone, indicating that the interface was the weakest point.
6.3 Hardness properties
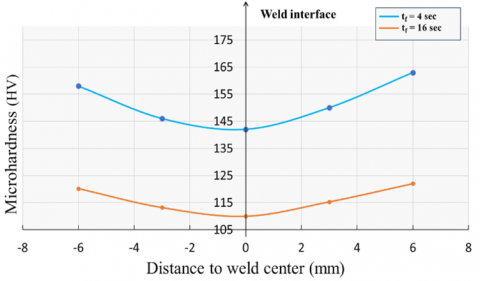
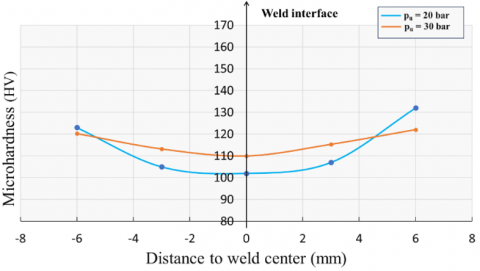
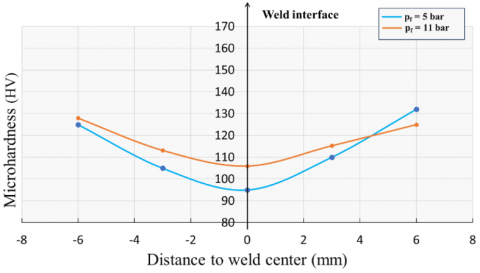
Microhardness measurements were carried out on cross-sections of the welded joints to assess the hardness distribution across the weld interface and heat-affected zone. Figures 13, 14, and 15 present the microhardness profiles for various friction times, forging pressures, and friction pressures. The results show that increasing friction pressure contributed to higher hardness values in the weld zone, likely due to enhanced material mixing and localized plastic deformation. In contrast, longer friction times produced a slight decrease in hardness at the weld interface, potentially caused by thermal softening effects in the surrounding HAZ. Forging pressure had a pronounced influence; joints welded with higher forging pressures (30 bar) showed improved hardness compared to those welded at 15 bar, suggesting stronger metallurgical bonding and reduced porosity. Overall, the microhardness distribution supports the tensile test findings and highlights the critical role of process parameters in achieving favorable weld integrity.
Figure 13. Microhardness profiles of welded joints at different friction times. (Pf=8 bar, Pu=30 bar)
Figure 14. Microhardness profiles of welded joints at different forging pressures. (Pf=8 bar, tf =16 sec)
Figure 15. Microhardness profiles of welded joints at different friction pressures. (Pu=30 bar, tf =16 sec)
7.1 Conclusions
This study conducted experimental investigations to explore the static and dynamic behavior of 7075 aluminum alloy joints under varying welding parameters. The key findings are summarized as follows:
Natural frequencies showed a significant 20% increase in the fundamental natural frequency when the friction pressure increased from 5 to 11 bar. Increasing the upset pressure from 15 to 30 bar resulted in a 7.5% increase in frequency. In contrast, increasing the friction time from 8 to 16 seconds resulted in a 3% decrease in frequency, likely due to thermal softening and material loss at the weld surface.
The tensile properties of welded joints were highly sensitive to welding parameters. Longer friction times reduced tensile strength due to thermal softening, while higher forging and frictional pressures improved joint stiffness.
Microhardness profiles revealed that the lowest hardness values occurred at the weld interface, particularly under longer friction times. In contrast, the surrounding heat-affected zone (HAZ) exhibited higher hardness. This trend suggests that thermal softening at the weld center reduced hardness, while the HAZ retained more of the original strengthening of the base material.
7.2 Recommendations
Based on the outcomes of this study, the following recommendations are proposed for future research:
Measuring residual stress using techniques such as X-ray diffraction or hole drilling could enhance how residual weld stress affects joint response.
Research into rotational friction welding of dissimilar materials, such as Al-Ti.
Study the influence of high vibration modes and fatigue behavior under cyclic loads to evaluate long-term weld performance.
The author expresses gratitude to Mustansiriyah University (www.uomustansiriyah.edu.iq), Baghdad, Iraq, particularly the College of Engineering, Mechanical Engineering Department, for its valuable support in this research. Additionally, the author appreciates their assistance and collaboration.
[1] Maalekian, M. (2007). Friction welding - Critical assessment of literature. Science and Technology of Welding and Joining, 12(8): 738-759. https://doi.org/10.1179/174329307x249333
[2] Xie, W., Song, D., Tang, W., Ma, J., Li, J. (2025). Auxiliary support path planning for robot-assisted machining of thin-walled parts with non-uniform thickness and closed cross-section based on a neutral surface. Journal of Manufacturing Processes, 147(2): 16-28. https://doi.org/10.1016/j.jmapro.2025.05.002
[3] Li, W., Vairis, A., Preuss, M., Ma, T. (2016). Linear and rotary friction welding review. International Materials Reviews, 61(2): 71-100. https://doi.org/10.1080/09506608.2015.1109214
[4] García, A.M.M. (2011). InTech eBooks: BLISK fabrication by linear friction welding. Advances in Gas Turbine Technology. https://doi.org/10.5772/21278
[5] Bennett, C. (2015). Finite element modelling of the inertia friction welding of a CrMoV alloy steel including the effects of solid-state phase transformations. Journal of Manufacturing Processes, 18: 84-91. https://doi.org/10.1016/j.jmapro.2015.01.003
[6] Li, W.Y., Ma, T., Li, J. (2009). Numerical simulation of linear friction welding of titanium alloy: Effects of processing parameters. Materials & Design, 31(3): 1497-1507. https://doi.org/10.1016/j.matdes.2009.08.023
[7] Chiumenti, M., Cervera, M., Agelet de Saracibar, C., Dialami, N. (2012). Numerical modeling of friction stir welding processes. Computer Methods in Applied Mechanics and Engineering, 254: 353-369. https://doi.org/10.1016/j.cma.2012.09.013
[8] Hattel, J.H., Sonne, M.R., Tutum, C.C. (2015). Modelling residual stresses in friction stir welding of Al alloys—a review of possibilities and future trends. The International Journal of Advanced Manufacturing Technology, 76(8): 1793-1805. https://doi.org/10.1007/s00170-014-6394-2
[9] Salih, O.S., Ou, H., Sun, W. (2023). Heat generation, plastic deformation and residual stresses in friction stir welding of aluminium alloy. International Journal of Mechanical Sciences, 238: 107827. https://doi.org/10.1016/j.ijmecsci.2022.107827
[10] Kuo, C.C., Gurumurthy, N., Chen, H.W., Hunag, S.H. (2023). Experimentation and numerical modeling of peak temperature in the weld joint during rotary friction welding of dissimilar plastic rods. Polymers, 15(9): 2124. https://doi.org/10.3390/polym15092124
[11] El-Hadek, M.A. (2014). Numerical simulation of the inertia friction welding process of dissimilar materials. Metallurgical and Materials Transactions B, 45(6): 2346-2356. https://doi.org/10.1007/s11663-014-0148-2
[12] Jasim, S., Saleh, N., Jasim, R. (2023). Numerical simulation and optimization of friction stir welding parameters. Basrah Journal for Engineering Sciences, 23(1): 72-80. https://doi.org/10.33971/bjes.23.1.10
[13] Çavuşoğlu, N. (2022). Effect of friction welding parameters on the mechanical and microstructural properties of dissimilar IN713C-AISI 4140 joints. Journal of Materials Engineering and Performance, 31: 4035-4048. https://doi.org/10.1007/s11665-021-06474-w
[14] Cavaliere, P., De Santis, A., Panella, F., Squillace, A. (2009). Effect of welding parameters on mechanical and microstructural properties of dissimilar AA6082-AA2024 joints produced by friction stir welding. Materials & Design, 30(3): 609-616. https://doi.org/10.1016/j.matdes.2008.05.044
[15] Kantumuchu, V.C., Cheepu, M.M. (2022). The influence of friction time on the joint interface and mechanical properties in dissimilar friction welds. Journal of Metallic Material Research, 5(1): 1-7. https://doi.org/10.30564/jmmr.v5i1.4209
[16] Dahlan, H., Nasution, A.K., Zuhdi, S.A., Rusli, M. (2023). Study of the effect of friction time and preheating on the joint mechanical properties of friction welded SS 316-pure Zn. Applied Sciences, 13(2): 988. https://doi.org/10.3390/app13020988
[17] Mukundhan, C., Sivaraj, P., Balasubramanian, V., Sonar, T., Petley, V., Verma, S. (2023). Effect of friction pressure on microstructure and tensile properties of linear friction welded Ti–6Al–4V alloy joints. International Journal of Lightweight Materials and Manufacture, 6(4): 483-493. https://doi.org/10.1016/j.ijlmm.2023.05.001
[18] Li, C., Qin, G., Wang, H. (2024). Omnidirectional simulation analysis of thermo-mechanical coupling mechanism in inertia friction welding of Ni-based superalloy. Chinese Journal of Aeronautics, 38(1): 103047. https://doi.org/10.1016/j.cja.2024.05.003
[19] Chen, L., Wang, T., Pan, J., Ma, N., Wang, R. (2022). Welding residual stress distribution of u-rib stiffened plates of steel box girders and its influence on structural natural frequencies. Frontiers in Materials, 9. https://doi.org/10.3389/fmats.2022.876111
[20] Nayeeif, A.A., Alasadi, A.A., Alalkawi, H.J.M. (2023). Effect of nano particle size on mechanical and fatigue behavior of TiO₂ reinforced aluminum alloy composites. International Journal of Nanoelectronics and Materials, 16(3): 535-544. https://doi.org/10.58915/ijneam.v16i3.1319
[21] Alhamdany A.A., Shihab T.A., Nayeeif A.A., Alalkawi H.J. (2025). Influence of stress cycles under the fatigue endurance limit on strength and life of aluminum nanocomposite. Tikrit Journal of Engineering Sciences, 32(2): 2338. https://doi.org/10.25130/tjes.32.2.10
[22] Ali, A.M., Nayeeif, A.A. (2025). Fatigue improvement of cast aluminum composites via experimental and ANSYS analysis. Revue des Composites et des Matériaux Avancés-Journal of Composite and Advanced Materials, 35(3): 427-435. https://doi.org/10.18280/rcma.350304
[23] ASM Aerospace Specification Metals Inc. https://asm.matweb.com/search/specificmaterial.asp?bassnum=ma7075t6.
[24] Nayeeif, A.A., Abdulrazzaq, M.A., Ali, H.A.K. (2023). Dynamic response study of the vibration of a washer. AIP Conference Proceedings, 2787: 090036. https://doi.org/10.1063/5.0149158
[25] Abed, M.S., Nayeeif, A.A., Ali, H.A.K., Jabbar, M.M. (2020). Comparative study of transverse vibration and mechanical properties of aluminium, Al 7020 alloy, and MWCNTs reinforced aluminium nanocomposites. International Journal of Nanoelectronics and Materials, 13(3): 509-522.