Ali Mohammed Saleh![]() | Hadi Hamdi Mahdi
| Hadi Hamdi Mahdi![]() | Azil Bahari Alias
| Azil Bahari Alias![]() | Obed M. Ali*
| Obed M. Ali*![]() | Wan Azlina Wan Ab Karim Ghani
| Wan Azlina Wan Ab Karim Ghani![]() | Thaer Abdulwahhab Shihab
| Thaer Abdulwahhab Shihab![]() | Syed Shatir A. Syed Hasan
| Syed Shatir A. Syed Hasan![]() | Omer Khalil Ahmed
| Omer Khalil Ahmed![]() | Noah Mohammed Saleh
| Noah Mohammed Saleh![]()
© 2024 The authors. This article is published by IIETA and is licensed under the CC BY 4.0 license (http://creativecommons.org/licenses/by/4.0/).
OPEN ACCESS
To improve the adsorption of hydrogen sulfide (H2S) by using coconut shell-activated carbon xerogel (CSACX), we adopted the response surface methodology (RSM) with a central composite design (CCD). This material was created by incorporating a cross-linker agent, initiator agent, and polymer. The process of creating CSACX involved synthesizing coconut shell activated carbon into a wet gel using chemicals such as sodium alginate, calcium carbonate, glucono delta-lactone (GDL), and distilled water in a sol-gel method to obtain a xerogel. Afterward, the gel was dried in an oven at 60℃ for 24 hours. Subsequently, it was used as an adsorbent for the adsorption test. The adsorption test was conducted at two different initial concentrations of H2S, 25 ppm, and 50 ppm, to assess the effectiveness of H2S removal at different concentrations. In the RSM approach, we selected adsorption pressure (1-3 bar) and H2S flow rate (100-300 L/hr) as the process variables while maintaining a constant contact time (5 minutes), adsorbent weight (11 g) and temperature (30℃). The removal efficiency of H2S (%) was chosen as the response. Our findings showed that the optimum conditions for H2S removal were at 1 bar and 100 L/hr for 25 ppm of H2S and 1 bar and 100.3830 L/hr for 50 ppm of H2S. The model generated from RSM predicted that maximum H2S removal can be achieved at a lower pressure and flow rate for any H2S initial concentration.
xerogel, response surface methodology, coconut shell, biomass, H2S adsorption
A safe environment is crucial for all living organisms, as pollutants from industrial activities can contaminate air and water, posing significant threats to ecosystems. Hazardous materials, including hydrogen sulfide (H₂S), are of particular concern due to their toxic and corrosive nature, which can damage industrial equipment and harm human health even at low concentrations. The study focuses on H₂S, which is a major pollutant in the production of natural gas and crude oil and can cause severe respiratory issues and other health hazards when released into the environment [1-3].
H2S is a highly toxic and foul-smelling gas. Exposure to H2S can have serious health effects, including coma, irritation of the eyes, and respiratory system irritation. Even at concentrations as low as 0.5 parts per million (ppm), the human nose can detect its characteristic odor [4, 5]. H2S is volatile in water and can dissolve in certain polar organic solvents. Prolonged or excessive exposure to H2S can lead to both acute and chronic health issues. The Agency for Toxic Substances and Disease Registry (ATSDR) recommends a minimum inhalation risk level of 0.02 ppm for H2S. Concentrations of H2S equal to or greater than 500-1000 ppm pose a significant threat to human life and can cause immediate harm to the body [6]. To protect employees, the Occupational Safety and Health Administration (OSHA) has set an exposure limit of 20 ppm for general industry during the workday. The Occupational Safety and Health Administration (OSHA) has set an exposure limit of 20 ppm for general industry during the workday to protect employees. Additionally, a maximum permissible level of 50 ppm is allowed for a maximum duration of 10 minutes. Exposure to high levels of H2S can result in fatalities [7, 8]. To address the acute and chronic toxicity of H2S, the Environmental Protection Agency (EPA) has recommended an oral reference dose (RFD) of 0.003 mg/kg/day and an inhalation reference concentration (RFC) of 0.001 mg/m3. Given the dangers associated with hydrogen sulfide, it is crucial to implement strict safety measures and adhere to regulatory guidelines to prevent exposure and protect human health.
There are several sources of H2S that can be found in various natural and industrial sources. For natural sources, H2S is created during the bacterial breakdown of organic matter in stagnant waters with low oxygen content, such as bags and swamps. This gas can also be released from the Earth's crust through geothermal vents or during volcanic eruptions in geothermal systems [4, 9, 10]. It is frequently produced by specific bacteria that thrive in warm, sulfur-rich conditions. These bacteria can produce H2S when they come into contact with hot water or steam that contains dissolved sulfur compounds, such as sulfates. As for the industrial sources, H2S may be found in the crude oil or natural gas streams during the refining of petroleum and natural gas. It is frequently discovered in sour natural gas and crude oil, which have greater sulfur compound concentrations [11]. H2S is eliminated from these hydrocarbon streams using specialized techniques like desulphurization. Moreover, a feedstock or intermediary in the process of several compounds is H2S. It can be produced while processing methanol, sulphuric acid, and other substances that include sulfur. In the pulp and paper industry, H2S can be produced when wood fibres or lignin are broken down to create a pulp [12].
Various treatment technologies are available to control the emission of H2S through ventilation systems. These technologies can be classified into physicochemical, chemical, biological, and electrochemical methods. They include stripping, catalytic oxidation, biofiltration, wet scrubbing (absorption), and adsorption. Physicochemical methods are commonly used for H2S removal due to their high efficiency and ease of operation [13, 14]. For example, oyster shells have been successfully employed as adsorbents for H2S due to their excellent removal capabilities [15]. Another approach involves impregnating activated carbon (IAC) with sodium carbonate in anaerobic conditions for fixed-bed adsorption of H2S at low concentrations [16]. Adsorption is a widely applied technique for removing organic substances from aqueous media, even at low concentrations. Researchers have recently focused on utilizing both natural and synthetic adsorbents for H2S removal, with an emphasis on using biodegradable materials when possible [17, 18].
Above all, new solid material has been created over the past few decades, such as organic gel, to capture H2S. Organic gel can be divided into various types of gels based on its drying method. These types are classified into xerogel, aerogel, and cryogel, depending on their specific drying conditions. Table 1 shows the comparison between the organic gel and its respective drying method. However, xerogels have been widely used as an adsorbent for effective separation and gaining high purity of substance. This is due to their high surface area and their permeability properties. Moreover, its simplification in preparing the xerogel requires low temperature and pressure, making the xerogels preferable to another gel. To increase its chemical properties, xerogel can be chemically treated with biochar [19].
Table 1. Comparison between organic gels and their drying method
|
Organic Gels |
Xerogel |
Aerogel |
Cryogel |
|
Drying method |
Oven drying at 60℃ |
Supercritical CO2 drying |
Freeze-drying |
Historically, lignocellulosic precursors or biomass such as palm kernel, wood, coconut shells, rice husks, and other lignocellulosic materials have been carbonised to form porous activated carbons. The resulting biochar is then often activated to further develop its porous texture by carbonizing dry organic gels. Porous carbon gels are produced by the sol-gel polymerization of organic monomers under acidic or basic conditions at specific temperatures [20]. Biomass, normally worthless yet expensive to dispose of, is now a useful resource for the manufacture of biochar. Biochar made from biomass is just one of the numerous useful bioenergy and bioproducts created during pyrolysis. Biochar that is carbon-enriched results from the burning or driving off volatile gases, including methane, carbon monoxide, and other combustible gases, hydrocarbons, and the majority of the oxygen in the biomass. In terms of the total area planted, coconut ranks fourth among important industrial crops in Malaysia, behind oil palm, rubber, and paddy [21]. Malaysia is a significant exporter of coconut goods. Due to its high carbon content, hardness, and reputation as being better than those produced from other sources, coconut shell was chosen for this experiment.
The gap identified in this study is the need for improved cost-effective adsorbents for hydrogen sulfide (H₂S) removal, specifically focusing on enhancing the adsorption capacity, selectivity, and stability of carbon xerogels (CX) derived from coconut shell biochar waste. While current methods, including the use of various agricultural waste-derived adsorbents and commercial activated carbon, have shown potential, they suffer from limitations such as low adsorption capacity, weak adsorption strength, and environmental concerns many research made a modification on the surface to enhance the adsorption capacity according to [22-24].
Response surface methodology (RSM) is currently the most often used tool for optimization processes due to its ability to describe the interaction and quadratic effects of the process variables [25]. It uses a final set of equations that can create a response theoretical value based on the parameters and data input from the experiment. The results come from a carefully planned regression analysis that is based on the controlled values of independent variables. The experiment test stage is made more effective by using the RSM approach in the optimization process because it simply takes a short amount of time to evaluate all the parameters related to the researcher evaluation. Additionally, parameter estimation can highlight the factors that are significantly influencing the model, allowing researchers to concentrate on the precise factors that influence the proposed product [26]. Numerous papers have recently been published that use the (RSM) to find the best parameters for minimising the number of experimental runs and figuring out the optimum operating parameters for H2S adsorption [27].
The primary objective of the study is to optimize H₂S adsorption using coconut shell-activated carbon xerogel (CSACX) through response surface methodology (RSM) by varying pressure and H₂S flow rate while keeping other factors constant. The study prepared CSACX, conducted adsorption tests in a laboratory-scale column, and analyzed the results using statistical methods, contributing to the knowledge of CSACX as an effective H₂S adsorbent.
2.1 Material, preparation, and characterizations of CSACX
Coconut shell was the organic precursor for this experiment. Coconut shell that has been commercially available was obtained and acquired. Furthermore, this coconut shell is readily activated.
In producing CSACX, other chemical substances are needed, such as cross-linker substances, an initiator, and a polymer. For this study, calcium carbonate is chosen as the cross-linker and sodium alginate as its polymer. These two chemical substances were supplied by Universiti Teknologi MARA Shah Alam. For the initiator, glucono delta-lactone (GDL) was purchased from Orc Chem Technologies Sdn. Bhd. Throughout this entire experiment, distilled water is used in preparing the sodium alginate solution.
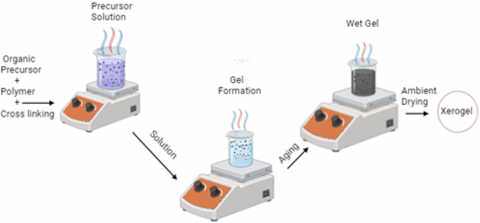
The sol-gel process for creating CSACX involves three main stages: sol-gel formation, gel aging, and gel drying. Initially, 4.11 grams of sodium alginate is dissolved in 500 ml of distilled water to achieve a 2% alginate concentration in solutions [28]. The alginate solution should be prepared 24 hours in advance to reduce the dissolution time. Then, 1.72 grams of calcium carbonate and 2.85 grams of CSAC are added to the alginate solution step by step and stirred at 400 rpm, forming a colloidal suspension (sol) through hydrolysis and condensation. The sol transforms into a gel via cross-linking, facilitated by polymerizing calcium carbonate. Finally, 4.6 grams of glucono delta-lactone (GDL) is added to the mixture to induce ionization, completing the process as shown in Figure 1 below.
Figure 1. Steps for xerogel synthesis
In the sol-gel formation section, an alginate solution is made by thoroughly dissolving 10 g of sodium alginate in 1000 mL of distilled water. 24 hours before the preparation of the sample, the alginate solution is made. The purpose of this step is to speed up the process of dissolved sodium alginate in distilled water. At 400 rpm of mixing rate and 40℃ on a hot plate, 2 g of calcium carbonate powder were poured into the alginate solution and is mixed vigorously until it is homogenous. Then, 10 g of grinded activated coconut shell were added into the alginate/calcium carbonate solution and producing colloidal suspension or sol. By crosslinking the calcium ions (Ca+) in calcium carbonate solution with sodium alginate, sol is allowed to convert into gel by polymerisation process. After the solution is homogenised, 10 g of GDL is added to the solution. This is important as it allows for dissolution of calcium carbonate and alginate by hydrolysing into gluconic acid [29]. Hence, the formed wet gel will be produced at the end of the mixing process after 10 minutes of mixing with GDL.
The formed wet gel is transferred in a mold and then put in the freezer for 15 minutes before proceeding for the drying process. To increase the stability of the wet gel, the aging process is done by keeping the wet gel at room temperature for 24 hours after freezing. Then, the wet gel is dried at 60℃ for 24 hours for complete drying and to obtain the coconut shell-activated carbon xerogel [30]. Lastly, the dried xerogel is crushed into fine powder and is prepared for H2S adsorption experiment.
Characterization of the coconut shell activated carbon xerogel (CSACX) involved several analytical techniques to assess its properties. The CHNS-O analysis was conducted after degassing the samples at 90℃ for 1 hour and 300℃ for 4 hours under nitrogen circulation, we found as shown in Table 2 below.
Table 2. EA test results
|
Raw Materials |
C |
H |
N |
S |
O |
|
PKSAC |
40.67 |
0.94 |
1.54 |
0.65 |
56.27 |
The Brunauer-Emmett-Teller (BET) analysis, using a micrometric 3 flex surface analyzer, involved a nitrogen (N2) adsorption and desorption process at 77 K, with a sample weight of 0.2 g and a heat rate of 10℃/min. The BET analysis was carried out at 40℃ over 6 hours shows the results in the Table 3 below.
Table 3. CSACX using BET analysis
|
Materials |
SSA (m2/g) |
Pore Volume (cm3/g) |
Pore Size (nm) |
|
CSACX |
4.2559 |
0.01983 |
6.2480 |
Table 2 presents the specific surface area (SSA), pore volume, and pore size of the coconut shell-activated carbon xerogel (CSACX). CSACX has a (SSA) of 4.2559 m²/g, a pore volume of 0.01983 cm³/g, and an average pore size of 6.2480 nm, indicating its moderate porosity and surface characteristics suitable for adsorption applications.
Fourier Transform Infrared Spectroscopy (FTIR), conducted according to ASTM E1252-98 standards, used a Perkin Elmer Spectrum 2000 FTIR to examine structural composition changes at wavelengths ranging from 4000 to 515 cm-1. Figure 2 shows the FTIR functional group of CSACX.
Figure 2. FTIR spectrum of CSACX
The FTIR spectrum helps in identifying the functional groups present in the sample in the figure represents the transmittance (%) of infrared light as a function of wavenumber (cm⁻¹) [31]. The peaks in the spectrum correspond to the absorption of infrared light by specific functional groups in the material. Each peak represents a particular vibration mode of the bonds within the molecules. The broad peak around 3300-3500 cm⁻¹ likely indicates the presence of O-H stretching vibrations, 2900-2800 cm⁻¹ could be attributed to C-H stretching vibrations from aliphatic hydrocarbons, the region around 1700-1600 cm⁻¹ is often associated with C=O stretching vibrations, which could indicate carbonyl groups and peaks around 1500-1000 cm⁻¹ might correspond to C-O stretching and C-H bending vibrations, typical of various organic compounds.
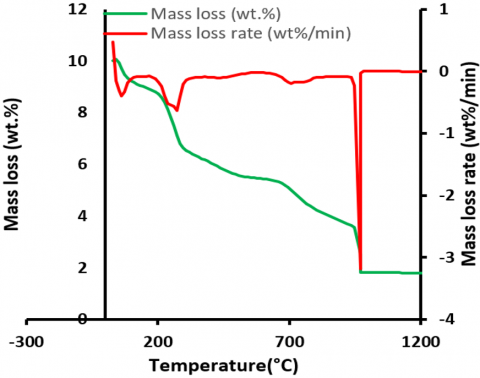
Thermogravimetric analysis (TGA), following the ASTM D5142-02a standard, was employed to evaluate the material's stability and the sample stand up to 980℃ as shown in Figure 3 below.
Figure 3. TG-DTG characterization for CSACX
25 ppm and 50 ppm of H2S will be utilised throughout this experiment to compare the adsorption capability by using CSACX. These H2S gas were obtained in a cylinder tank. 25 ppm of H2S was obtained from Alpha Gas Solution Sdn. Bhd, while 50 ppm of H2S was obtained from Linde Malaysia Sdn. Bhd.
2.2 Optimization by RSM
In this study, Design Expert (version 13) software was used to improve the mathematical model and determine the regression analysis, analysis of variance (ANOVA) and the response surface. The removal efficiency of H2S by using CSACX was studied with RSM design using a central composite design (CCD). The CCD method selected for the experimental design is suitable for efficiently fitting a quadratic surface with minimal experiments, which aids in effectively optimizing the process parameters. Moreover, this method facilitates the examination of the interactions among these parameters, providing valuable insights into their combined effects [32].
From the literature review of H2S adsorption analysis, two significant variables were simultaneously optimized using RSM which is pressure (A) and the gas flowrate (B). Therefore, this study optimised these 2 variables and improvised it by comparing two different H2S gas concentrations at 25 ppm and 50 ppm to extend this scope of study further. Thus, these two variables were selected as the independent variables, and H2S removal efficiency (%) was chosen as the response in the RSM method.
RSM-CCD consists of 8 full factorial designs enhanced with a group of star points (axial), two center points, and a value of alpha (α) of 1.41421 was chosen to design the experiments. Each mentioned variable in the design was conducted using two different parameters, as shown in Table 4. As for the number of experiments, RSM-CCD optimised 10 experiments with H2S removal efficiency (%) as the response.
Table 4. Variables and levels used in RSM
|
Variables |
Unit |
Low (-1) |
High (+1) |
− α |
+ α |
|
A: Pressure |
bar |
1 |
3 |
0.5858 |
3.4142 |
|
B: H2S Flowrate |
L/hr |
100 |
300 |
58.5786 |
341.4210 |
Statistical tools, including coefficient of determination (R2), Fisher value (F-value), probability value (P-value), and residual analysis, were employed to assess the significance of the model equations and their individual terms. Additionally, graphical representations, such as three-dimensional plots, were utilised to analyze the combined effects of various factors on the responses. Furthermore, predicted versus actual value plots were generated for the response variables to provide a visual assessment of the model's accuracy.
The optimization process involved determining the most favorable operating conditions for the process variables. To achieve this, specific goals were established by taking into account various constraints. For the factors of pressure and H2S flowrate, the goals were set within “in range”, with constraints between 1-3 bar for pressure and 100-300 L/hr for the H2S flowrate. The primary objective was to maximize the response surface, so removal efficiency was set “maximise”. As a result, RE was designated as the objective function or performance index, guiding the optimization process toward achieving the highest possible removal efficiency for H2S.
Model validation was done to assess the accuracy and reliability of the predicted values by the model and the experimental values obtained during the study. By conducting an adsorption experiment under optimum operating conditions, model validation was carried out.
The adsorption test was done by using a laboratory-scale adsorption column in the Gas Lab provided by the faculty of CSACX was examined to check the removal efficiency of various concentrations of H2S gas coming from the cylinder tank. A sample of 11 g of CSACX was measured and used for each run with a constant contact time and temperature of 5 minutes and 30℃, respectively. The removal efficiency (RE) for H2S was calculated using Eq. (1):
$R E (\%)=\frac{\mathrm{C}_0-\mathrm{C}_{\mathrm{e}}}{\mathrm{C}_0} \times 100\%$ (1)
where, C0 and Ce are the initial concentration of H2S and the final concentration of H2S at 5 minutes, respectively. The final concentration of H2S was measured by using portable gas detection equipment. All adsorption experiments were done using gas masks as a safety measure.
3.1 Responses obtained from adsorption test
The design matrix of this study for H2S concentrations are shown in Table 5. From Table 5, the lowest values of RE for 25 ppm and 50 ppm of H2S were 55.2% and 50.4%, respectively. On the other hand, the highest RE for 25 ppm and 50 ppm of H2S were 94.8% and 91.2%, respectively. These RE values of H2S by using CSACX were calculated by using Eq. (1). Table 6 presents the regression statistics models for RE for both initial concentrations of H2S gas at 25 ppm and 50 ppm.
In the case of RE at equilibrium for 25 ppm, the linear model demonstrates the lowest R2 value of 0.9191, accompanied by a standard deviation of 0.0252. Surprisingly, the cubic model outperforms the linear model with a greatly higher R2 of 0.9777 and a smaller standard deviation of 0.0247. However, it is worth noting that the cubic model is found to be aliased for this study. Alternatively, the linear model displays an impressive maximum adjusted R2 value of 0.8960, along with a predicted R2 of 0.8339 compared to the other models, making it a viable option for analysis.
Moving on to the regression statistics for initial concentration of 50 ppm, the linear model exhibits the lowest R2 value of 0.9676, but it is accompanied by a relatively high standard deviation of 0.0178 compared to the other models. In contrast, the cubic model is aliased and emerges as a strong contender with a significantly higher R2 of 0.9954 and a smaller standard deviation of 0.0126. The quadratic model also displays promising results with an R2 value of 0.9892 and a standard deviation of 0.0136. Hence, the linear model is again suggested for 50 ppm of H2S gas as the adjusted R2 and predicted R2 is the highest at 0.9583 and 0.93444, respectively, compared to the other models.
Overall, the cubic model proves to be highly effective for all initial concentrations of H2S, as it consistently demonstrates a high R2 value while maintaining relatively low standard deviations. A higher R2 value close to unity indicates that it is a good agreement between the experimental and the predicted values from the models. Moreover, a smaller standard deviation indicates that the model is better as it gives the predicted values closer to the actual values for the response. However, the linear model could be considered as a valid alternative, given its strong performance and stability in the results, as this model maximizes the adjusted R2 and the predicted R2.
Table 5. Experimental design matrix and results
|
Run |
Variables |
Response: Removal Efficiency (%) |
||
|
A: Pressure (bar) |
B: H2S Flowrate (L/hr) |
25 ppm |
50 ppm |
|
|
1 |
2 |
58.5786 |
87.4 |
91.0 |
|
2 |
3 |
100 |
86.8 |
78.4 |
|
3 |
1 |
100 |
94.8 |
91.2 |
|
4 |
2 |
341.4210 |
56.8 |
50.4 |
|
5 |
2 |
200 |
66.8 |
70.8 |
|
6 |
2 |
200 |
73.6 |
74.8 |
|
7 |
3 |
300 |
55.2 |
53.4 |
|
8 |
3.4142 |
200 |
72.0 |
68.6 |
|
9 |
0.5858 |
200 |
74.0 |
77.3 |
|
10 |
1 |
300 |
65.6 |
61.4 |
Table 6. Regression statistics for removal efficiency at various H2S concentrations.
|
Initial Concentration |
Source |
Standard Deviation |
R2 |
Adjusted R2 |
Predicted R2 |
Comment |
|
25 ppm |
Linear |
0.0252 |
0.9191 |
0.8960 |
0.8339 |
Suggested |
|
2FI |
0.0261 |
0.9253 |
0.8879 |
0.7431 |
|
|
|
Quadratic |
0.0293 |
0.9373 |
0.8588 |
0.6042 |
|
|
|
Cubic |
0.0247 |
0.9777 |
0.8997 |
0.5442 |
Aliased |
|
|
50 ppm |
Linear |
0.0178 |
0.9676 |
0.9583 |
0.9344 |
Suggested |
|
2FI |
0.0192 |
0.9677 |
0.9515 |
0.9158 |
|
|
|
Quadratic |
0.0136 |
0.9892 |
0.9757 |
0.9362 |
|
|
|
Cubic |
0.0126 |
0.9954 |
0.9793 |
0.9538 |
Aliased |
3.2 Development of regression model equation
This study developed a correlation between the adsorption test variables and the removal efficiency using a regression analysis called central composite design (CCD) to fit the response function. Based on Table 6, the predicted R2 for both H2S initial concentrations are in reasonable agreement with the adjusted R2 as the difference is less than 0.2. The design involved finding the center point to estimate experimental errors accurately. By employing the sequential model sum of squares, the most appropriate order of polynomials was determined to select the optimal model. To evaluate the quality of the model in predicting the response, two key factors were considered: the standard deviation, which should be minimized, and the R2 value, which ideally should be as to 1 as possible [33]. By achieving a smaller standard deviation and a higher R2 value, the model demonstrates a better ability to predict removal efficiency. Ultimately, the Design Expert software recommended a linear model for 25 ppm and 50 ppm, as given in Eqs. (2) and (3), respectively. Moreover, this model represents the best fit for the experimental data and can be used to make accurate predictions regarding H2S gas removal efficiency based on the input variables.
$\log _{10} \text { RE }(\%)= 2.04664-0.016260A-0.000776B$ (2)
$\log _{10} \text { RE }(\%)= 2.07328-0.024955A-0.000877B$ (3)
where, the variables take their coded values, represents A as pressure (bar) and B as H2S flowrate (L/hr).
To further assess the suitability and validity of the model, Analysis of Variance (ANOVA) was employed. The ANOVA results provide valuable insights into the linear model's performance in predicting removal efficiency of H2S. These findings are presented in detail in Table 7 below.
Table 7. Analysis of variance (ANOVA) and lack of fit test for a response surface linear model for RE
|
Res. |
Co |
Sources |
Sum of Squares |
df |
Mean Square |
F-value |
P-value |
Comment |
|
RE (%) |
25 ppm |
Model |
0.0503 |
2 |
0.0252 |
39.77 |
0.0002 |
Significant |
|
A: Pressure (bar) |
0.0021 |
1 |
0.0021 |
3.34 |
0.1103 |
Not significant |
||
|
B: H2S flowrate (L/hr) |
0.0482 |
1 |
0.0482 |
76.20 |
< 0.0001 |
Significant |
||
|
Residual |
0.0044 |
7 |
0.0006 |
|
|
|
||
|
Lack of Fit |
0.0035 |
6 |
0.0006 |
0.6666 |
0.7335 |
Not significant |
||
|
50 ppm |
Model |
0.0665 |
2 |
0.0332 |
104.41 |
< 0.0001 |
Significant |
|
|
A: Pressure (bar) |
0.0050 |
1 |
0.0050 |
15.65 |
0.0055 |
Significant |
||
|
B: H2S flowrate (L/hr) |
0.0615 |
1 |
0.0615 |
193.17 |
< 0.0001 |
Significant |
||
|
Residual |
0.0022 |
7 |
0.0003 |
|
|
|
||
|
Lack of Fit |
0.0019 |
6 |
0.0003 |
1.14 |
0.6154 |
Not significant |
(a)
(b)
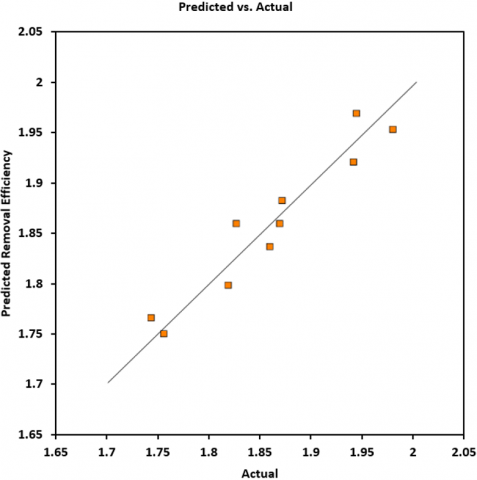
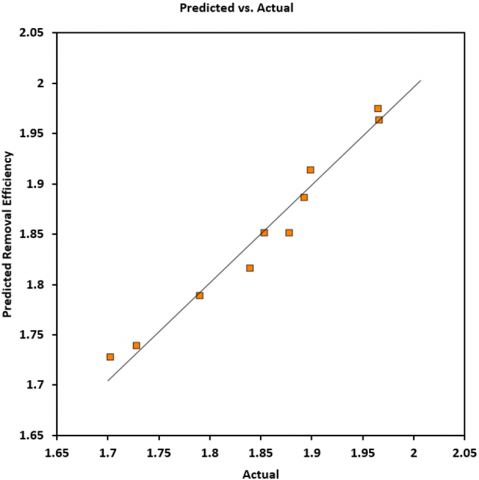
Figure 4. (a) Predicted vs. experimental removal efficiency for 25 ppm of H2S gas; (b) Predicted vs. experimental removal efficiency for 50 ppm of H2S gas
For 25 ppm of H2S concentration, the linear model for RE has an F-value of 39.77, indicating that the model is significant. P-value less than 0.05 indicates the model terms are significant. Thus, the significant model term is only B in this case, while only A is the insignificant term as the P-value is greater than 0.10. The insignificant term indicates the variable did not affect the model generated by the software, and it was removed from the model. The lack of fit F-value of 0.6666 implies the lack of fit is insignificant relative to the pure error. Insignificant lack of fit is good, and it shows that the suggested model is appropriate to predict the removal efficiency within the range of variables studied [34].
As for the 50 ppm of H2S concentration, the ANOVA and lack of fit test for this concentration showed that the linear model is significant as the F-value of 104.41 and P-value less than 0.0001. Therefore, the significant model terms are A and B. Lack of fit for this concentration shows an insignificant model implies that linear model also is appropriate same as at 25 ppm.
The final experimental model in terms of coded factors after excluding the insignificant terms for removal efficiency for H2S initial concentration at 25 ppm are shown in Eq. (4) while at 50 ppm remain the same as Eq. (3).
$\log _{10} R E(\%)=2.04664-0.000776B$ (4)
Figure 4 illustrates the predicted values versus the experimental values for H2S removal efficiency. From Figure 4, the obtained experimental values for H2S initial concentrations were quite close to the predicted values. This shows that the developed model was a succeed in determining the correlation between the selected variables for adsorption test (pressure and H2S flowrate) to the H2S removal efficiency.
3.3 Factors combined effect on response of removal efficiency
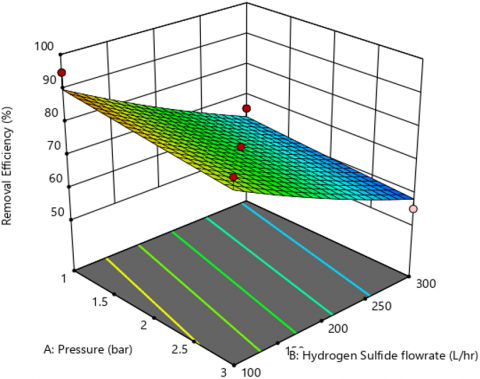
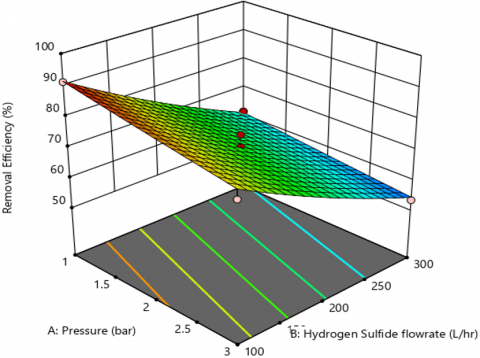
The experimental H2S adsorption data was fitted to the response model represented by Eq. (3) and Eq. (4), and the results are depicted in Figure 5. In order to investigate the impacts of the two variables (pressure and H2S flowrate) on H2S adsorption, response surface methodology (RSM) was employed. This allowed the generation of insightful three-dimensional plots.
The utilization of the RSM response model facilitated a comprehensive analysis of how different factors influence H2S adsorption. By visualizing the data in three-dimensional plots, this gained a deeper understanding of the interplay between the variables and their effects on the adsorption process. This approach offered valuable insights into the optimal conditions for maximizing H2S adsorption and shed light on potential relationships between the variables and the adsorption response.
Figure 5 shows the combination between two variables on the H2S removal efficiency at constant adsorbent weight, contact time and temperature for 25 ppm and 50 ppm of H2S, respectively. From the figure, it shows that pressure (A) and H2S flowrate (B) has a significant effect on the H2S adsorption. In Figure 5(a), maximum removal efficiency of H2S of 94.8 % was achieved at the lowest pressure and the lowest flowrate of 1 bar and 100 L/hr, while in Figure 5(b) at 1 bar and 100 L/hr, the H2S removal was maximized at 91.2 % when operating at a lower condition. It shows that at any H2S concentration, the removal efficiency can improve progressively at a lower pressure and flowrate.
The adsorption of H2S onto CSACX is a surface phenomenon. The H2S molecules are attracted to the surface of the CSACX and adhere to it. The adsorption process is influenced by several factors, including the surface area of the absorbent, the pressure and flow rate of the gas [35]. Operating at low pressure creates a concentration gradient between the gas phase of H2S and the CSACX surface. This gradient drives the H2S molecules to move from the gas phase to the surface of the CSACX, increasing the removal efficiency [36]. In this study, at a lower pressure of 1 bar, the H2S molecules have a higher probability of interacting with the CSACX surface, leading to a higher removal efficiency. On the other hand, a low flowrate of H2S allows for a longer contact time between the H2S molecules and the CSACX surface. This extended contact time enhances the chances of adsorption, leading to a higher removal efficiency [37]. Hence, at a lower flowrate of 100 L/hr, the H2S molecules have more time to interact with the CSACX surface, increasing the probability of adsorption.
The result of this study is comparable with several studies that were conducted almost similar to the present study. A study by the author investigated the effect of the duration of the adsorption step and purge flow rate on the performance of a demand-driven pressure swing adsorption system. The results showed that a longer adsorption duration and a lower purge flow rate led to a higher adsorption capacity [38]. Zulkefli et al. [39] examined the adsorption-desorption behavior of H2S on a modified activated carbon surface. The adsorption tests were conducted with a constant feed concentration (5000 ppm H2S diluted in N2), flowrate (5.5 L/min) and absolute pressure (1.5 bar). The results showed that a low flowrate and low pressure led to a higher adsorption capacity. Moreover, Verner et al. [40] investigated the effect of different adsorbents, including activated carbon, on the competitive adsorption of gaseous emissions. The results showed that a low pressure and low flowrate of gas led to a higher adsorption capacity for all the adsorbents tested.
3.4 Optimization and model validation
Design Expert software analysis led to the identification of optimal conditions for maximizing the responses (RE) at two different H2S concentrations: 25 ppm and 50 ppm. For 25 ppm, the best combination was achieved with a pressure of 1 bar and at H2S flowrate of 100 L/hr. Meanwhile, for 50 ppm, the optimum values were a pressure of 1 bar and a slightly higher H2S flow rate of 100.3830 L/hr.
It is worth noting that the experimental results for both initial concentrations (25 ppm and 50 ppm) were closely matched the values predicted by the RSM model, with errors ranging between 1 % and 3 %. These findings are summarized in Table 8 and Figure 5, and based on these parameters, an adsorption test can be designed for further experimental investigation.
(a)
(b)
Figure 5. (a) Three-dimensional response surface plot of removal efficiency (effect of pressure and H2S flowrate) for 25 ppm of H2S gas; (b) Three-dimensional response surface plot of removal efficiency (effect of pressure and H2S flowrate) removal efficiency for 50 ppm of H2S gas
Table 8. Model validation
|
Initial H2S Concentration |
25 ppm |
50 ppm |
|
A: Pressure (bar) |
1 |
1 |
|
B: H2S Flowrate (L/hr) |
100 |
100.3830 |
|
Theoretical RE (%) |
89.84 |
91.33 |
|
Experimental RE (%) |
92.80 |
90.40 |
|
Error (%) |
3.29 |
1.02 |
As a result, the RSM model equation has been deemed valid, demonstrating its ability to accurately predict the response variable in the adsorption process. This prediction capability makes it a valuable tool for optimizing adsorption conditions in future studies.
This study successfully developed and characterized a novel coconut shell-activated carbon xerogel (CSACX) using a sol-gel process. The combination of sodium alginate as a polymer, calcium carbonate as a cross-linker, and glucono delta-lactone (GDL) as an initiator proved effective in forming a stable gel that could be dried and transformed into CSACX with suitable adsorption properties. The material's characterization using CHNS-O analysis, BET analysis, FTIR, and TGA spectroscopy revealed its moderate porosity, specific surface area, and the presence of functional groups favourable for adsorption applications and stability.
The optimization of hydrogen sulfide (H2S) removal using CSACX was rigorously analyzed through response surface methodology (RSM) with a central composite design (CCD). The study identified pressure and gas flow rate as critical parameters affecting the removal efficiency (RE) of H2S at two different concentrations, 25 ppm and 50 ppm. The linear regression model was found to be the most suitable for predicting RE, demonstrating strong adjusted and predicted R² values, thereby affirming its reliability for H2S adsorption predictions under the given experimental conditions.
The experimental results underscored the efficacy of CSACX in removing H2S, with the highest removal efficiencies reaching 94.8% for 25 ppm and 91.2% for 50 ppm of H2S. The statistical models developed provided a robust framework for understanding the influence of pressure and flow rate on the adsorption performance. Despite the cubic model's higher R² values, the linear model was preferred due to its stability and lower risk of aliasing, making it a more practical choice for the prediction and optimization of the adsorption process.
Despite the promising results, this study has several limitations. First, the study was conducted on a laboratory scale. Second, the adsorption experiments were limited to specific H₂S concentrations (25 ppm and 50 ppm). Future research should focus on scaling up the process to pilot and industrial levels to assess the practicality and economic viability of using CSACX for large-scale H₂S removal.
The findings of this study have significant practical implications for industries where H₂S removal is crucial, such as natural gas processing, wastewater treatment, and biogas purification. The optimized CSACX adsorbent offers a cost-effective and environmentally friendly alternative to traditional adsorbents, with potential applications in reducing other hazardous gas emissions and improving air quality for example CO2, SO2, and CH4.
First of all, we would like to thank Allah S.W.T. for His Blessing in the completion of this manuscript. The authors would like to express their deepest gratitude to all those who have provided the means and possibility for completing this work. The research was conducted at the School of Chemical Engineering, Universiti Technologi MARA, Shah Alam, Selangor, Malaysia and Sustainable Process Engineering Research centre (SPERC), Faculty of Engineering (FRGS/1/2023/TK09/UPM/01/2).
[1] Dorman, D.C. (2010). Olfactory system. In Comprehensive Toxicology. Elsevier, pp. 263-276. https://doi.org/10.1016/B978-0-08-046884-6.01316-6
[2] Mohammed, A., Devi, P. (2021). Hydrogen sulfide: Risk assessment, environmental, and health hazard. In Hazardous Gases. Academic Press, pp. 209-223. https://doi.org/https://doi.org/10.1016/B978-0-323-89857-7.00008-6
[3] Ng, P.C., Hendry-Hofer, T.B., Witeof, A.E., Brenner, M., Mahon, S.B., Boss, G.R., Haouzi, P., Bebarta, V.S. (2019). Hydrogen sulfide toxicity: Mechanism of action, clinical presentation, and countermeasure development. Journal of Medical Toxicology: Official Journal of the American College of Medical Toxicology, 15(4): 287-294. https://doi.org/10.1007/s13181-019-00710-5
[4] Skrtic, L. (2006). Hydrogen sulfide, oil and gas, and people’s health. University of California, Berkeley, pp. 1-77. https://www.oilandgasbmps.org/docs/GEN26-studyonhydrogensulfide.pdf.
[5] Siracusa, R., Voltarelli, V.A., Salinaro, A.T., Modafferi, S., Cuzzocrea, S., Calabrese, E.J., Di Paola, R., Otterbein, L.E., Calabrese, V. (2022). NO, CO and H2S: A trinacrium of bioactive gases in the brain. Biochemical Pharmacology, 202: 115122. https://doi.org/https://doi.org/10.1016/j.bcp.2022.115122
[6] Canada.ca. (2024). Hydrogen sulfide (H2S), sodium sulfide (Na(SH)) and sodium sulfide (Na2S). https://www.canada.ca/en/health-canada/services/chemical-substances/other-chemical-substances-interest/hydrogen-sulfide.html.
[7] Department of Occupational Safety and Health. (2022). Guidelines on Monitoring of Airborne Chemical Hazardous to Health 2022. Ministry of Human Resources, Malaysia. https://www.dosh.gov.my/index.php/competent-person-form/occupational-health/regulation-2-1/guidelines/chemical/4270-guidelines-on-monitoring-of-airborne-chemical-hazardous-to-health-2022-1/file.
[8] Batterman, S., Grant-Alfieri, A., Seo, S.H. (2023). Low level exposure to hydrogen sulfide: A review of emissions, community exposure, health effects, and exposure guidelines. Critical Reviews in Toxicology, 53(4): 244-295. https://doi.org/10.1080/10408444.2023.2229925
[9] Saleh, A.M., Mahdi, H.H., Alias, A.B., Hadi, N.K.A., Qarizada, D., Jawad, A.H., Saleh, N.M. (2024). Equilibrium and kinetic studies in adsorption of H2S using coconut shell activated carbon xerogel: Effect of mass adsorbent and temperature. Desalination and Water Treatment, 317: 100149. https://doi.org/10.1016/j.dwt.2024.100149
[10] Georgiadis, A.G., Charisiou, N.D., Goula, M.A. (2020). Removal of hydrogen sulfide from various industrial gases: A review of the most promising adsorbing materials. Catalysts, 10(5): 521. https://doi.org/10.3390/catal10050521
[11] Salih, M.Q., Hamadamin, R.R., Hama, J.R. (2023). Emission and exposure of hydrogen sulfide in the air from oil refinery: Spatiotemporal field monitoring. International Journal of Environmental Science and Technology, 20(5): 4727-4736. https://doi.org/10.1007/s13762-022-04309-2
[12] Bako, G. (2020). What You Need to Know About Gas Hazards in Pulp and Paper Mills. Industrial Scientific. https://www.indsci.com/en/blog/what-you-need-to-know-about-gas-hazards-in-pulp-and-paper-mills.
[13] Habeeb, O.A., Kanthasamy, R., Ali, G.A.M., Sethupathi, S., Yunus, R.B.M. (2018). Hydrogen sulfide emission sources, regulations, and removal techniques: A review. Reviews in Chemical Engineering, 34(6): 837-854. https://doi.org/10.1515/revce-2017-0004
[14] Habeeb, O.A., Olalere, O.A., Kanthasamy, R., Ayodele, B.V. (2020). Hydrogen sulfide removal from downstream wastewater using calcium-coated wood sawdust-based activated carbon. Arabian Journal for Science and Engineering, 45(2): 501-518. https://doi.org/10.1007/s13369-019-04207-9
[15] Habeeb, O.A., Ramesh, K., Ali, G.A., Yunus, R.M., Thanusha, T.K., Olalere, O.A. (2016). Modeling and optimization for H2S adsorption from wastewater using coconut shell based activated carbon. Australian Journal of Basic and Applied Sciences, 10(17): 136-147. https://core.ac.uk/download/pdf/159192409.pdf.
[16] Ren, B., Lyczko, N., Zhao, Y., Nzihou, A. (2020). Alum sludge as an efficient sorbent for hydrogen sulfide removal: Experimental, mechanisms and modeling studies. Chemosphere, 248: 126010. https://doi.org/10.1016/j.chemosphere.2020.126010
[17] Agarwal, S., Sadegh, H., Monajjemi, M., Hamdy, A.S., Ali, G.A.M., Memar, A.O.H., Shahryari-ghoshekandi, R., Tyagi, I., Gupta, V.K. (2016). Efficient removal of toxic bromothymol blue and methylene blue from wastewater by polyvinyl alcohol. Journal of Molecular Liquids, 218: 191-197. https://doi.org/10.1016/j.molliq.2016.02.060
[18] Gupta, V.K., Agarwal, S., Sadegh, H., Ali, G.A.M., Bharti, A.K., Hamdy Makhlouf, A.S. (2017). Facile route synthesis of novel graphene oxide-β-cyclodextrin nanocomposite and its application as adsorbent for removal of toxic bisphenol A from the aqueous phase. Journal of Molecular Liquids, 237: 466-472. https://doi.org/10.1016/j.molliq.2017.04.113
[19] Mahdi, H.H., Saleh, A.M., Alias, A.B., Jawad, A.H., Salman, S.D., Mostafa, M.M., Qarizada, D., Saleh, N.M., Abdulqader, M. (2024). Synthesis and characterization of xerogel derived from palm kernel shell biochar and comparison with commercial activated carbon. Journal of Ecological Engineering. 25(6): 1-11. https://doi.org/10.12911/22998993/183719
[20] Saleh, A.M., Alias, A.B., Mahdi, H.H., Jawad, A.H., Syed-Hassan, S.S.A., Saleh, N.M., Ahmed, O.K. (2024). Characterizing biochar derived from palm kernel shell biomass via slow pyrolysis for adsorption applications. NTU Journal of Renewable Energy, 6(1): 10-20. https://doi.org/10.56286/ntujre.v6i1.729
[21] Yaashikaa, P.R., Kumar, P.S., Varjani, S., Saravanan, A. (2020). A critical review on the biochar production techniques, characterization, stability and applications for circular bioeconomy. Biotechnology Reports, 28: e00570. https://doi.org/10.1016/j.btre.2020.e00570
[22] Ghanbarpour Mamaghani, Z., Hawboldt, K.A., MacQuarrie, S. (2023). Adsorption of CO2 using biochar - Review of the impact of gas mixtures and water on adsorption. Journal of Environmental Chemical Engineering, 11(3): 109643. https://doi.org/10.1016/j.jece.2023.109643
[23] Izhar, T.N.T., Kee, G.Z., Saad, F.N.M., Rahim, S.Z.A., Zakarya, I.A., Besom, M.R.C., Ibad, M., Syafiuddin, A. (2022). Adsorption of hydrogen sulfide (H2S) from municipal solid waste by using biochars. Biointerface Research in Applied Chemistry, 12(6): 8057-8069. https://doi.org/10.33263/BRIAC126.80578069
[24] Srivastava, N., Richa, Roy Choudhury, A. (2021). Recent advances in composite hydrogels prepared solely from polysaccharides. Colloids and Surfaces B: Biointerfaces, 205: 111891. https://doi.org/10.1016/j.colsurfb.2021.111891
[25] dos Santos, L.M., Bernard, F.L., Pinto, I.S., Scholer, H., Dias, G.G., Prado, M., Einloft, S. (2019). Polyurethane /ionic silica xerogel composites for CO2 capture. Materials Research, 22: 1-8. https://doi.org/10.1590/1980-5373-MR-2019-0022
[26] Mohamad Said, K.A., Mohamed Amin, M.A. (2016). Overview on the response surface methodology (RSM) in extraction processes. Journal of Applied Science & Process Engineering, 2(1). https://doi.org/10.33736/jaspe.161.2015
[27] Agha, H.M., Abdulhameed, A.S., Jawad, A.H., Aazmi, S., Sidik, N.J., De Luna, Y., Wilson, L.D., ALOthman, Z.A., Algburi, S. (2024). Enhancing cationic dye removal via biocomposite formation between chitosan and food grade algae: Optimization of algae loading and adsorption parameters. International Journal of Biological Macromolecules, 258(P1): 128792. https://doi.org/10.1016/j.ijbiomac.2023.128792
[28] Hannachi, Y., Hafidh, A., Ayed, S. (2019). Effectiveness of novel xerogels adsorbents for cadmium uptake from aqueous solution in batch and column modes: Synthesis, characterization, equilibrium, and mechanism analysis. Chemical Engineering Research and Design, 143: 11-23. https://doi.org/10.1016/j.cherd.2019.01.006
[29] Çok, S.S., Koç, F., Balkan, F., Gizli, N. (2019). Exploring a new preparation pathway for the synthesis of silica based xerogels as crack-free monoliths. Ceramics International, 45(2): 1616-1626. https://doi.org/10.1016/j.ceramint.2018.10.038
[30] Rodríguez-Dorado, R., López-Iglesias, C., García-González, C.A., Auriemma, G., Aquino, R.P., Del Gaudio, P. (2019). Design of aerogels, cryogels and xerogels of alginate: Effect of molecular weight, gelation conditions and drying method on particles’ micromeritics. Molecules, 24(6): 4-6. https://doi.org/10.3390/molecules24061049
[31] Imoisili, P.E., Ukoba, K.O., Jen, T.C. (2020). Synthesis and characterization of amorphous mesoporous silica from palm kernel shell ash. Boletin de La Sociedad Espanola de Ceramica y Vidrio, 59(4): 159-164. https://doi.org/10.1016/j.bsecv.2019.09.006
[32] Januszewicz, K., Kazimierski, P., Klein, M., Kardaś, D., Łuczak, J. (2020). Activated carbon produced by pyrolysis of waste wood and straw for potential wastewater adsorption. Materials, 13(9): 1-13. https://doi.org/10.3390/MA13092047
[33] Li, M., Wang, Y., Liu, Y., Wang, H., Song, H. (2022). Preparation of active carbon through one-step NaOH activation of coconut shell biomass for phenolic wastewater treatment. Research on Chemical Intermediates, 48(4): 1665-1684. https://doi.org/10.1007/s11164-021-04650-0
[34] Zaini, M.S.M., Arshad, M., Syed-Hassan, S.S.A. (2023). Adsorption isotherm and kinetic study of methane on palm kernel shell-derived activated carbon. Journal of Bioresources and Bioproducts, 8(1): 66-77. https://doi.org/10.1016/j.jobab.2022.11.002
[35] Georgiadis, A.G., Charisiou, N.D., Gaber, S., Polychronopoulou, K., Yentekakis, I.V., Goula, M.A. (2021). Adsorption of hydrogen sulfide at low temperatures using an industrial molecular sieve: An experimental and theoretical study. ACS Omega, 6(23): 14774-14787. https://doi.org/10.1021/acsomega.0c06157
[36] Mahmood Aljamali, N., Abdul Baqi Aldujaili, D., Obaid Alfatlawi, I. (2021). Physical and chemical adsorption and its applications. International Journal, 7(2): 1-8. https://doi.org/10.37628/IJTCK
[37] Raimondo, S.L. (2012). Structured zeolite adsorbents for CO2 separation. University of Technology Luleå, Sweden.
[38] De Witte, N., Denayer, J.F.M., Van Assche, T.R.C. (2021). Effect of adsorption duration and purge flowrate on pressure swing adsorption performance. Industrial & Engineering Chemistry Research, 60(37): 13684-13691. https://doi.org/10.1021/acs.iecr.1c02291
[39] Zulkefli, N.N., Noor Azam, A.M.I., Masdar, M.S., Isahak, W.N.R.W. (2023). Adsorption-desorption behavior of hydrogen sulfide capture on a modified activated carbon surface. Materials, 16(1): 462. https://doi.org/10.3390/ma16010462
[40] Verner, A., Tokarský, J., Najser, T., Matějová, L., Kutláková, K.M., Kielar, J., Peer, V. (2023). Effects of structure and composition of adsorbents on competitive adsorption of gaseous emissions: Experiment and modeling. Nanomaterials, 13(4): 724. https://doi.org/10.3390/nano13040724