Mohammad Takey Elias Kassim![]() | Emad Toma Karash*
| Emad Toma Karash*![]() | Ahmmad M. Mahmood
| Ahmmad M. Mahmood![]() | Jamal Nayief Sultan
| Jamal Nayief Sultan![]()
© 2024 The authors. This article is published by IIETA and is licensed under the CC BY 4.0 license (http://creativecommons.org/licenses/by/4.0/).
OPEN ACCESS
Models for the mechanical testing must be created, and they must be processed at a high cost and take a very long time to finish. for bending, pulling, impact resistance, and other tests. to establish suitable mechanical standards for the application of these materials in the industrial, military, and aviation sectors. In order to gather information on these materials' resistance without requiring specialized laboratories, it was therefore required to test them using specific software, which lowers the expense associated with studying the materials before using them. To use computer simulation to research the impact of nc-TiN coating on the mechanical characteristics of stainless steel 121810T. Finite element models of uncoated and nc-TiN coated stainless steel 12Х18Н10Т were developed. Tensile, bending and impact tests were simulated using the ANSYS program. The coated models showed increased resistance compared to uncoated models in all three tests. The tensile strength, bending force and impact energy of the coated models increased by 30%, 32.67%., and 31.68% respectively. Finite element simulation demonstrated that nc-TiN coating can significantly enhance the mechanical properties of stainless steel 12Х18Н10Т. The virtual testing approach provides a cost-effective way to characterize materials and optimize coating parameters. The most important outcome of this study is the ability of numerical programs to generate mathematical models of models similar to those used in laboratories and workshops to perform various mechanical tests, such as tensile strength, impact resistance, bending resistance, twisting resistance, and other mechanical tests. In addition to describing the behavior of the material under the influence of different loads, this shortens the time it takes to finish industrial and technological projects and lowers the related expenses.
stainless steel 12Х18Н10Т, nc-TiN coating, finite element modeling, tensile test, bending test, impact test, mechanical properties
Metal engineering materials frequently experience catastrophic failure as a result of wear, fatigue, corrosion, high speed, and overload. Surface Nano crystallization (SNC) of metallic materials was first described by Lu and Lu [1] who also noted that the surface qualities have a significant impact on how well metal materials perform. As more knowledge is gained about the types of damage that might occur and the factors that lead to them. Manufacturing procedures for parts and control techniques improve, making it easier to stop more damage of this kind [2]. For the purpose of identifying the source of a leak identified during the aircraft's preflight preparations, a steel pipeline 12X18H10T with a wall thickness of 1.20 mm was examined. Aircraft hydraulic system components are extremely prone to acquiring a number of defects that cause the hydraulic system to malfunction and fail. Since to the large vibration loads and abrupt pressure and temperature fluctuations that are applied to these components during operation [3]. Applying multi-element ion-plasma coatings is one way to solve a variety of issues where the part's surface characteristics are critical because they permit large changes in the surface's physical and mechanical qualities. At the moment, single-phase coatings made of titanium nitrides and a few other metals are the most popular [4-10]. In parallel, research has started on multi-element coatings, which have a variety of special qualities that cannot be attained by conventional metallurgical techniques [11-14]. This type of steel is not susceptible to local types of corrosion when alloyed with nitrogen, or when alloyed with nitrogen and molybdenum together [15, 16]. Surface modification techniques using high energy have shown promise [17-19]. A more thorough investigation is necessary, however, to fully understand the impact of nitrogen-ion implantation on the surface of 12X18N10T steel [20]. When steels are deformed at high temperatures, it may be assumed that a high martensite content will result in greater deformation. In the past, studies [21, 22] examined the super plasticity of the transition using Co-Ni-Nb alloy. In this work, we study the structural-phase state and high-temperature deformation of steel 12Kh18N10T, which have unique physical properties. The goal of this research is to examine how steel behaves in its structural phase both before and after plastic deformation occurs at high temperatures [23]. Numerous studies, including those [24-28], employed the ANSYS 15.0 program to study the stresses, strains, and deformation the material undergoes during the loading process.
In order to achieve this objective, it is required to do the following: Analyze the stresses, strains and deformations that occur before and after the coating process, and these stresses are under the influence of three types of loads, tension load, compressive load, and impact load, and then compare the results that will be obtained. It has to design models made of Steel 12X18H10T before coating, and other models made of the same material, but after coating it with titanium nitrate. The goal of this article is to investigate the effects of nc-TiN coating on the mechanical behavior of stainless steel 12Х18Н10Т under different loading conditions through finite element simulation.
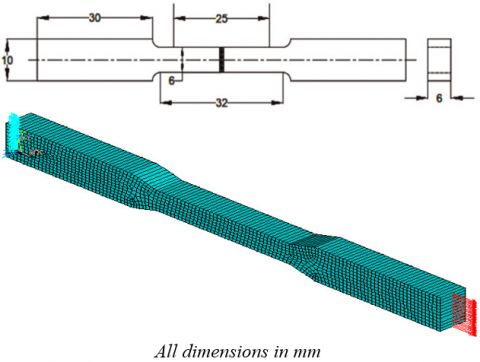
There were built six mathematical models: the first and second models for tensile testing, the third and fourth models for bending tests, and the fifth and sixth models for impact tests. The shape and dimensions of these models are shown in Figure 1. The material for this study was austenitic steel 12H18N10T (also known as AISI 321). Table 1 and Table 2 list its chemical composition of the Steel 12X18H10T and mechanical characteristics, respectively.
Table 1. Composition of Steel 12X18H10T [29-33]
|
NO. |
Element |
Wt % |
|
|
Standard Steel 12Х18Н10Т |
Steel 12Х18Н10Т |
||
|
1 |
Si |
≤0.8 |
0.24 |
|
3 |
Mn |
≤2.0 |
1.16 |
|
4 |
C |
≤0.12 |
0.06 |
|
5 |
Ni |
9.0 – 11.0 |
10.50 |
|
6 |
Ti |
0.5 – 0.7 |
0.55 |
|
7 |
Cr |
17.0 – 19.0 |
17.35 |
|
8 |
Fe |
Rem. |
70.14 |
Figure 1. Dimensions of the ASTM E8 standard tensile test specimen [33]
Table 2. Mechanical and physical properties of Steel 12X18H10T [29-33]
|
Property |
Modulus of Elasticity E, GPa |
Modulus of Rigidity G, GPa |
Density ρ, Kg/m3 |
Poisons Ratio µ |
|
Steel 12X18H10T Standard |
190 - 210 |
80 |
7870 |
0.3 |
|
Steel 12X18H10T Before coating |
205 |
79 |
7870 |
0.3 |
|
Steel 12X18H10T After coating |
300 |
119 |
9440 |
0.26 |
|
Tool (Tungsten Carbide) |
534 |
219 |
11900 |
0.22 |
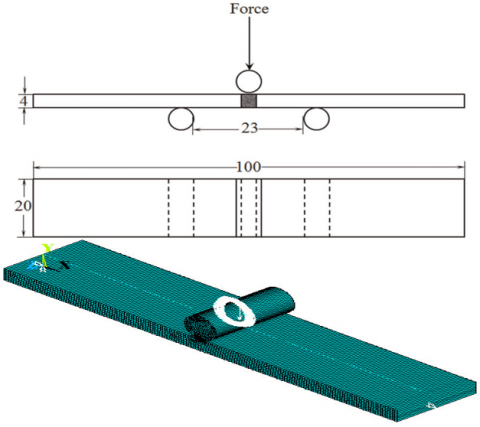
Figure 2. Three-point bend test configuration diagram [33]
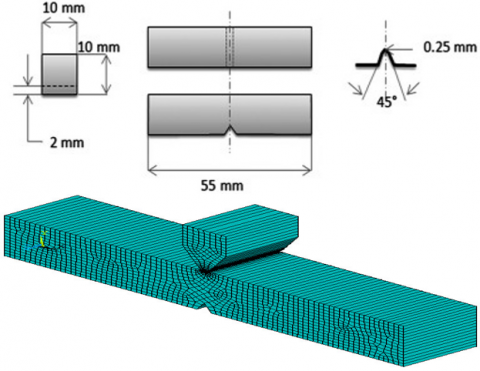
Figure 3. Charpy V-notch specimen proportions according to ASTM E23 [3]
Table 3. Describe the mechanical properties of all models
|
Model |
Materials |
Density $\rho$, (Kg/m3) |
Modulus of Elasticity E, (GPa) |
Modulus of Rigidity G, (GPa) |
Passion’s Ratio µ |
|
M.-1 |
Steel 12X18H10T after coating |
7870 |
205 |
79 |
0.3 |
|
M.-2 |
Steel 12X18H10T before coating |
9440 |
300 |
118 |
0.27 |
|
M.-3 |
Steel 12X18H10T after coating |
7870 |
205 |
79 |
0.3 |
|
M.-4 |
Steel 12X18H10T before coating |
9440 |
300 |
118 |
0.27 |
|
M.-5 |
Steel 12X18H10T after coating |
7870 |
205 |
79 |
0.3 |
|
M.-6 |
Steel 12X18H10T before coating |
9440 |
300 |
118 |
0.27 |
Table 4. A list of the elements, forms, load types, and materials used in the ANSYS program
|
Material |
Model |
Shape |
Individual Disciplines |
Type of Element |
Applied Load |
|
M.-1 |
Isotropic |
Structural |
SHELL 8 node 183 |
200 Kw |
|
|
M.-2 |
200 Kw |
||||
|
M.-3 |
200 Kw |
||||
|
M.-4 |
200 Kw |
||||
|
M.-5 |
298.5 Joule |
||||
|
M.-6 |
298.5 Joule |
Six models were created for this investigation, including two for tensile strength testing (one before coating, the other after coating), Figure 2, two for impact tests (one before coating, the other after coating), Figure 1, and two for impact tests (one before coating, the other after coating), then, Figure 3 using the ANSYS 15.0 program, apply loads to them to analyze the effects of stresses, strains, and deformation that these models experience when loaded. Table 3 describe the mechanical properties of all models and Table 4 list the elements, forms, load types, and materials.
4.1 Tensile test
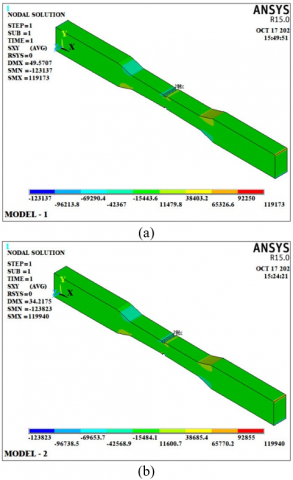
The tensile test specimen can be made in a variety of shapes, but if the thickness of the material being tested permits, the specimen with a rectangle or rectangular cross-section is chosen. The distance that establishes the sample's length to gauge its elongation in respect to it is referred to as the "length gauge" in this context. The material being tested and the technique used to secure it inside the test machine both affect how the sample's ends are shaped. The middle is not always affected by a section smaller than the stresses of the clamps. The sample's ends can be threaded or shouldered. Following the application of a load (200 KN) to the models using the ANSYS 15.0 program, the results of simulation tensile tests on the models are shown in Figures 4-10.
The results of the tensile tests performed on steel models both before and after coating show that: The coated models had less deformation than the untreated models by a percentage of (30.97). In the direction of the x-axis, the maximum strain ratio (εx) decreased by (30.05). The maximum shear strain ratio (εxy), on the other hand, went down by a percentage (36.81%). Nonetheless, there was a (31.35%) decreased in the percentage of the maximal stress intensity (εint).
Figure 4. The deformation for a tensile test: a) The first model (M.-1); and b) The second model (M.-2)
Figure 5. The normal stress (σx) for a tensile test: a) The first model (M.-1); and b) The second model (M.-2)
Figure 6. The shear stress (τxy) for a tensile test: a) The first model (M.-1); and b) The second model (M.-2)
Figure 7. The intensity stress (σint.) for a tensile test: a) The first model (M.-1); and b) The second model (M.-2)
Figure 8. The normal strain (εx) for a tensile test: a) The first model (M.-1); and b) The second model (M.-2)
Figure 9. Results of tensile test, shear strain (εxy) for: a) The first model (M.-1); and b) The second model (M.-2)
Figure 10. Results of tensile test, von mises total mechanical strain (εint.) for: a) The first model (M.-1); and b) The second model (M.-2)
4.2 Bending test
The bending strength test, which measures a material's resistance to deformation under the influence of a load applied to it, has grown in importance in manufacturing operations, research, and development due to the growing demand for high quality materials and requirements. A good image of the elastic modulus of bending, bending stress, and bending strain is provided by the material that was put through this test. The strength and brittleness of metal components and weld connections are assessed using the bending test. A test specimen is punctured halfway through a mandrel, creating a concave surface with a radius of curvature. The convex surface of the twisted specimen is then examined for any flaws or fissures. Bending testing allows for the possibility of faults at their source, determines their nature, and provides data on the size and concentration of defects brought on by pores, cracks, contractures, insufficient penetration, or inclusions. The sample's typical dimensions are depicted in the Figure 2.
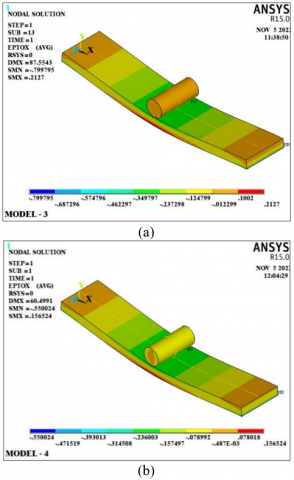
The results of the bending tests for the coated and uncoated steel models in Figures 11-19 show that the coated steel had improved resistance, as the bending resistance increased for the coated steel models under the influence of the bending load compared to the uncoated steel models by (30.9%). The normal stress resistance (σy) for the painted models improved by (3.1%), As for the normal strain resistance (εy), it increased by (32.67%) for the coated steel models over the uncoated steel models.
Figure 11. Results of bending test, deformed and unreformed for: a) The third model (M.-3); b) The fourth model (M.-4)
Figure 12. Results of bending test, deformation in direction y-axis, for: a) The third model (M.-3); and b) The fourth model (M.-4)
Figure 13. Results of bending test, displacement vector sum, for: a) The third model (M.-3); and b) The fourth model (M.-4)
Figure 14. Results of bending test, stress in direction x-axis (σx), for: a) The third model (M.-3); and b) The fourth model (M.-4)
Figure 15. Results of bending test, stress in direction y-axis (σy), for: a) The third model (M.-3); and b) The fourth model (M.-4)
Figure 16. Results of bending test, intensity stress (σint.), for: a) The third model (M.-3); and b) The fourth model (M.-4)
Figure 17. Results of bending test, strain in direction x-axis (εx), for: a) The third model (M.-3); and b) The fourth model (M.-4)
Figure 18. Results of bending test, strain in direction y-axis (εy), for: a) The third model (M.-3); and b) The fourth model (M.-4)
Figure 19. Results of bending test, intensity strain (εint.), for: a) The third model (M.-3); and b) The fourth model (M.-4)
In order to compare of the behavior of the deformation, stresses, and strains that the models test when they are subjected to the impact load, the horizontal and vertical paths that were selected are shown in Figure 20.
Figure 20. The selected horizontal path for the bending test
Figure 21a shows a comparison between the deformation resistance of the coated and uncoated steel models, from the beginning of the model to its end (Path (A-B)), and that the highest deformation was in the middle of the samples, and its value was (87.5543 mm) in the uncoated model, while its value was in the uncoated model. The lower plated amounted to (60.4991 mm). Figure 21b shows the normal stress distribution for the same path, and it is evident from the distribution of normal stresses (σx) that the uncoated model's value at the center of the models reached (44527 MPa), while the coated model's value increased to (47728 MPa).
The distribution of normal stress (σy) over the same path is shown in Figure 22a, and it is evident from the distribution of stresses that the uncoated model had a value of (3079 MPa) in the middle of the models while the coated model had a lower value of (2881 MPa). The distribution of maximum stress intensity values is shown in Figure 22b, with the uncoated model's value for the middle of the track equal (44541 MPa) and the coated model's value for the middle of the track equal (47744 MPa).
Comparing the normal strain values (εy) for coated and uncoated steel models for the same track is shown in Figure 23a. Its value was (0.050142 mm) in the uncoated sample and (0.033354 mm) in the coated sample. Figure 23b shows a comparison between the strain intensity values (0.28245 mm) in the middle of the track for the uncoated model, while its value for the coated model was lower and amounted to (0.20212 mm).
Figure 21. Comparing bending test results on the horizontal path: a) Deformation (Uy); and b) Normal stress (σx)
Figure 22. Comparing bending test results on the horizontal path: a) Normal stress (σy); and b) Intensity stress (σint.)
Figure 23. Comparing bending test results on the horizontal path: a) Normal stress (εy); and b) Intensity stress (εint.)
4.3 Impact test
The purpose of the impact test is to establish the metal's strength, which is defined as its resistance to fracture under abrupt loads. This test is not appropriate for soft metals because it can simply and precisely see and compute this property. For this test, samples of a uniform standard shape are utilized, and one of their sides has a notch in the center of it. The sample's typical dimensions are depicted in the Figure 3.
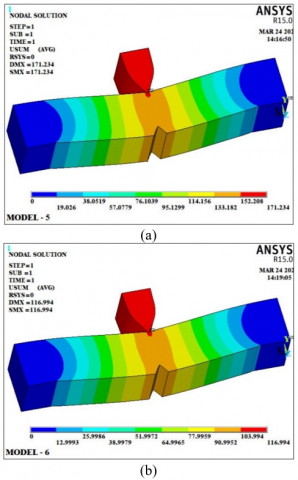
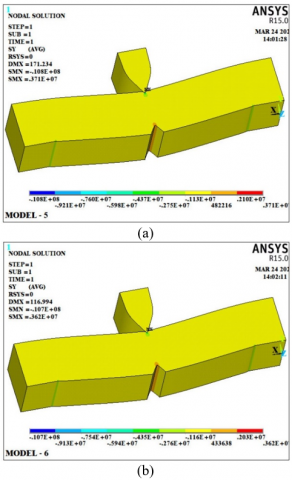
Results of testing on impact resistance are shown in Figures 24-32. According to the results, the coated models impact resistance increased by (31.68%) when compared to the untreated counterparts. Among other results, it appears that the coated models intensity strain increased (31.32%) when compared to the uncoated models.
Figure 24. Results of impact test, deformed and unreformed for: a) The fifth model (M.-5); and b) The sixth model (M.-6)
Figure 25. Results of impact test, deformation in direction y-axis, for: a) The fifth model (M.-5); and b) The sixth model (M.-6)
Figure 26. Results of impact test, displacement vector sum, for: a) The fifth model (M.-5); and b) The sixth model (M.-6)
Figure 27. Results of impact test, stress in direction x-axis (σx), for: a) The fifth model (M.-5); and b) The sixth model (M.-6)
Figure 28. Results of impact test, stress in direction y-axis (σy), for: a) The fifth model (M.-5); and b) The sixth model (M.-6)
Figure 29. Results of impact test, intensity stress (σint.), for: a) The fifth model (M.-5); and b) The sixth model (M.-6)
Figure 30. Results of impact test, first principal stress (σ1), for: a) The fifth model (M.-5); and b) The sixth model (M.-6)
Figure 31. Results of impact test, second principal stress (σ2), for: a) The fifth model (M.-5); and b) The sixth model (M.-6)
Figure 32. Results of impact test, intensity strain (εint.), for: a) The fifth model; and b) The sixth model
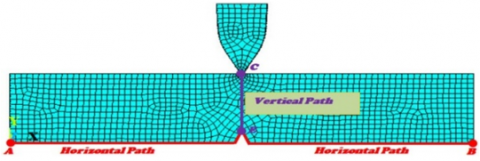
In order to compare the deformation, stresses, and strains that the models experience when they are subjected to the identical impact load, the horizontal and vertical paths that were selected are shown in Figure 33.
Figure 33. The selected horizontal and vertical paths for impact test
Figures 34-37 compare the deformations, stresses, and strains that the models underwent in response to the impact load. Additionally, the degree to which these models were resistant to stresses on the two paths that were selected: The first path is horizontal (A - B), and the second path is vertical (C-E).
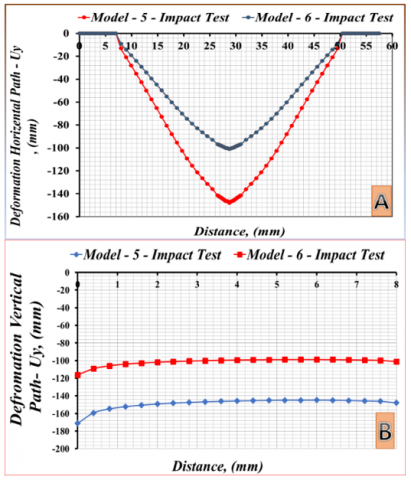
Figure 34a compares how the (Uy) alloy steel deforms under the influence of an impact load before and after coating. It is obvious from the figure that, on the horizontal track (AB), the coated models deformation resistance increased by (31.23%), compared to the uncoated models. in particular at (E).
Figure 34b compares the deformation (Uy) on the vertical path (CE), and the results reveal that the coated models are more resistant to deformation than the uncoated models, as seen by the (19.86%) increase in point (E).
Figure 35a compares the steel alloy normal stress (σy) under the impact load before and after coating. The figure makes it evident that whereas the normal stress in the uncoated models was (1.06 MPa), it had a value of (1.0579 MPa) in the coated models. This demonstrates a very slight (0.2%) reduction in normal stress in the coated samples compared to the uncoated samples on the horizontal path (AB), notably at point (E).
In Figure 35b, the normal stress (σy) of the steel alloy before and after coating, as affected by the impact load, are compared. The figure makes it evident that the value of the normal stress in uncoated models is (2.53 MPa), but it is (1.0579 MPa) in coated models. On the vertical path (CE), in particular at point (E), it can be seen that the coated samples had a very high (58.19%) reduction in normal stress compared to the uncoated samples.
Figure 36a compares the steel alloy's stress intensity (σint.) under the influence of an impact load before and after coating. The figure clearly shows that the stress intensity in the uncoated models is equal to the stress intensity in coated models. On the horizontal path (AB), at point (E), with a value of (2.54 MPa).
The stress intensity (σint.) of the identical alloy before and after coating as a result of the impact load is compared in Figure 36b. The figure demonstrates with clarity that the stress intensity in coated models is equivalent to that in uncoated models, with a value of (2.54 MPa) at point (E) on the vertical track (CE).
In Figure 37a, the normal strain (εy) under impact of alloy steel before and after coating is contrasted. The figure clearly shows that the normal strain was 2.5635 in the uncoated models (Model-5) on the horizontal path (AB) at point (E), whereas it was 1.2691 mm in the coated models (Model-6).
The normal strain (εy) of steel ingots under shock load is compared in Figure 37b before and after coating on the ingot. The figure makes it evident that the uncoated models (Models 5) on the horizontal path (CE) at point (E) experienced normal strain equal to that of the uncoated models (Models 6), with a value of 1.3278.
Figures 38a and 38b show the strain intensity (εint.) of alloy steel before and after the coating process under the influence of impact strength.
Figure 34. Comparison of the deformation results (Uy): a) on the horizontal path; and b) on the vertical path
Figure 35. Results of the comparison of normal stress (σy): a) along the horizontal path; and b) along the vertical path
Figure 36. Results of the intensity stress (σint.) comparison: a) along the horizontal path; and b) along the vertical path
Figure 37. Comparison of the Normal strain (εy) results: a) on the horizontal path; and b) on the vertical path
Figure 38. Comparison of the Intensity strain (εint.) results: a) on the horizontal path; and b) on the vertical path
In the uncoated models (Model 5) on the horizontal path (AB) and the vertical path (CE) at point (E), the strain intensity was 16.08; however, in the coated models (Model 6), at the same point and on the horizontal and vertical paths, the strain intensity was decreased to 10.68.
Due to the deformation, strains, and stresses that the models are subjected to during this test, the results of the tensile strength examination tests for the coated and uncoated models show a significant improvement in the tensile strength, and this percentage may even exceed 30%.
The results of the bending tests for coated and uncoated steel models showed that coated steel had improved resistance since the bending resistance of coated steel models rose under the impact of the bending load by (30.9%) in comparison to uncoated steel models. The coated models normal stress resistance (σy) increased by 3.1%, while the coated steel models normal strain resistance (εy) increased above the uncoated steel models by 32.67%.
The impact resistance of the coated models increased by (31.68%) in comparison to their treatment counterparts, as evidenced by the testing results on impact resistance. Among additional results, it seems that the intensity strain of the coated models increased (31.32%) when compared to the uncoated ones.
The most significant result of this research is that mathematical models of models similar to those used in laboratories and workshops to perform various mechanical tests, such as tensile strength, impact resistance, bending resistance, twisting resistance, and other mechanical tests, can be created using numerical programs. In addition to defining the behavior of the material under the effect of various loads, this results in a reduction in both the time it takes to complete industrial and technical projects and the associated financial costs.
In addition to determining how the material behaves when subjected to various loads. By being aware of all the deformations, stresses, and strains that this engineering material is subject to, that can improve safety in industrial settings as well as in industries like aviation, shipbuilding, construction, and others.
The researchers suggest developing various mathematical models for various engineering materials, such as magnesium alloys used in the medical industry, composite materials, and aluminum alloys. They also suggest examining the effects of various loads on engineering materials in daily life. resisting impact loads, twisting loads, tensile and compression loads, torsion and fatigue loads, thermal loads, and other loads. Determine the deformations, stresses, and strains they are subjected to during loading by carefully examining them using cutting-edge engineering software, such as the ANSYS program.
|
δ |
Deformed and unreformed |
|
Ux |
Component of the displacement (x-direction) |
|
Uy |
Component of the displacement (y-direction) |
|
Uz |
Component of the displacement (z-direction) |
|
σx |
Normal stress |
|
τxy |
Shear stress |
|
σint. |
Stress intensity |
|
σvon |
Von mises stress |
|
εx |
Normal strain (x-direction) |
|
εxzy |
Shear strain (xy-direction) |
|
εxz |
Shear strain (xz-direction) |
|
εfirst |
First principal elastic strain |
|
εthird |
Third principal elastic strain |
|
εintensty |
Elastic strain intensity |
|
εvon |
Von Mises elastic strain |
|
Greek symbols |
|
|
E |
Modulus of elasticity |
|
ρ |
Density |
|
G |
Modulus of rigidity |
|
µ |
Passions ratio |
|
Subscripts |
|
|
SNC |
Surface Nano Crystallization |
|
Si |
Silicone |
|
Mn |
Manganese |
|
C |
Carbon |
|
Ni |
Nickel |
|
Ti |
Titanium |
|
Cr |
Chrome |
|
Fe |
Iron |
[1] Lu, K., Lu, J. (1999). Surface nanocrystallization (SNC) of metallic materials-presentation of the concept behind a new approach. Journal of Materials Science and Technology, 15(3): 193-197.
[2] Tymoshenko, G., Anishchenko, D. (2019). Promising method of repair of aircraft pipelines with minor operational damage. Materials of the IX All-Russian Scientific and Technical Conference with international participation, pp. 149-153.
[3] Barbosa, A.Q., Da Silva, L.F.M., Öchsner, A., Abenojar, J., del Real, J.C. (2012). Influence of the size and amount of cork particles on the impact toughness of a structural adhesive. The Journal of Adhesion, 88(4-6): 452-470. https://doi.org/10.1080/00218464.2012.660811
[4] Eremin, E.N., Yurov, V.M., Guchenko, S.A., Syzdykova, A.S. (2015). Structure and properties of steel coatings doped with aluminum. Eurasian Physical Technical Journal, 12(2): 24.
[5] Liu, R., Li, X., Hu, X., Dong, H. (2013). Surface modification of a medical grade Co-Cr-Mo alloy by low-temperature plasma surface alloying with nitrogen and carbon. Surface and Coatings Technology, 232: 906-911. https://doi.org/10.1016/j.surfcoat.2013.06.122
[6] Barshilia, H.C., Jain, A., Rajam, K.S. (2003). Structure, hardness and thermal stability of nanolayered TiN/CrN multilayer coatings. Vacuum, 72(3): 241-248. https://doi.org/10.1016/j.vacuum.2003.08.003
[7] Ahlgren, M., Blomqvist, H. (2005). Influence of bias variation on residual stress and texture in TiAlN PVD coatings. Surface and Coatings Technology, 200(1-4): 157-160. https://doi.org/10.1016/j.surfcoat.2005.02.078
[8] Li, X., Li, C., Zhang, Y., Tang, H., Li, G., Mo, C. (2010). Tribological properties of the Ti–Al–N thin films with different components fabricated by double-targeted co-sputtering. Applied Surface Science, 256(13): 4272-4279. https://doi.org/10.1016/j.apsusc.2010.02.014
[9] Castillejo, F.E., Marulanda, D.M., Olaya, J.J., Alfonso, J.E. (2014). Wear and corrosion resistance of niobium–chromium carbide coatings on AISI D2 produced through TRD. Surface and Coatings Technology, 254: 104-111. https://doi.org/10.1016/j.surfcoat.2014.05.069
[10] Lee, Y.J., Lee, T.H., Kim, D.Y., Nersisyan, H.H., Han, M.H., Kang, K.S., Bae, K.K., Shin, Y.J., Lee, J.H. (2013). Microstructural and corrosion characteristics of tantalum coatings prepared by molten salt electrodeposition. Surface and Coatings Technology, 235: 819-826. https://doi.org/10.1016/j.surfcoat.2013.09.007
[11] Martin, P.J., Bendavid, A., Cairney, J.M., Hoffman, M. (2005). Nanocomposite Ti-S-N, Zr-S-N, TiAlSi-N, Ti-Al-V-Si thin film coatings deposited by vacuum arc deposition. Surface and Coatings Technology, 200(7): 2228-2235. https://doi.org/10.1016/j.surfcoat.2004.06.012
[12] Yeh, J.W., Chen, S.K., Lin, S.J., Gan, J.Y., Chin, T.S., Shun, T.T., Tsau, C.H., Chang, S.Y. (2004). Nanostructured high‐entropy alloys with multiple principal elements: Novel alloy design concepts and outcomes. Advanced Engineering Materials, 6(5): 299-303. https://doi.org/10.1002/adem.200300567
[13] Cantor, B., Chang, I.T.H., Knight, P., Vincent, A.J.B. (2004). Microstructural development in equiatomic multicomponent alloys. Materials Science and Engineering: A, 375: 213-218. https://doi.org/10.1016/j.msea.2003.10.257
[14] Tsai, M.H., Yeh, J.W. (2014). High-entropy alloys: A critical review. Materials Research Letters, 2(3): 107-123. https://doi.org/10.1080/21663831.2014.912690
[15] Pisarevskii, L.A., Golovanenko, S.A. (1986). Nonmagnetic and little-magnetic steels for high-strength cables and wires. In: Structure and Physicomechanical Properties of Nonmagnetic Steels [in Russian], Nauka, Moscow, pp. 40-45.
[16] Mushnikova, S.Y., Kostina, M.V., Andreev, C.A., Zhekova, L.T. (2009). Effect of the structure and phase composition on the pitting corrosion resistance of the Cr – N steels with over equilibrium nitrogen content. In: Proceedings of 10-th International Conference on High Nitrogen Steels, MISiS, Moscow, pp. 300-305.
[17] Duriagina, Z. (2009). The influence condition of laser alloying on the properties of the layer surface 12X18H10T steel. In 4-th PhD Students and Young Scientists Conference, Warsaw, Poland, pp. 11-15.
[18] Duryagina, Z.A. (2011). Effect of laser alloying from powder mixtures on the structure and micromechanical properties of 12X18N10T steel. Metallophysics and New Technologies, 33(7): 969-975.
[19] Duryagina, Z.A., Shcherbovskikh, N.V., Bespalov, S.A. (2011). The effect of laser alloying by powder mixtures on the structure and micromechanical properties of 12X18H10T steel. Metallofizika i Noveishie Tekhnologii, 33(7): 969-975.
[20] Duryagina, Z.A. (2011). The influence of nitrogen ion implantation regimes on the structure of the surface layers of corrosion-resistant steels. New materials and technologies: Bulletin of the National University, Lviv Polytechnic, pp. 92-95.
[21] Tussupzhanov, A.E., Yerbolatuly, D., Kveglis, L.I., Nemcev, I.V. (2015). The study of the flow stress during superplastic deformation Co-Ni-Nb alloy. Journal of Siberian Federal University. Engineering & Technologies, 8(6): 802-810.
[22] Tussupzhanov, A., Yerbolatuly, D., Kveglis, L.I., Filarowski, A. (2017). Investigation of structural-phase states and features of plastic deformation of the austenitic precipitation-hardening Co-Ni-Nb alloy. Metals, 8(1): 19. https://doi.org/10.3390/met8010019
[23] Novikov, I.I., Roshchupkin, V.V., Lyakhovitskii, M.M., Pokrasin, M.A., Minina, N.A., Chernov, A.I., Sobol’, N.L., Kol’tsov, A.G., Klimenko, S.A. (2014). Investigation of the acoustic properties of zirconium. Inorganic Materials: Applied Research, 5: 184-188. https://doi.org/10.1134/S2075113314020142
[24] Najem, M.K., Karash, E.T., Sultan, J.N. (2022). The amount of excess weight from the design of an armored vehicle body by using composite materials instead of steel. Revue des Composites et des Materiaux Avances, 32(1): 1-10. https://doi.org/10.18280/rcma.320101
[25] Karash, E.T., Sultan, J.N., Najem, M.K. (2022). The difference in the wall thickness of the helicopter structure are made of composite materials with another made of steel. Mathematical Modelling of Engineering Problems, 9(2): 313-324. https://doi.org/10.18280/mmep.090204
[26] Karash, E.T. (2011). Modelling of unilateral contact of metal and fiberglass shells. Applied Mechanics and Materials, 87: 206-208. https://doi.org/10.4028/www.scientific.net/AMM.87.206
[27] Karash, E.T., Alsttar Sediqer, T.A., Elias Kassim, M.T. (2021). A comparison between a solid block made of concrete and others made of different composite materials. Revue des Composites et des Matériaux Avancés-Journal of Composite and Advanced Materials, 31(6): 341-347. https://doi.org/10.18280/RCMA.310605
[28] Najim, M., Sultan, J., Karash, E. (2020). Comparison of the resistance of soild shell of composite materials with other soild metal Materials. In Proceedings of the 1st International Multi-Disciplinary Conference Theme: Sustainable Development and Smart Planning, pp. 28-30. https://doi.org/10.4108/eai.28-6-2020.2298518
[29] Kameneva, A.L., Minkova, A.A., Cherkashneva, N.N., Karmanov, V.V. (2018). Correlation between heat treatment process parameters, phase composition, texture, and mechanical properties of 12H18N10T stainless steel processed by selective laser melting. In IOP Conference Series: Materials Science and Engineering, 447(1): 012043. https://doi.org/10.1088/1757-899X/447/1/012043
[30] Osipok, T., Zaides, S., Nguyen, H. (2020). Determination of aircraft hydraulic system pipeline leak cause. In International Conference on Modern Trends in Manufacturing Technologies and Equipment: Mechanical Engineering and Materials Science (ICMTMTE 2020), 329: 03078. https://doi.org/10.1051/matecconf/202032903078
[31] Pohrebniak, O.D., Mahmud, A.M., Karasha, I.T., Kirik, G.V., Tkachenko, R.Y., Shypylenko, A.P. (2011). Structure аnd physical-mechanical properties of nc-TiN coatings obtained by vacuum-arc deposition and deposition with HF discharge. Journal of Nano- and Electronic Physics, 3(4): 73-80.
[32] Logan, H.L. (1951). Effect of chromium plating on the plastic deformation of SAE-4130 steel. Journal of Research of the National Bureau of Standards, 46(6): 472-479. https://doi.org/10.6028/jres.046.050
[33] Badiger, R.I., Narendranath, S., Srinath, M.S. (2018). Microstructure and mechanical properties of Inconel-625 welded joint developed through microwave hybrid heating. Proceedings of the Institution of Mechanical Engineers, Part B: Journal of Engineering Manufacture, 232(14): 2462-2477. https://doi.org/10.1177/0954405417697350