Amar Guettouche![]() | Abdelghani Merdas
| Abdelghani Merdas![]() | Fouad Berrabah*
| Fouad Berrabah*![]() | Lyazid Guechi
| Lyazid Guechi
© 2023 IIETA. This article is published by IIETA and is licensed under the CC BY 4.0 license (http://creativecommons.org/licenses/by/4.0/).
OPEN ACCESS
Solid waste management is one of the world's major environmental concerns. Cement Kiln Dust (CKD) is a by-product of cement manufacturing. It is a fine-grained, solid and highly alkaline particulate material. Environmental concerns related to Portland cement production, CO2 emissions and CKD disposal are becoming increasingly important. Replacing some of the cement with CKDs will significantly reduce the amount of clinker to be produced, which will then reduce CO2 emissions into the atmosphere and transform the CKDs into useful products while allowing sustainable concrete/mortar to be produced in an environmentally friendly way. This work is part of the recovery of machining waste from the manufacture of cements produced from a local Algerian cement plant, in particular CKD. Study of the use of CKD influence in mortar and concrete reveals that the percentage increase in CKD accelerates setting time. From the obtained results (simple compression and bending tension) we can conclude that the use of CKD in mortar can be favorable for substitution and/or addition up to 10%.
Cement Kiln Dust, cement, substitution, concrete, setting time, mortars
Cement is one of the most used materials on earth and it is a strategic product in construction industry. Global cement production is expected to increase from 3.27 billion metric tons in 2010 to 4.83 billion metric tons in 2030 [1]. The cement production process requires thermal energy to produce clinker, as the manufacture of a ton of ordinary Portland cement requires 60 to 130 kg of fuel oil or its equivalent and about 110 kilowatt-hours of electricity [2]. In the meantime, cement accounts for at least 5 percent of anthropogenic emissions of greenhouse gases, and, according to some estimates, this share may be even higher. At the same time, energy-related expenses in the cement sector, mostly on fossil fuels and electricity, account for 30 to 40 percent of the industry’s cash costs [3].
On the other hand, large amounts of Cement Kiln Dust (CKD), are generated during the production of high temperature clinker. CKD is a fine-grained, solid and highly alkaline by-product extracted from exhaust gases and collected in particulate control devices such as cyclones, bag filters as well as electrostatic precipitators. A medium-sized cement plant can produce up to 30,000 tonnes of CKD per year [4]. Part of the generated CKD could be reused in a cement kiln as raw food. However, this is limited by the concentration of alkalis in the CKD, and most of it is disposed of on site, without further reuse or recovery, posing significant environmental problems [5, 6]. Removal of CKD not only consumes land, but also contaminates surface and groundwater with chemicals and heavy metals leached from CKD [7].
Additionally, CKD affects human health by causing serious health risks [8]. Therefore, recycling of construction waste is becoming increasingly important for sustainable construction, as it could lead to several economic and environmental benefits [9].
According to this new vision, the recycling of waste and by-products to partially replace cement is strongly encouraged to limit the environmental impact of the cement industry and transform this waste into useful products for sustainable construction [2].
CKD can be used in civil engineering as an additive substrate for production of cement, concrete, special concretes, mortars, asphalt mixtures, other mixtures for building sector, building ceramics, as an activator for blast furnace slags and flying ashes, and as an additive to other binders [10].
Several publications such as [7, 11-13], presented the using of CKD in the production of cement and cement products as mortar or concrete [10]. According to the research presented in [7, 12], CKD applied in suitable amounts is not adversely affecting the properties of cement mortars. The biggest problem in application of CKD is its high chloride concentration and alkalinity, which may have influence on some cement CKD products. It was noticed that cements with only additives as CKD have decreased workability, maturing time, and strength. The decrease of strength is the consequence of alkali contained in CKD. Application of CKD together with flying ashes and blast furnace slag decreases the problem of alkalinity and thus increases the strength. Physical and chemical parameters of CKD make this material effective to be used in grouting mixtures either as a “filler” for reduction of bleed or as a binder, where limited strength is required from the grout. According to research presented by Siddique [13], concretes with lower percentages of CKD (about 5%) have compressive strength, flexural strength, toughness, and freezing and thawing resistance comparable to the traditional concretes [10].
Another attempt to utilize CKD in building sector is to apply it as a partial substitute of cement in the production of solid cement bricks. According to El-Attar et al. [2], up to 50% CKD could be utilized to manufacture environmental friendly bricks with acceptable properties. Its application would not only reduce the environmental problems associated with CKD disposal but also would be beneficial in reducing the demand of cement needed in bricks industry, thus reducing energy demands and CO2 emissions during cement manufacturing process [10].
Basing on the information presented above, it can be noticed that CKD can be attractive additive for use in low-strength materials [10]. According to Arulrajah et al. [14], CKD and fly ash blends could be used as an alternative binder to stabilize demolition wastes, that can be further utilized in building sector [10].
And finally, CKD could be also utilized in production asphalt pavement/concrete and low-strength materials [13, 15]. Within the presented research [13], mixtures containing CKD as a filler revealed better resistance against freeze-thaw cycles compared to the control mixture that contained limestone. Additionally, mixtures containing CKD, exhibited higher fatigue life comparing to the control mixtures [10].
Our objectives through this research are to study the possibility of recycling CKDs produced from a local Algerian cement plant and also to reduce the amount of cement consumed in cement-based materials. We investigated the possibility of using CKD cement kiln dust as cementitious materials in mortar and concrete. In addition, environmental and economic assessment was carried out to improve some properties of mortar and concrete.
2.1 Materials
Artificial Portland cement of the CEM I/A 42.5 type, and Cement Kiln Dust (CKD), comes from the "Ain-Al-Kebira-Serif, Algeria" cement plant.
Also, three types of sand are added to the mortar, a crushed sand of fraction 0/5 (SC), coming from a quarry in Setif, a sand from the dunes of Boussaâda and a standardized sand [certified CEN, EN 196-1] [16] of French origin.
A gravel of crushed stones (PC): 3/8 from a quarry in Setif.
The mixing water used for making the various concretes is potable drinking water.
2.1.1 Cement and CKD
The chemical, mineralogical, and physical compositions of CKD, varies from one plant to another. These depend on raw material, type of kiln operation, dust collection method, and type of fuel used in the plant [17].
Chemical and mineralogical composition of cement and CKD. Determination of the chemical and mineralogical composition of cement and Cement Kiln Dust (CKD) were carried out by X-ray fluorescence (XRF) according to the NF EN,196-3 standard [18] and X-ray diffraction (XRD) respectively [19, 20].
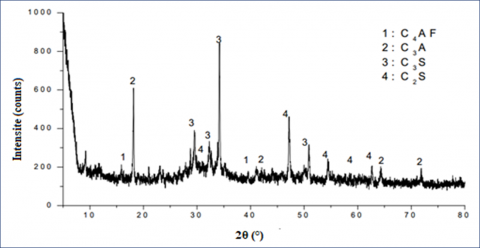
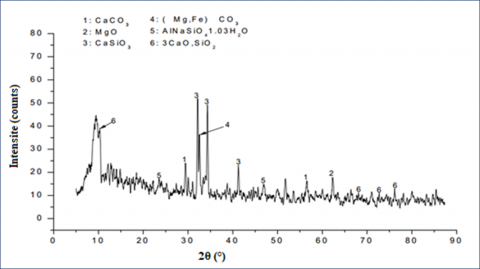
Chemical compositions of cement and CKD (in% by mass) determined by (XRF) are reported in Table 1 and the DRXs analyzes of the CEM I cement and used CKD in the formulations are illustrated in Figures 1 and 2 respectively.
The four major components of Portland Cement, Alite (C3S–Ca3SiO5), Belite (C2S–Ca2SiO4), Aluminate (C3A–Ca3Al2O6), and Aluminoferrite (C4AF), are presented in Figure 1, while, the major components of CKD, as the Calcium, Magnesium, Silicate, and Carbonate are presented in Figure 2.
Table 1. Chemical composition of cement and CKD
|
Chemical composition (%) |
CEM I |
CKD |
|
SiO2 |
20,450 |
24,100 |
|
CaO |
63,480 |
63,300 |
|
SO3 |
1,710 |
0,816 |
|
K2O |
0,200 |
0,960 |
|
Na2O |
0,152 |
0,258 |
|
MgO |
1,440 |
1,230 |
|
Fe2O3 |
4,630 |
4,660 |
|
Al2O3 |
4,050 |
4,200 |
|
P2O5 |
/ |
0,250 |
|
Cl |
0,001 |
0,175 |
Figure 1. Diffractogram of CEM I
Figure 2. Diffractogram of CKD
Due to the varying origin and production technology of dust, different chemical compositions of CKD are found in the literature. Table 2 presents comparison between the Algerian CKD chemical compositions and some others prepared on the basis of the literature review.
Granulometry analysis of Cement and CKD. The fineness of a powder can be characterized by the laser granulometry technique, according to ISO 13320:2020 [21]. On the basis of the studies conducted by Siddique and Rajor [22], the particle size distribution of CKD depends on the process technology, method of dust collection, chemical composition of CKD, and alkali content.
Table 2. Comparison between the Algerian CKD chemical compositions and others
|
Dust component (%) |
Algerian CKD |
CKD literature review [10] |
||||||
|
Siddique (2006) |
Maslehuddin et al. (2008) |
Taha et al. (2004) |
Al-Harthy et al. (2003) |
Batis et al. (2002) |
Todres et al. (1992) |
Miller and Azad (2000) |
||
|
SiO2 |
24.10 |
14.5 |
17.1 |
15.84 |
15.8 |
2.16 |
9.60 |
15.9 |
|
Al2O3 |
4.20 |
4.10 |
4.24 |
3.57 |
3.6 |
1.09 |
3.40 |
3.43 |
|
Fe2O3 |
4.66 |
2.00 |
2.89 |
2.76 |
2.8 |
0.54 |
1.10 |
1.90 |
|
CaO |
63.30 |
40.50 |
49.3 |
63.76 |
63.8 |
52.72 |
44.90 |
43.50 |
|
MgO |
1.23 |
1.55 |
1.14 |
1.93 |
1.9 |
0.68 |
1.30 |
1.64 |
|
SO3 |
0.816 |
6.5 |
3.56 |
1.65 |
1.7 |
0.05 |
6.74 |
1.62 |
|
K2O |
0.96 |
4.66 |
2.18 |
2.99 |
3.0 |
0.11 |
2.40 |
2.94 |
|
Na2O |
0.258 |
0.44 |
3.84 |
0.33 |
0.30 |
- |
0.27 |
0.30 |
|
Cl |
0.175 |
- |
6.9 |
- |
1.1 |
- |
- |
- |
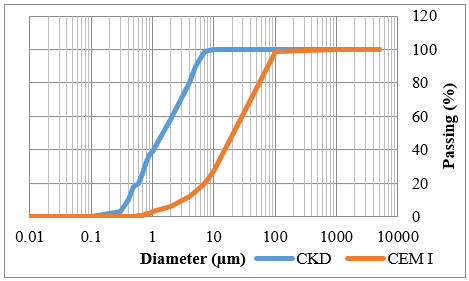
The grain size curves of cement and Cement Kiln Dust (CKD) are shown in Figure 3. From these results, we observe that the size distribution of CKD particles varies from 0.1 to 10 µm with an average particle size of 4.35 µm. In addition, the values of D10% and D90% were 0.45 µm and 5.1 µm respectively. Compared to cement the particle size distribution varies from 0.4 to 200 µm with an average particle size of around 20 µm, the values of D10% and D90% for cement were respectively 2.4 µm and 67 µm. The values obtained indicate that the fineness of CKD is greater than that of cement.
Figure 3. Granulometric curve of Portland Cement (CEM I) and CKD
Density of Cement and CKD. The apparent and absolute densities of cement and Cement Kiln Dust (CKD) are measured according to the standard [23]. The results obtained are illustrated in Table 3.
From these results, the values obtained indicate that Absolut Density of CKD is lower than that of cement.
Table 3. Density of portland cement (CEM I) and (CKD)
|
Characteristics |
CEM I |
CKD |
|
Apparent Density (g/cm3) |
3.02 |
3.15 |
|
Absolut Density (g/cm3) |
1.03 |
0.98 |
Normal consistency and setting time of cement. Analyzes for determination of normal consistency and setting time of cement paste were carried out using the "VICAT" apparatus, in accordance with standard [18].
With defeated substitution rate of "CKD", (0%, 5%, 10%, 15% and 20%), the purpose of the consistency test is to determine the optimum amount of mixing water, thus the “Start setting time” and the “End setting time” of the cement paste.
Obtained results are illustrated in Tables 4 and 5.
Table 4. Normal consistency of prepared cements
|
Formulations |
CKD (%) |
W/C (%) |
|
F1 (control) |
0% |
27 |
|
F2 |
5% |
27.2 |
|
F3 |
10% |
27.5 |
|
F4 |
15% |
27.7 |
|
F5 |
20% |
27.9 |
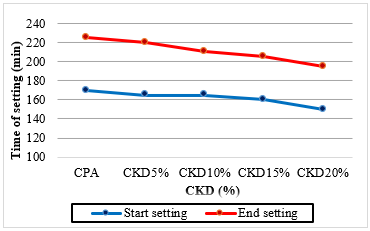
Table 5. Results of start and end setting times
|
Formulations |
CKD (%) |
Start setting time (min) |
End setting time (min) |
|
F1 (control) |
0% |
170 |
225 |
|
F2 |
5% |
165 |
220 |
|
F3 |
10% |
165 |
210 |
|
F4 |
15% |
160 |
205 |
|
F5 |
20% |
150 |
195 |
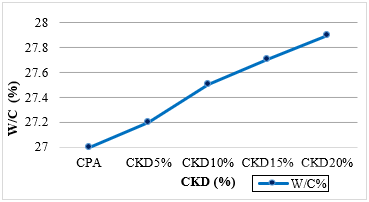
Figure 4. Variation of the W/C ratio depending on the CKD rate
Figure 5. Curves of start and end setting times
According to the results obtained (Figures 4 and 5), we notice that the partial substitution of cement by CKD slightly increases the water demand, this due to the absorption of a quantity of water by the CKD. The increased demand for water is due to the high alkali content in CKD, in addition to a finer classification of CKD compared to cement.
The start and end setting times decrease with the increase in the amount of CKD. This is explained by the fact that the reaction is precipitated in the short term. This also means that the kinetics of hydration of the binder are becoming more and more rapid. This is due to the absorption of a quantity of water by the CKDs in addition to a finer classification of the CKD which allows ease of hydration.
Therefore, the crystals of C-S-H (responsible for hardening the paste) exist in non-hydrated quantity at very young ages.
2.1.2 Aggregates
The physical and mechanical characteristics of the aggregates are summarized in Table 6.
Table 6. Characteristics of aggregates
|
Characteristics |
Quarry Sand |
Dunes Sand |
Standardized Sand |
Gravel (PC) 3/8 |
|
Apparent Density (g/cm3) |
1.55 |
1.31 |
1.70 |
1.4 |
|
Absolute Density (g/cm3) |
2.53 |
2.65 |
2.63 |
2.59 |
|
Water Content (%) |
0.9 |
0.4 |
/ |
/ |
|
E.S.P sand equivalent (%) |
65.83 |
70.87 |
93 |
/ |
|
E.S.V sand equivalent (%) |
70.7 |
73.6 |
94 |
/ |
|
Fineness modulus (MF) |
3.44 (Coarse Sand) |
2 (Fine Sand) |
2.5 (Medium Sand) |
/ |
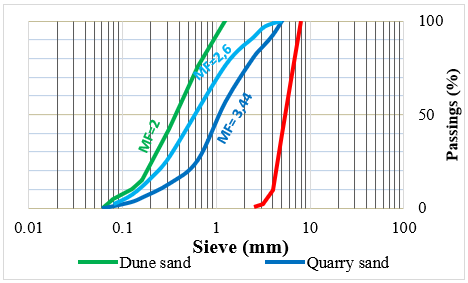
In accordance with standard [24], the grain size curves of quarry sand, dune sand, standardized sand and gravel are shown in Figure 6. The particle size composition determined by sieving complies with the requirements of standards [16, 25].
The visual measurement indicates that the cleanliness of quarry sand in the range (65-75), so it is a slightly clayey sand, admissible for current concrete with risk of shrinkage, also the cleanliness measurement by piston indicates that the quarry sand remains of the same quality as the visual measurement.
Quarry sand is coarse sand with fineness moduli of 3.44 the use of this sand leads to a correction of fineness and/or the use of fines.
Figure 6. Granulometric curve of the aggregate mixture
Also, the cleanliness of a dune sand, located in the range (65-75), so it is a slightly clayey sand, admissible for current concrete with risk of shrinkage, also the piston measurement gives a high cleanliness in the range (70-80), which indicate that the dune sand is a clean sand, suitable for high quality concrete.
CEN EN 196-1 standardized sand is a siliceous sand, with rounded grains, whose silica content is 98%, delivered in mixed fractions in plastic bags with 1350 g ± 5 g of content. It is clean, these grains are generally isometric and rounded in shape. It is dried, screened and prepared in a modern workshop offering all guarantees of quality and regularity.
2.2 Formulations and experimental tests
2.2.1 Preparation of samples
Mortar. We used normal mortars using standardized sand, according to the standard [26], this corresponds to a sand/cement ratio equal to 3 (S/C=3), with a water/cement ratio (W/C=0.5).
Two main types of mortar mixtures were prepared using sand, cement, CKD and water, designated by the letters A and B.
Table 7. Formulation of A and B mortars samples
|
Mortar |
A |
B |
||||||||
|
Constitute (g) |
Control |
5% |
10% |
15% |
20% |
Control |
5% |
10% |
15% |
20% |
|
Cement |
450 |
427.5 |
405 |
382.5 |
360 |
450 |
450 |
450 |
450 |
450 |
|
CKD |
0 |
22.5 |
45 |
67.5 |
90 |
0 |
67.5 |
135 |
202.5 |
270 |
|
Sand |
1350 |
1350 |
1350 |
1350 |
1350 |
1350 |
1282.5 |
1215 |
1147.5 |
1080 |
|
Water |
225 |
225 |
225 |
225 |
225 |
225 |
225 |
225 |
225 |
225 |
Five different mortar mixes were prepared using 0% (control), 5%, 10%, 15%, and 20% CKD. In mortar A,CKD replaces an equivalent volume of cement and are designated respectively by A5, A10, A15, and A20, while in mortar B, designated respectively by B5, B10, B15 and B20, the volume of sand was replaced by an equivalent volume of CKD and the amount of cement was fixed (see Table 7).
Concrete. The concrete formulation is calculated using the Dreux-Gorisse method [27].
With a maximum diameter (Dmax) of the crushed aggregates equal to 8 mm, ordinary concrete that one seeks to formulate has a resistance at 28 days (Fc28) equal to = 30 MPa, a slump (A) equal to 2cm and the powerful vibration.
The quantity of water used is equal to 180 L/m3, for a cement dosage equal to 350 kg/m3.
The final formulation was obtained from examples of formulation suitable for the manufacture of solid concrete blocks, the latter makes it possible to best adjust the theoretical formula of the concrete according to the desired qualities and materials actually employed.
Three mixtures were prepared with gravel 3/8, quarry sand fraction 0/3, dune sand, CEM I cement, and "CKD" replaced 0%, 30% and 50% by weight of cement. The amount of water was adjusted so as to obtain a firm concrete suitable for the production of cement bricks using a mechanical press.
The mixtures and amount composition of ingredients per cubic meter is shown in Table 8.
It is observed that partial substitution of cement by CKD slightly increases the demand for water. The amount of increase is approximately equal to 0.3%.
Table 8. Proportions of ingredients (kg, L/m3)
|
Formulation |
CEM I |
CKD |
Gravel (3/8) |
Sand (0/3) |
Dune Sand |
Water |
|
Control |
350 |
0 |
1000 |
500 |
270 |
180 |
|
CKD 30% |
245 |
105 |
1000 |
500 |
270 |
181 |
|
CKD 50% |
175 |
175 |
1000 |
500 |
270 |
182 |
2.2.2 Mortar and concrete tests
For mortars, the main tests performed are the flexural fracture test and the compression fracture test, using the Exceed E45 universal testing machine manufactured by MTS, in the Emerging Materials Research Unit, Sétif, Algeria.
For concrete, the physico-mechanical properties of bricks were evaluated by determining their density, water absorption content and compressive strength. The compression test was performed at 7 and 28 days, while density and water absorption tests were performed at 28 days of age.
The bending fracture tests are carried out on prismatic test specimens of (4×4×16) cm3 placed on two rollers at a distance of 100 mm and the compression fracture tests are carried out on test specimens arranged so that the compressed section is (4×4) cm2.
In addition, the environmental and economic assessment was also carried out to select the most economical and environmentally friendly mixture (mortar or concrete).
3.1 Mortar
3.1.1 Mechanical resistance
Once the formulations of specimens were made according to the standard [16], the materials obtained after a storage period in water for 2, 7 and 28 days were tested for tensile strength by bending and compression.
Results of the change in mechanical strengths obtained on prepared formulations (A and B) are shown in Tables 9 and 10 and Figures 7, 8, 9 and 10.
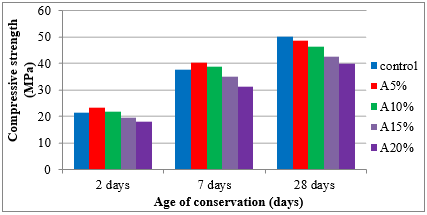
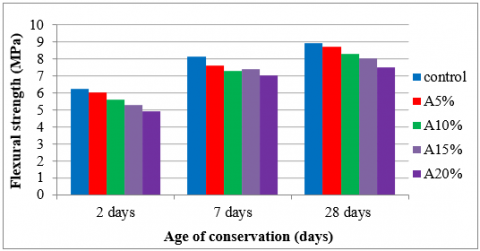
Mortar A. For Mortar A, evolution of compressive and flexural strengths as a function of the quantity of CKD added is shown in Table 9, and the effect of addition of CKD on compressive and flexural strengths is illustrated in Figures 7 and 8 respectively.
The obtained results at 2 and 7 days of storage show that the control mortar (0% CKD) has a lower compressive strength than A5% mortars, higher than that of A10%, A15% and A20% mortars. At 28 days of age, the control mortar (0% CKD) was observed to produce the greatest compressive strength (50 MPa).
Flexural strengths generally decrease slightly with increasing percentage substitution of CKD.
Table 9. Evolution of compressive and flexural strengths as a function of the quantity of CKD added (Mortar A)
|
|
Compressive strength Rc (MPa) |
Flexural strength Rf (MPa) |
||||
|
Formulations |
2 days |
7 days |
28 days |
2 days |
7 days |
28 days |
|
Control |
21.7 |
37.5 |
50 |
6.2 |
8.1 |
8.9 |
|
A 5% |
23.1 |
40.3 |
48.6 |
6 |
7.6 |
8.7 |
|
A 10% |
21.5 |
38.6 |
46.2 |
5.5 |
7.3 |
8.3 |
|
A 15% |
19.5 |
35.1 |
42 |
5.3 |
7.4 |
8 |
|
A 20% |
17.8 |
31.2 |
39.7 |
4.9 |
7 |
7.5 |
Figure 7. Effect of addition of CKD on compressive strength
Figure 8. Effect of addition of CKD on flexural strength
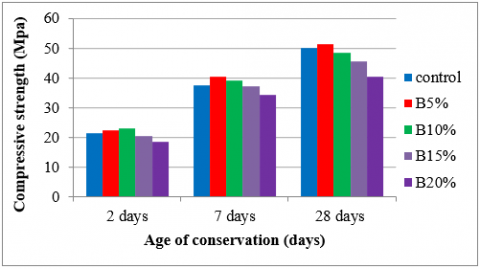
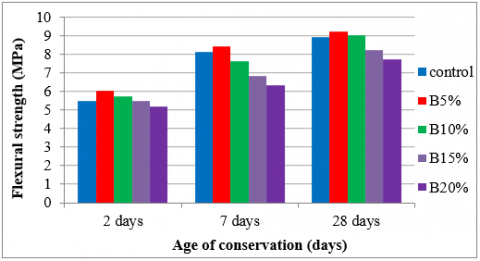
Mortar B. For Mortar B, evolution of compressive and flexural strengths as a function of the quantity of CKD added is shown in Table 10, and the effect of addition of CKD on compressive and flexural strengths is illustrated in Figures 9 and 10 respectively.
The results obtained in Figures 10 and 11 demonstrate that the B5 mortar (5% CKD) has high compressive and flexural strength.
Table 10. Evolution of compressive and flexural strengths as a function of the quantity of CKD added (Mortar B)
|
|
Compressive strength Rc (MPa) |
Flexural strength Rf (MPa) |
||||
|
Formulations |
2 days |
7 days |
28 days |
2 days |
7 days |
28 days |
|
Control |
21.5 |
37.5 |
50 |
5.5 |
8.1 |
8.9 |
|
B 05 % |
22.3 |
40.5 |
51.2 |
6 |
8.4 |
9.2 |
|
B 10 % |
23 |
39.2 |
48.3 |
5.7 |
7.6 |
9 |
|
B 15% |
20.5 |
37.5 |
43.6 |
5.5 |
6.8 |
8.2 |
|
B 20% |
18.5 |
34.4 |
40.5 |
5.2 |
6.3 |
7.7 |
Figure 9. Effect of addition of CKD on compressive strength
Figure 10. Effect of addition of CKD on flexural strength
The results obtained on different mortars, clearly indicate that mixing mortars (A) containing 5% and 10% CKD percentages produced a value close to control mix resistance (0% CKD), while in the case of mixing mortars (B), no beneficial increase in strength beyond 5% has been observed.
The results also show that more CKDs are added, the more resistance decreases. This can be attributed to the quantitative and qualitative aspect of CKDs. As the decrease in strength is due to the increase in the percentage of CKD that absorbs the amount of water determined for the hydration of cements.Therefore, unfinished hydration especially in the formulation of C-S-H is responsible for the weak resistance. In addition, the amounts of alkalis present in the CKD caused a kind of crystallization of the hydration products, which caused the pore system of the hardened samples to open, which reduced the compressive strength. According to the research results presented in the literature, the amount of CKD introduced to the concrete by substituting part of the Portland Cement deteriorates the mechanical properties and durability of concrete. Determining the border value, with which the amount of additive does not significantly impact the quality of concrete, is an essential aspect of the conducted studies. In numerous publications, it is stated that replacing total weight of the cement with 5% CKD does not deteriorate its properties [28-31].
Marku et al. [32] also indicated when CKD is used as a partial replacement of Portland Cement by mass, more CKD particles are required to replace the Portland Cement, which affects the rheological properties of Portland Cement -CKD blends.
3.2 Concrete
3.2.1 Physical properties
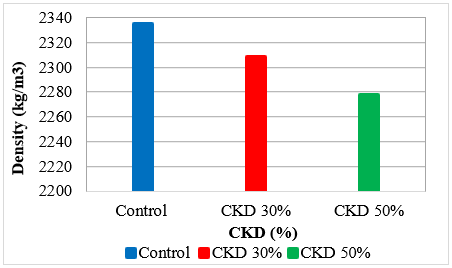
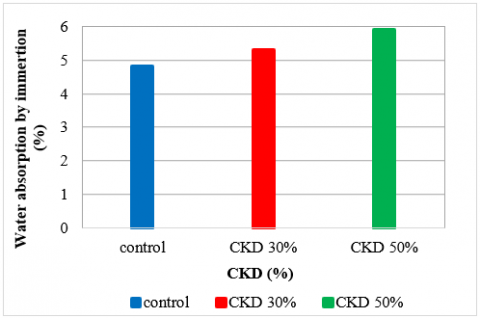
The physical properties of concrete bricks were evaluated by determining their density and water absorption content by immersion. Tests were carried out at the age of 28 days. Obtained results are illustrated in Table 11.
Table 11. Physical properties of concrete bricks
|
Brick |
Water absorption by immersion (%) |
Density (kg/m3) |
|
Control |
4.70 |
2335.3 |
|
CKD 30% |
4.95 |
2308.5 |
|
CKD 50% |
5.32 |
2277.6 |
Obtained results (Figure 11) show the effect of the CKD addition on the density of the bricks, it is observed that the density decreases slightly with the increase in the percentage of CKD. The reason for this reduction is the low density of CKD compared to that of cement. In addition, the density of all brick samples is greater than 2200 kg/m3.
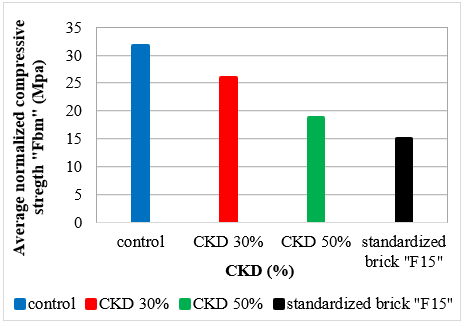
If we want to use our concrete brick for masonry elements and according to the standard [33], the brick produced belongs to class "ρ = 2.2+", the latter must have the average of its minimum standard compressive strength f15, that is to say Fbm greater than 15 N/mm2.
Fbm=Fc×δ (1)
where, Fbm: average normalized compressive strength (MPa); Fc: compressive strength (MPa); δ: form factor corresponds to standard [34]. In our case δ=0.8.
Figure 11. Effect of added CKD rate on the density (kg/m3) of concrete bricks
The results of CKD addition effect on the immersion water absorption of bricks are shown in Figure 12. It is observed that the partial substitution of cement by CKD increases the percentage of water absorption.
Absorption by CKD can be attributed to the reasons for crystallization of hydration products due to the high content of chlorides and sulfates in CKDs. This leads to the opening of the pore system and thus to the increased porosity of the cured "cement - CKD" matrix [32].
The water absorption values recorded for all the bricks are lower than the maximum limit (8%) required for the production of concrete bricks according to standard [33].
Figure 12. Effect of added CKD rate on water absorption by immersion (%) of concrete bricks
3.2.2 Mechanical resistance
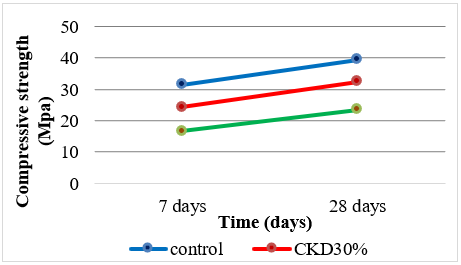
The mechanical properties of concrete bricks were evaluated by determining their compressive strength, the test was performed at the age of 7 and 28 days, obtained results are shown in Table 12.
Figure 13 shows the effect of adding CKD on the compressive strength of bricks. It is observed that the resistances decrease with the increase of CKD addition.
We note that the compressive strength of all concrete brick samples exceeds the minimum strength limit for load-bearing applications, as through the results shown in Figure 14, we notice that all concrete brick samples belonged to class f15, since their average standardized compressive strengths (Fbm) is greater than 15 N/mm2.
So, CKD bricks comply with standard [33], therefore the volume of cement up to 50% of CKD can be replaced in the manufacture of masonry units.
Table 12. Evolution of compressive strengths of concrete bricks as a function of quantity of CKD added
|
|
Compressive strength Rc (MPa) |
|
|
Brick |
7 days |
28 days |
|
Control |
31.5 |
39.5 |
|
CKD 30% |
24.3 |
32.4 |
|
CKD 50% |
16.7 |
23.5 |
Figure 13. Effect of added CKD rate on the compressive strength (MPa) of concrete bricks
Figure 14. Evolution of the average normalized compressive strengths of concrete bricks
3.2.3 Durability of bricks
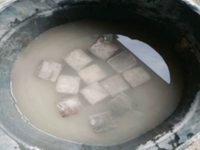
The durability characteristics were evaluated by determining the compressive strength evolution of bricks after being immersed for three months in aggressive solutions (Figure 15).
Figure 15. Bricks submerged in waste water
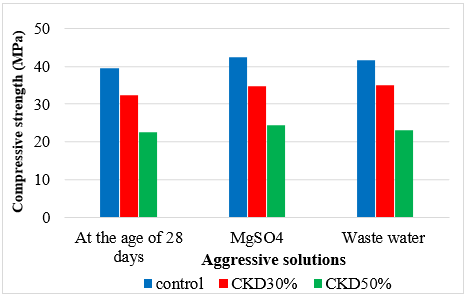
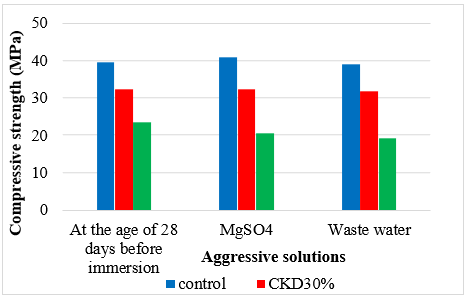
The effect of aggressive solutions on the compressive strength (MPa) of bricks, at the age of 45 days after immersion, are shown in Table 13.
From the results shown in Table 13 and Figure 16, we observe, that after 45 days of immersion, a slight increase in compressive strengths of most bricks and this can be attributed to the reaction of hydration of cement.
The effect of aggressive solutions on the compressive strength (MPa) of bricks, at the age of 90 days after immersion, are shown in Table 14.
Figure 16. Effect of aggressive solutions on the compressive strength (MPa) of bricks after 45 days of immersion
Table 13. Effect of aggressive solutions on the compressive strength (MPa) of concrete bricks
|
|
Compressive strength at the age of 45 days after immersion |
|
|
Brick |
Waste water |
(MgSO4 at 5%) |
|
Control |
41.7 |
42.5 |
|
CKD 30% |
35 |
34.8 |
|
CKD 50% |
23 |
24.4 |
Table 14. Effect of aggressive solutions on the compressive strength (MPa) of bricks
|
|
Compressive strength at the age of 90 days after immersion |
|
|
Brick |
Waste water |
(MgSO4 at 5%) |
|
Control |
39 |
41 |
|
CKD 30% |
31.9 |
32.3 |
|
CKD 50% |
19.25 |
20.4 |
Figure 17. Effect of aggressive solutions on the compressive strength (MPa) of bricks after 90 days of immersion
From the results shown in Table 14 and Figure 17, we observe that after 90 days of immersion, no influence of aggressive solutions on the compressive strength of bricks 0% CKD (controls) and 30% of CKD, while with 50% of CKD, the resistance of the bricks decreases (more than 50%) and this indicates the sensitivity of CKD towards aggressive solutions. In addition, we did not record any chemical reaction between the plastic boxes used to store the samples and the aggressive solutions, in particular the magnesium sulphate.
All the bricks manufactured are still classified as load-bearing bricks even after three months of immersion in aggressive solutions because their compressive strengths are greater than the minimum limit required by standard [33]. The cement could therefore be replaced by a rate of CKD up to 50% for the production of cement bricks and concrete. Therefore, it is recommended to use a coating layer to protect CKD bricks in aggressive environments and to extend their service life.
The objective of this work is to recover the machining waste from the manufacture of cements, in particular Cement Kiln Dust (CKD), and to study their effects on the behavior of concrete and mortar.
Based on the results obtained we conclude, through an x-ray fluorescence analysis of CKD, that its chemical composition is identical to that of cement, however, CKD is very alkaline; also, the CKD laser particle size analysis shows that these particles are fine and indicates that the purity of CKD is greater than that of cement.
Density test indicates that the absolut density of CKD is lower than that of cement (1,03 g/cm3˃0,98 g/cm3), and the consistency test also indicates that increasing the rate of substitution of CKD increases the amount of water required for a normal cement paste consistency.
The results also show that the start and end setting times decrease proportionally with the increase in the rate of CKD substitution; and the partial replacement of cement by CKD reduces the density of the solid matrix "cement - CKD" and increases its porosity.
The mechanical compressive and flexural strengths of our different samples show that more quantities of CKD we add, the more strengths decrease. For the mortar "A" for example, in 28 days, the results show that as we add 5%, 10%, 15%, and 20% of CKD, the mechanical compressive strengths decrease by 2.8%, 7.6%, 16%, and 20.6%, respectively, and the flexural strengths decrease by 2.25, 6.74, 10.11, and 15.73%, respectively. So, mortar mixtures containing substitution percentages less than 10% CKD may produce a close value of compressive and flexural strength compared to those of the control mixture, and mechanical compressive and flexural strengths for mortar mixtures containing CKD addition percentages show that the optimum value which gives a beneficial increase in strength is 5%.
The results of the study also show that the compressive strength of all finished brick samples exceeds the minimum limit required by the regulations in force for load-bearing applications, also the durability tests carried out showed that the manufactured bricks show good resistance to the aggressive environments tested, and therefore all samples are therefore classified as load-bearing bricks even after three months of immersion in aggressive solutions.
Finally, it can be said that high volumes of CKD could be advantageously used to replace 50% cement for an economical sustainable brick and concrete block manufacturing while respecting the environment, however, it is recommended to use a coating layer on "50% CKD" bricks exposed to aggressive agents to improve durability.
With regard to research prospects, we propose the following research axes:
·Microstructural analysis by X-ray diffraction (XRD) and observation of the facies, with a scanning electron microscope of different formulations studied at different hardening times (control of the formation of ettringite, portlandite and HSCs);
·Influence of the W/C ratio and the mode of preservation on the mechanical response of cement-based mortar/concrete to CKD additions;
·The influence of CKD addition on dimensional (shrinkage) and volume (swelling) variations of mortars. Study of the influence of alkaline additions activation method (CKD).
The authors gratefully acknowledge the support of Mr. DALI Ameur and Mr. MESBAH Hamza, in carrying out this study.
|
CKD |
Cement Kiln Dust |
|
C-S-H |
Calcium Silicate Hydrate |
|
MgSO4 |
Magnesium sulphate |
|
CEM I |
Portland Cement |
|
Apparent Density (bulk density) |
(ρapp) (g/cm3) |
|
Absolute Density (specific mass) |
(ρs) (g/cm3) |
|
D10% |
dimension of the sieve corresponding to 10% of passer-by (mm) |
|
D90% |
dimension of the sieve corresponding to 90% of passer-by (mm) |
|
Dmax |
maximum diameter of the crushed aggregates (mm) |
|
E.S.P |
equivalent sand measured with the piston (%) |
|
E.S.V |
visual sand equivalent (%) |
|
FM |
fineness modulus |
|
Fc28 |
resistance at 28 days (MPa) |
|
Gravel (PC) 3/8 |
fraction of gravel (mm) |
|
Rc |
Compressive strength (MPa) |
|
Rf |
Flexural strength (MPa) |
|
S/C |
sand/cement ratio |
|
w |
water content (%) |
|
w/c |
water–cement ratio |
Results of laser granulometry technique:
|
X-Values |
CEM I |
|
0.01 |
0 |
|
0.1 |
0 |
|
0.3 |
0 |
|
0.4 |
0 |
|
0.5 |
0 |
|
0.6 |
1 |
|
0.7 |
1 |
|
0.8 |
2 |
|
0.9 |
2 |
|
1 |
3 |
|
1.2 |
3 |
|
1.4 |
4 |
|
1.6 |
4 |
|
1.8 |
5 |
|
2 |
5.8 |
|
2.3 |
6 |
|
2.6 |
7 |
|
3 |
9 |
|
3.5 |
10 |
|
4 |
12 |
|
4.5 |
13 |
|
5 |
15 |
|
6 |
17 |
|
7 |
20 |
|
8 |
23 |
|
9 |
24 |
|
10 |
27 |
|
12 |
32 |
|
14 |
40 |
|
16 |
43 |
|
18 |
47 |
|
20 |
53 |
|
23 |
57 |
|
26 |
63 |
|
30 |
70 |
|
35 |
73 |
|
40 |
80 |
|
45 |
83 |
|
50 |
87 |
|
60 |
92 |
|
70 |
94 |
|
80 |
96 |
|
90 |
98 |
|
100 |
99 |
|
1000 |
100 |
|
5000 |
100 |
[1] Statista Research Department. (2013). Cement: Global production 1990, 2000 and 2010, with forecasts for 2020 and 2030.
[2] El-Attar, M.M., Sadek D.M., Salah, A.M. (2017). Recycling of high volumes of cement kiln dust in bricks industry. Journal of Cleaner Production, 143(1): 506-515. http://dx.doi.org/10.1016/j.jclepro.2016.12.082
[3] Folliet, M., Rivas Saiz, M., Shah, J. (2017). Improving thermal and electric energy efficiency at cement plants: International best practice. International Finance Corporation, USA.
[4] Daus, M.A. (2004). Utilization of cement kiln dust and fly ash in cement blends in Saudi Arabia. Engineering Sciences Journal. 15(1): 33-45.
[5] Hossain, K., Lotfy, A., Shehata, M., Lachemi M. (2007). Development of flowable fill products incorporating cement kiln dust. 32nd Conference on Our World in Concrete & Structures, Singapore.
[6] Konsta-Gdoutos, M., Shah, S. (2003). Hydration and properties of novel blended cements based on cement kiln dust and blast furnace slag. Cement and Concrete Research, 33(8): 1269-1276. https://doi.org/10.1016/S0008-8846(03)00061-9
[7] Sreekrishnavilasam, A., Stephanie, K., Marika, S. (2006). Characterization of fresh and landfilled cement kiln dust for reuse in construction applications. Engineering Geology, 85(1-2): 165-173. https://doi.org/10.1016/j.enggeo.2005.09.036
[8] Fadhil, T., Jasim, S., Aziz, K., Ahmed, A. (2013). Influence of using white cement kiln dust as mineral filler on hot asphalt concrete mixture properties. International Journal of Civil Engineering and Technology, 4: 87-96.
[9] Abdelfatah, A., Tabsh, S. (2011). Review of research on and implementation of recycled concrete aggregate in the GCC. Advances in Civil Engineering, 2011: 567924.https://doi.org/10.1155/2011/567924
[10] Siddique, R., Cachim, P. (2018).Waste and supplementary cementitious materials in concrete: Characterisation, properties and applications. Woodhead Publishing Series in Civil and Structural Engineering.
[11] Adaska, W., Taubert, D. (2008). Beneficial uses of Cement Kiln Dust. In: IEEE/PCA 50th Cement Industry Technical Conference, Miami, pp. 210-228. https://doi.org/10.1109/CITCON.2008.24
[12] Maslehuddin, M., Al-Amoudi, O., Shameem, M., Rehman, M., Ibrahimm, M. (2008). Usage of cement kiln dust in cement products – Research review and preliminary investigations. Construction and Building Materials, 22(12): 2369-2375. https://doi.org/10.1016/j.conbuildmat.2007.09.005
[13] Siddique, R. (2006). Utilization of Cement Kiln Dust (CKD) in cement mortar and concrete- an overview. Resource, Conservation and Recycling, 48(4): 315-338. https://doi.org/10.1016/j.resconrec.2006.03.010
[14] Arulrajah, A., Mohammadinia, A., D’Amicoc, A., Horpibulsuk, S. (2017). Cement kiln dust and fly ash blends as an alternative binder for the stabilization of demolition aggregates. Construction and Building Materials, 145: 218-225. https://doi.org/10.1016/j.conbuildmat.2017.04.007
[15] Modarres, A., Ramyar, H., Ayar, P. (2015). Effect of cement kiln dust on the low-temperature durability and fatigue life of hot mix asphalt. Cold Regions Science and Technology, 110: 59-66. https://doi.org/10.1016/j.coldregions.2014.11.010
[16] NF EN196-1. (2016). Methods of testing cement - Part 1: Determination of strength. AFNOR.
[17] Klemm, W. (2017). Cement kiln dust: A look at its uses and characteristics. Proceedings of the 29th International Cement Seminar, Rock Product, San Francisco, California, U.S.A.
[18] NF EN 196-3:2017. (2017). Methods of testing cement - Part 3: determination of setting times and soundness. AFNOR.
[19] Barbara, L.D., Christine, M.C. (2020). X-ray Powder Diffraction (XRD). Science Education Resource Center.
[20] Schwartz, D. (2015). ITWG guideline on powder x-ray diffraction (XRD)-general overview. Lawrence Livermore National Laboratory.
[21] ISO 13320:2020. (2020). Particle size analysis-Laser diffraction methods. Edition 2, Technical comittee: ISO/TC 24/SC 4 Particle characterization.
[22] Siddique, R., Rajor, A. (2012). Use of cement kiln dust in cement concrete and its leachate characteristics. Resource, Conservation and Recycling, 61: 59-68. https://doi.org/10.1016/j.resconrec.2012.01.006
[23] NF EN 1097-6. (2014). Essais pour déterminer les caractéristiques mécaniques et physiques des granulats - Partie 6 : détermination de la masse volumique réelle et du coefficient d'absorption d'eau. AFNOR.
[24] NF EN 933-1. (2012). Essais pour déterminer les caractéristiques géométriques des granulats - Partie 1: détermination de la granularité - Analyse granulométrique par tamisage. AFNOR.
[25] ISO 679: 2009. (2009). Methods of testing cements. Determination of strength. ISO, 2009 Edition 1, Technical comittee: ISO/TC 74 Ciment and lime.
[26] NF P15-403. (1963). Liants hydrauliques. Technique des essais. Sable normal et mortier normal. AFNOR.
[27] Dreux, G. (1982). Composition des bétons. Techniques de l’Ingénieur, traité Construction, C 2 220: 1-15.
[28] El-Sayed, H.A., Gaber, N.A., Hanafi, S., Mhran, M.A. (1991). Reutilization of by-pass kiln dust in cement manufacture. International Conference on Blended Cement in Construction, Sheffield, UK.
[29] Al-Harthy, A., Taha, R., Al-Maamary, F. (2003). Effect of Cement Kiln Dust (CKD) on mortar and concrete mixtures. Construction and Building Materials, 17(5): 353-360. https://doi.org/10.1016/S0950-0618(02)00120-4
[30] Batis, G., Rakanta, E., Sideri, E., Chniotakis, E., Papgeorgiou, A. (2002). Advantages of simultaneous use of cement kiln dust and blast furnace slag. International Conference on Challenges of Concrete Construction, University of Dundee, UK.
[31] Maslehuddin, M., Al-Amoudi, O., Rahman, M., Ali, M., Barry, M. (2009). Properties of cement kiln dust concrete. Construction and Building Materials, 23: 2357-2361.
[32] Marku, J., Dumi, I., Lico, E., Dilo, T., Cakaj, O. (2012). The characterization and the utilization of Cement Kiln Dust (CKD) as partial replacement in mortar and concrete production. Zastita Materijala, 53(4): 334-344.
[33] NF EN 771- 3. (2011). Specification for masonry units — Part 3: Aggregate concrete masonry units (Dense and lightweight aggregates). AFNOR.
[34] NF EN 772-1. (2001). Méthodes d'essai des éléments de maçonnerie - Partie 1: Détermination de la résistance à la compression. AFNOR.