Effect of Bi2O3 on Physical and Luminescence Properties of Unconventional Bi/Er Co-Doped Sb2O3-WO3-Li2O Glasses

Abdelhakim Bedra | Mohamed Toufik Soltani*
© 2022 IIETA. This article is published by IIETA and is licensed under the CC BY 4.0 license (http://creativecommons.org/licenses/by/4.0/).
OPEN ACCESS
New glasses in the system (80-x) Sb2O3-10WO3-10Li2O co-doped with Bi3+/Er3+ were synthesized using the melt quenching method. The Er3+ concentration was kept constant at 0.25 (mol. %) and the Bi2O3 content takes the values 0.5, 1, 1.5 and 2 (mol. %) in order to elucidate the effect of the Bi2O3 concentration on the measured physical and optical properties of the glasses studied. The pulse echo method of the propagation of ultrasound in these glasses has been used to determine the elastic modules (E, G, K and L) and Poisson ratio. The introduction of Bi2O3 in these glasses increases the thermal stability factor of the glass from 152 to 183°C with an increase in Tg from 275 to 285°C. The UV-Vis cutoff of these glasses redshifts from 408 to 413 nm with a reduction of the indirect band gap from 2.72 to 2.62 ev and a small Urbach energy close to 0.125 nm resulting in small electronic defects in these glasses. The refraction index was found high with small variations in the range [1.965-1.975]. The emission spectra of Er3+ ions in these glasses gave an intense green laser line at 544 nm for an excitation at 488 nm. Moreover, the addition of more Bi2O3, considerably improves this laser line. However, the OH content in these glasses increases with the increase in Bismuth content related probably to the introduction of atmosphere moisture during the synthesis of these glasses. Therefore, the addition of Bi2O3 improves the various physical properties of these glasses making them good candidates for optical applications.
antimony glass, optical band gap, elastic modules, Poisson’s ratio, laser
The demand for glass compositions suitable for optical applications is constantly increasing. Over the past few decades, antimony oxide as an important heavy metal oxide glass (HMOG) family has shown great promise for applications in nonlinear optical devices such as ultrafast switches and power limiters [1-3]. They have also interesting potential in laser applications such as near infrared amplifier in WDM applications [4-7]. This is mainly due to its low phonon energy, high refractive index and its high thermal stability allowing fiber drawing and the introduction of large proportions of dopants such as rare earths or [7-9]. Besides their good fluorescence in the visible or in infrared range [10, 11], the addition of different metal oxides such as TiO2 or Bi2O3 significantly improves the chemical durability of glasses due to their relatively stable crosslinked bonds [10, 12]. Bi2O3 can decrease the phonon energy of the glass and therefore improve fluorescent efficiency [13]. Bi2O3 has been reported to occupy both lattice-forming and lattice-modifying positions in oxide glasses, which improves their mechanical strength, thermal stability, chemical durability and ease of fabrication [10, 14]. Therefore, glasses containing Bi2O3 are good candidates for practical applications.
In this paper, we are mainly interested in the effect of bismuth oxide concentration on the luminescence, thermal, elastic and optical properties of new alkali-antimony glasses in the system (80-x) Sb2O3-10WO3-10Li2O-0.25Er2O3-xBi2O3.
The physical properties of these measured glasses relate to the characteristic temperatures of the glasses, their densities, their molar volumes. The optical properties, relating to the absorption spectra, were measured to determine their cut-offs in the UV-Visible range as well as their band gap energy and their refractive index by using the theory of Mott and Davis [15]. Moreover, the elastic modules were measured by the ultrasonic method to evaluate E the Young’s modulus, G the shear modulus, K the bulk modulus, L the longitudinal modulus, and ν the Poisson’s ratio the stiffness of the glassy structure.
Glasses in the chemical composition (80-x) Sb2O3-10WO3-10Li2O3-xBi2O3 doped with 0.25 mol% Er2O3, were prepared by the conventional melt-quenching method and referred to as SBix as mentioned in Table 1 where x=0.5, 1, 1.5 and (2 mol.%). The starting materials used in the preparation of these glasses are commercial powders of (Sb2O3, WO3, Li2O3, Bi2O3 and Er2O3) supplied by (Sigma Aldrich), with a 99.96 % purity. After weighing and mixing, batches (taken in molar %) of 5 g in weight were melted in silica crucibles at approximately 900-1000°C for 10-16 min in air under flame heat. Glass samples were obtained by casting the homogeneous molten onto preheated cylindrical molds, followed by annealing at 270°C in an electric furnace and slow cooling to room temperature. A polishing was then carried out to obtain samples having a surface and a thickness suitable for optical and elastic measurements.
Table 1. Glass ID of SBix glasses
|
Glass ID |
Composition (mol.%) |
||||
|
Sb2O3 |
Li2O |
WO3 |
Bi2O3 |
Er2O3 |
|
|
SBi0.5 |
79.25 |
10 |
10 |
0.5 |
0.25 |
|
SBi1 |
78.75 |
10 |
10 |
1 |
0.25 |
|
SBi1.5 |
78.25 |
10 |
10 |
1.5 |
0.25 |
|
SBi2 |
77.75 |
10 |
10 |
2 |
0.25 |
The density ρ of the glass was measured using the Archimedes method using an Ohaus Adventurer AX type microbalance with a sensitivity of 10-4(g) and pure water as the immersion liquid, where ± 0.002% is achieved. The densities of glasses ρg were calculated using the following relation with an accuracy of approximately ± 0.002% [16].
ρg=Mair/(Mair-Mwater) (1)
where Mair and Mwater are the weight of the glass sample in air and in distilled water respectively. The molar volume Vm is calculated using Eq. [15]:
Vm=∑Xi Mi/ρ (2)
where, Xi is the molar fraction of each oxide, Mi is its molecular weight and ρ is the glass density. The thermal characterizations include the temperature of glass transition, Tg, crystallization temperature, Tx, and peak crystallization temperature, Tpof SBix glasses. They are determined by differential scanning calorimeter (DSC) using SETARAM labsys evo, with a heating rate of 10oC/min in the temperature range of 25-500oC and using alumina pans under argon gaz. The absolute uncertainty on the measurement is estimated to be less than ±2°C for Tg and Tx, and ±1°C for Tp. The glass transmittance spectra were recorded using a Perkin Elmer Lambda 35 UV/Vis spectrophotometer in the 200-1100 nm range and with a Perkin Elmer Spectrum two spectrophotometer in the infrared within the range [8500-400 cm-1].
The elastic modules are measured using the pulse-echo set up. It consists by a high-powered ultrasound pulse receiver (Olympus N DT, 5900 PR, USA) that uses, X and Y-segment quartz transducers of 10 MHz linked to a digital storage oscilloscope (Lecroy, Wave Runner 104). MXi 1GHz, USA) to record the ultrasound signals. The ultrasound velocity is calculated according to the equation V=2e/T. Where e is the sample thickness (measured with an accuracy of ±0.005 mm) and T is the time interval between two successive echoes (measured with an accuracy of ±0.01μs) [8]. All elastic modules and related parameter are calculated by using the experimental values of longitudinal and transverse velocities using the following relations [8]:
L=ρVL2 (3)
G=ρVT2 (4)
K=L-(4/3)G (5)
E=(1+v)2G (6)
v=(L-2G)/2(L-G) (7)
where, L is the longitudinal modulus, G is the shear modulus, K is the bulk modulus, E is the Young's modulus and n is the Poisson's ratio. In the above relations, ρ is the density and VL and VT are the longitudinal and shear sound velocities, respectively. The photoluminescence measurements include excitation and emission spectra were recorded at ambient temperature using Horiba Yvon spectrofluorometer FLUOROMAX 4P. A xenon lamp (150 w) was used as excitation source and the excitation wavelength fixed at 488 nm.
3.1 Density and molar volume
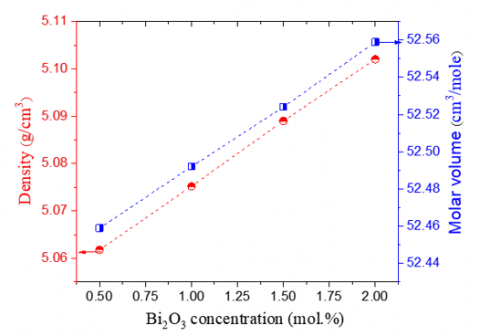
The obtained values of density are given with an estimated uncertainty of ±0.002 g/cm3 are listed in Table 2 jointly with the molar volume. Their compositional dependence is shown in Figure 1, despite the incorporation of small amounts of Bi2O3, an increase in density from 5.061 to 5.102 (g.cm-3) is obtained. This increase in density obeys to the additive density rule, since the density of Bi2O3 8.9 (g.cm-3) is greater than that of Sb2O3 5.07 (g cm-3) [17]. Therefore, the addition of Bi2O3 makes the glass denser. On the other hand, the monotonic increase in molar volume from 52.459 to 52.559 (cm3/mol.) with the addition of the Bi2O3 content, is mainly caused by an increase in the interatomic spacing in the glass since the ionic radii of Bi is greater than that of antimony in the order RBi3+ (1.20 Å) ˃ RSb3+ (0. 74 Å) [18].
Figure 1. Compositional dependence of density and molar volume in SBix glasses. Lines are drawn as a guide for the eye
3.2 Thermal properties
The DSC thermograms of the SBix glasses are illustrated in Figure 2. They show that the endothermic peak of the glass transition temperature increases from 278 to 285°C with the increase in Bi2O3 content. The observed slope of the crystallization peak suggests that Tp values are over 500°C. In fact, all the glasses present two crystallization events with a pronounced intensity for the second. According to earlier studies on alkali-antimonate glasses [1], the first observed crystallization event at 400°C is limited and does not correspond to bulk crystallization but, possibly relates to surface heterogeneous nucleation in the DSC cell. Accordingly, the Tx values are measured using the slope of the second crystallization event.
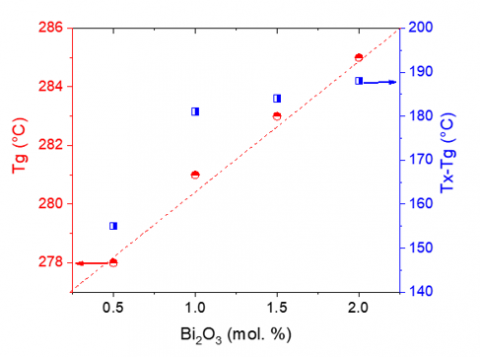
The measured characteristic temperatures Tg, Tx and ΔT=(Tx-Tg) values together with Er3+ concentrations are summarized in Table 2 and the compositional dependence of Tg with the thermal stability factor ΔT are drawn in Figure 3. The obtained thermal stability factor ΔT is more than 150°C and increases with increasing Bi2O3 suggesting that these glasses are very stable towards crystallization. It can be concluded that the incorporation of Bi2O3 in these glasses increases slightly the temperature of the glass transition with a linear trend but enhance considerably the thermal stability.
Figure 2. DSC scans of SBix antimony oxide glasses. (*) represents the first crystallization event
Table 2. Er3+ concentration (N), density, molar volume (Vm), Tg and Tx temperatures and thermal stability factor ∆T of SBix glasses
|
Glass ID |
N |
Density |
Vm |
Tg |
Tx |
∆T |
|
|
(*10-20 cm-3) |
(g/cm3) |
(cm3/g) |
(°C) |
||
|
SBi0.5 |
0.5734 |
5.061 |
52.459 |
278 |
433 |
155 |
|
SBi1 |
0.5721 |
5.075 |
52.492 |
281 |
462 |
181 |
|
SBi1.5 |
0.5702 |
5.089 |
52.524 |
283 |
467 |
184 |
|
SBi2 |
0.5684 |
5.102 |
52.559 |
285 |
473 |
188 |
Figure 3. Variation of Tg and ∆T in SBix glasses. Line is drawn as a guide for the eye
3.3 Optical properties
3.3.1 Absorption in the UV-Vis range
The absorption coefficient spectra of SBix glasses are measured at room temperature. As an example, the spectrum of SBi0.5 is showed in Figure 3.
In all spectra, seven peaks were observed in the 450-1700 nm range and are located at 1530, 976, 798, 654, 544, 522 and 490 nm. They are assigned to the internal transitions of the 4f11 configuration of the Er3+ ion which correspond to the absorptions of the 4I15/2 ground state to the excited states 4I13/2, 4I11/2, 4I9/2, 4F9/2, 4S3/2, 2H11/2 and 4F7/2 respectively. The 4I15/2-4I13/2 transition is characterized by an overlapping double peak structure around 1530 nm, which is due to the simultaneous contributions of the magnetic dipole and the electric dipole [7].
As seen in Table 1, although the concentration of erbium ions gradually decreases from 0.5734 to 0.5684.10-20 cm-3 with the increasing content of Bi2O3, the intensity of the 4I15/2-4I13/2 transition in contrast, shows an unexpected increase as seen in the inset of Figure 4, suggesting that the incorporation of Bi2O3 affect considerably the environment of erbium ions. In addition, the limit of transparency in the UV-Vis region of the glasses studied is located at~412 nm. It is also noted that the absorption lines are broad, confirming the amorphous character of the glasses studied and the absence of a crystalline structure around the Er3+ sites.
Figure 4. Optical absorption coefficient spectra of the Er3+ ions doped SBi0.5 glass within 450-1700 nm range. Inset: Absorption coefficient of the 4I15/2-4I13/2 transition of Sbix glasses
3.3.2 Optical band gap, Urbach energy analysis and refractive index
The cutoff at short wavelengths or optical band gap in glasses is usually located in the UV-Vis range; it is due to electronic order transitions of the glass matrix. The energy of the smallest wavelength that the glass transmits corresponds to the gap energy between the conduction and the valence band of the glass. For more short wavelengths, the energy of the radiation is absorbed by transition between these two bands, and the glass is no longer transparent. Indeed, several optical parameters depend on the glass transparency cut-off frontier, among them the optical band gap, the Urbach energy and the refractive index. They can be calculated simply by measuring the optical absorption of the glass [17].
The absorption coefficient α for no crystalline materials and at high absorption level (α˃104 cm-1), has the following frequency dependence expressed by the so called Tauc model [17-19]:
αhν=B(hν-Eg)r (8)
where B: is a constant which depends on the transition probability, ν: is the angular frequency of the incident photon, Eg: is the optical gap, r: an exponent that characterizes the transition process. r=2 for indirect permitted transitions, and r =1/2 for direct permitted transitions giving $\mathrm{E}_{\mathrm{g}}^{\mathrm{dir}}$ and $\mathrm{E}_{\mathrm{g}}^{\text {ind }}$ respectively. $\mathrm{E}_{\mathrm{g}}^{\mathrm{dir}}$ and $\mathrm{E}_{\mathrm{g}}^{\mathrm{ind}}$ were obtained by extrapolation of the straight lines from the curves representing (αhν)2 or (αhν)1/2 (vs hv) respectively to intersect the photon energy axis at zero absorption [19]. At low absorption region (α<104 cm-1), the absorption coefficient is governed by the Urbach rule [20]:
$\ln \alpha=(\mathrm{h} v / \Delta \mathrm{E})-\mathrm{C}$ (9)
where ΔE is the Urbach energy and represent the width of the tail of localized states in the forbidden band gap and C is a constant. The Urbach energy values were calculated from inverse of the slope of the extrapolation of the linear part of the ln (α) vs hν curves [21].
The values of the optical band gap $\mathrm{E}_{\mathrm{g}}^{\text {ind }}$ decreased from 2.70 to 2.62 eV and the UV-Vis cut-off of the absorption edge red-shifts with increasing Bi2O3 content in the glass. The reduction in optical gap is attributed to structural changes that occur in the glass. Indeed, the introduction of low content of Bi2O3 probably includes the appearance of a number of non-binding electrons of non-bridging oxygen (NBO), which has the effect of reducing Eg. The values of the optical gap in all our samples showed that the absorption limit in the UV-Visible range of SBix glasses is located at ~ 411 nm; this means that these glasses are opaque to UV and appeared with a yellowish color.
Figure 5. Variations of the indirect optical band gap and the Urbach energy of SBix glasses. Lines are drawn as a guide for the eye
While the Urbach's energy values slightly increase from 0.133 to ~ 0.137 (ev) to give practically a constant value if we take into account the error range (0.001 ev). Urbach energy generally expresses the scale of disorder in the system; therefore, low values of ΔE indicate that the defect centers in these glasses are smaller [22].
According to reference [23], the refractive index can be calculated from the optical absorption edges using the Tauc model by the expression:
$\frac{n^2-1}{n^2+1}=1-\sqrt{\frac{\mathrm{E}_{\mathrm{opt}}^{\text {ind }}}{20}}$ (10)
where, n is the refractive index and $E_{\mathrm{g}}^{\text {ind }}$ is the indirect optical band gap energy. All the values of the optical parameters described below are listed in Table 3 and the compositional dependence of the optical band gap and Urbach energy are showed in Figure 5. The values of refraction indices increase slightly with Bi2O3 and were found in the same order but higher than in similar alkali-antimony glasses in the Sb2O3-N2O-ZnO and Sb2O3-Na2O-WO3-PbO systems [7, 22].
Table 3. Values of UV-Vis cut-off (in nm and ev), optical gap energies (ev), Urbach energies (ev) and refractive index n of SBix glasses
|
Sample |
UV cut-off (nm) (ev) |
$E_{\mathrm{g}}^{\mathrm{dir}}$ ±0.02 |
$E_{\mathbf{g}}^{\text {ind }}$ ±0.02 |
ΔE ±0.001 |
n |
|
|
SBi0.5 |
411 |
3.020 |
2.60 |
2.59 |
0.133 |
2.132 |
|
SBi1 |
412 |
3.012 |
2.59 |
2.58 |
0.135 |
2.134 |
|
SBi1.5 |
414 |
2.998 |
2.58 |
2.57 |
0.138 |
2.137 |
|
SBi2 |
413 |
3.005 |
2.54 |
2.55 |
0.137 |
2.147 |
3.3.3 Absorption in the IR range
In glasses, the infrared transmission limit called the multiphonon cut-off is due to the contribution of the different vibrations of the fundamental chemical bonds and their different harmonics. The absorption wavelength of a bond is expressed by:
$\lambda=2 \pi \mathrm{c} \sqrt{\frac{\mu}{k}}$ (11)
where c is the speed of light, µ is the reduced mass, and k is the force constant of cation-anion pair. If we incorporate heavy elements in the glass, we increase the reduced mass of the bond so we push the cut-off wavelength towards long wavelengths. As a result, the optical window of heavy oxide glasses such as Sb2O3 (mainly related to Sb-O vibrational modes) extends much further into the infrared up to 8µm [24] and the phonon energy lies at ~600 cm-1 [25]. however, old traditional glasses such as SiO2, P2O5 or B2O3 have high phonon and their multiphonon cut-off is less than 5µm [1].
Figure 6. UV-Vis-IR transmission of SWL(x)Bi 0.5 glasses
The transparency of the studied glasses goes up to 7.5 µm (Figure 6). It is limited by certain bands of extrinsic vibrations which appear in the optical window of the glass and which limit the cut-off wavelength in the infrared region.
All the observed bands are of extrinsic origin. The first band which is located at 3 µm is due to the presence of O-H type of hydroxyl groups, indicating the presence of water molecules in our glasses. This contamination has two different origins: water adsorbed by the raw materials and contamination by the humidity of the air during the synthesis giving a second strong visible band at 6.7 µm near the multiphonon cut-off limit. This band is present in practically all different types of glasses, which is due to contamination by water during the synthesis of glasses. A third band at 4.2 µm represents a small transmission disturbance is due to CO2 which usually comes from the atmosphere of the spectrophotometer measurement cell. The band present at 5.4 μm is due to Si-O vibrations, originating from the contamination of the fusion bath with the silica of the crucibles used [1]. Finally, the last band located at 5.7 µm could be well linked to the second harmonic of the W-O vibrations present in the main structure of these glasses [16].
The absorption coefficient of the OH group vibrational band (αOH) around ~ 3000-3500 cm-1, reflects the content of OH groups in materials given by [9]:
αOH=lg(T0/TD)/d (12)
where T0 is the highest transmission value at ~ 4000 cm-1, TD is the glass transmission at~3265 cm-1, and d is the thickness of the sample. The concentration of OH content can be estimated by the following equation [26]:
NOH(in ppm)=30(ppm.cm-1)×αOH(cm-1) (13)
Table 4. Variation of αOH and NOH as a function of erbium concentration in SWL(x)Bi Er glass
|
Glass |
αOH (cm-1) |
OH content (in ppm) ±0.02 |
|
SBi0.5 |
3.59 |
107.7 |
|
SBi1 |
3.67 |
110.1 |
|
SBi1.5 |
3.83 |
114.9 |
|
SBi2 |
4.40 |
132.0 |
The absorption coefficient of OH groups and the NOH content in the Er3+ doped SBix glasses show a small increase with increasing Bi2O3 content from 107 to 132 (ppm) as listed in Table 4. It is related to the increase of the time exposure during the melt of the glass. A high proportion of Bi2O3 requires a long time to reach batch melting, and therefore a large amount of OH can be introduced into the melt by absorbing water molecules from the air before glass quenching.
The non-radiative transitions in rare earth doped materials are mainly attributed to two important reasons. The energy transfer between Er3+ concentration and the energy transfer between Er3+ and hydroxyl groups. Therefore, an increase in the concentration of OH- ions in the sample increases the non-radiative decay of Er3+: 4I13/2-I15/2 transition in glasses and reduce the quantitative yield. For laser and fluorescence applications, the elimination of the (OH) bands could be carried out by setting up an appropriate experimental protocol [9].
3.4 Elastic properties
The measurements of the elastic modules E, G, K, L and ν were carried out by ultrasonic echography using the pulse-echo method. Its principle is based on measuring the velocity of the propagation of an ultrasonic wave’s (VL for longitudinal wave and VT for transverse wave) in the glass having a known thickness.
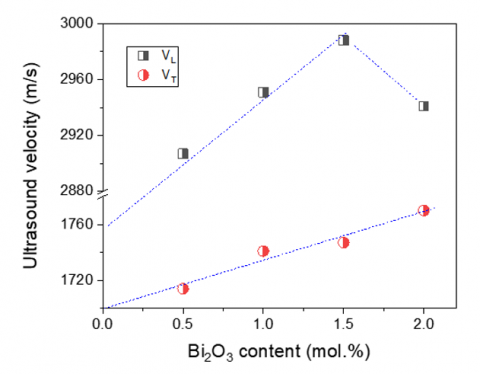
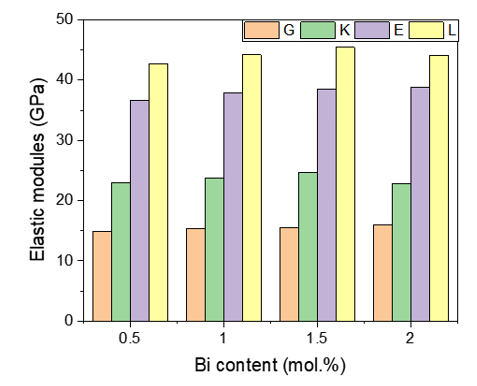
According to obtained results, both VL and VT increase simultaneously with the increase of Bi2O3. As seen in Figure 7. The increase in the longitudinal velocity is more pronounced than the transverse velocity. We can note that VL has a maximum value for SBi1.5. Moreover, the subsequent increase of the density of the glasses leads to the increase in the elastic modules as reported in Table 5. Young's modulus expresses the ability of a material to deform under the effect of an applied stress. Young's modulus is higher as long as the deformation is minimal. As a result, the sound velocity is the faster as the material is more compact. Accordingly, the values of the obtained Young modulus are increasing in the range [36.68 to 38.87 GPa] when the amount of Bi2O3 in the glass passes from 0.5 to 2 (mol.%). These values are of the same order as the antimony-zinc and tellurite glasses [8]. We can also see here that the small addition of Bi2O3, increases the young modulus. It should also be noted that the behavior of the variation of the Young's modulus is similar to the temperature of the glass transition. Indeed, the rise in glass transition temperature has always been relayed to the reinforcement of the vitreous structure and to increase its rigidity.
The longitudinal modulus L translates the deformations caused by the deformations of the stretching mode accompanied by a change in volume, which lets L take significant values. On the contrary, the shear modulus G takes into account the transverse deformations of the structural units of the glass. L and G follow the same Young's modulus behavior, i.e., they increase with increasing amount of Bi2O3 in the glass. The compositional dependence of the elastic modules is illustrated in Figure 8.
Poisson's ratio is the ratio of longitudinal strain to transverse strain. It characterizes the contraction of a material perpendicular to the direction of the applied force, which means that there is a relationship between the Poisson's ratio and the structure of the glass. For glasses, the Poisson's ratio takes values between 0.15 and 0.3 [8]. If each deformation is caused only by stretching deformations, the Poisson's ratio is close to 2.5. If there is bending deformations of the structural units in the glass, ν then becomes less than 0.25. But the presence of large ions in glasses, therefore deformable, ν can then become greater than 0.25. A low Poisson's ratio means that for a given elongation there is only a weak transverse contraction, therefore a rigid vitreous structure. Apart from the SBi2 glass which has a Poisson's ratio equal to ν=0.216, the other glasses have values almost similar and close to the value of 0.24 but less than 0.25. This means that the sudden elastic deformations in the glass are of a bending nature.
Figure 7. Variations of sound velocities VL and VT in Sbix glasses. Line is drawn as a guide for the eye
Table 5. Experimental density, sound velocities VL, VT, elastic modules L, G, K, E and Poisson’s ratio ν of SBix glasses
|
Glass ID |
SBi0.5 |
SBi1 |
SBi1.5 |
SBi2 |
|
ρ (Kg/m3) |
5061 |
5075 |
5089 |
5102 |
|
VL (m/s) |
2907 |
2951 |
2988 |
2941 |
|
VT(m/s) |
1714 |
1741 |
1747 |
1770 |
|
L (GPa) |
42.76 |
44.20 |
45.43 |
44.13 |
|
E (GPa) |
36.68 |
37.93 |
38.50 |
38.87 |
|
G (GPa) |
14.87 |
15.38 |
15.53 |
15.98 |
|
K (GPa) |
22.94 |
23.69 |
24.72 |
22.82 |
|
ν |
0.233 |
0.233 |
0.240 |
0.216 |
Figure 8. Compositional dependence of elastic modules in SBix glasses
3.5 Visible luminescence
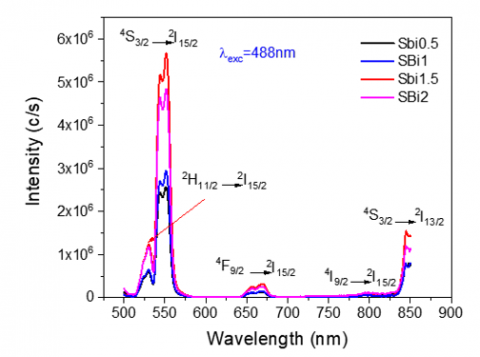
Figure 9. Visible luminescence of Er3+ doped SBix glasses
The emission bands due to 4f-4f transitions that could be excited by 488 nm line have been measured at room temperature and shown in Figure 9. Five emission bands are found. They are located at 530, 544, 670, 799 and 845 nm and correspond to the emission (2H11/2→ 4I15/2), (4S3/2→ 4I15/2), (4F9/2 → 4I15/2), (4I9/2 → 4I15/2) and (4S3/2→ 4I13/2) transitions respectively. It is clearly seen that the green emission 4S3/2→ 4I15/2 is the most intense. However, the unexpected 4S3/2→ 4I13/2 emission is observed in these glasses. As we have already exposed in section 3.3.1, the incorporation of Bi2O3 significantly affects the environment of erbium ions and therefore the emission obtained for the different glasses confirms that the increase in bismuth ions increases the intensity of emission to take a maximum at 1.5 (mol.%) as was also observed for the different properties measured in this study. However, the presence of OH groups in the glasses reduces extremely the laser efficiency in optical devises spatially in telecommunication by optical fiber [26-29]. Additionally, ultrasonic testing and good luminescence performance make these glasses good candidates for future materials [30, 31].
New antimony oxide glasses in the composition (80-x) Sb2O3-10WO3-10Li2O3-xBi2O3 doped with 0.25 mol% Er2O3 has been successfully synthesized. The different results obtained in this study are influenced by the amount of Bi2O3 incorporated into the glass. The optical energy gap (Eop) decreases slightly with the introduction of Bismuth oxide (Bi2O3) with an almost constant but low level Urbach energy giving less distortion and electronic defects and thus improving optical quality. On the other hand, the elastic modules obtained also increase with the increase of Bi2O3 together as well as the temperature of glass transition Tg giving a rigid structure with the addition of more Bi2O3 contained in the glass. The emission spectra of the glasses show also that adding more Bi2O3, dramatically increases the intensity of the green laser band at 544nm when the samples are excited at 488nm.
[1] Soltani, M.T., Boutarfaia, A., Makhloufi, R., Poulain, M. (2003). New alkali antimonate glasses. Journal of Physics and Chemistry of Solids, 64(12): 2307-2312. https://doi.org/10.1016/S0022-3697(03)00220-8
[2] Lezal, D., Pedlikova, J., Kostka, P., Bludska, J., Poulain, M., Zavadil, J. (2001). Heavy metal oxide glasses: preparation and physical properties. Journal of Non-Crystalline Solids, 284(1-3): 288-295. https://doi.org/10.1016/S0022-3093(01)00425-2
[3] Falcão-Filho, E.L., de Araújo, C.B., Bosco, C.A.C., Maciel, G.S., Acioli, L.H., Nalin, M., Messaddeq, Y. (2005). Antimony orthophosphate glasses with large nonlinear refractive indices, low two-photon absorption coefficients, and ultrafast response. Journal of Applied Physics, 97(1): 013505. https://doi.org/10.1063/1.1828216
[4] Minelly, J., Ellison, A. (2002). Applications of antimony-silicate glasses for fiber optic amplifiers. Optical Fiber Technology, 8(2): 123-138. https://doi.org/10.1016/S1068-5200(02)00004-4
[5] Ouannes, K., Soltani, M.T., Poulain, M., Boulon, G., Alombert-Goget, G., Guyot, Y., Pillonnet, A., Lebbou, K. (2014). Spectroscopic properties of Er3+-doped antimony oxide glass. Journal of Alloys and Compounds, 603: 132-135. https://doi.org/10.1016/j.jallcom.2014.02.008
[6] Zavadil, J., Ivanova, Z.G., Kostka, P., Hamzaoui, M., Soltani, M.T. (2014). Photoluminescence study of Er-doped zinc-sodium-antimonite glasses. J. Alloys Comp., 611: 111. https://doi.org/10.1016/j.jallcom.2014.05.102
[7] Hamzaoui, M., Soltani, M.T., Baazouzi, M., Tioua, B., Ivanova, Z.G., Lebullenger, R., Poulain, M., Zavadil, J. (2012). Optical properties of erbium doped antimony based glasses: Promising visible and infrared amplifiers materials. Physica Status Solidi (b), 249(11): 2213-2221. https://doi.org/10.1002/pssb.201248271
[8] Hamzaoui, M., Azri, S., Soltani, M.T., Lebullenger, R., Poulain, M. (2013). Thermal and elastic characterization of Sb2O3-Na2O-ZnO glasses. Physica Scripta, 2013(T157): 014029. https://doi.org/10.1088/0031-8949/2013/T157/014029
[9] Baazouzi, M., Soltani, M.T., Hamzaoui, M., Poulain, M., Troles, J. (2013). Optical properties of alkali-antimonite glasses and purified processes for fiber drawing. Optical Materials, 36(2): 500-504. https://doi.org/10.1016/j.optmat.2013.10.017
[10] Dubuis, S., Messaddeq, S.H., Ledemi, Y., Côté, A., Messaddeq, Y. (2021). Effect of Bi2O3 on the physical, structural and NIR emission properties of BGG glasses prepared using different melting atmospheres. Optical Materials Express, 11(8): 2560-2575. https://doi.org/10.1364/OME.430811
[11] Moulton, P.F. (1986). Spectroscopic and laser characteristics of Ti: Al2O3. Josa B, 3(1): 125-133. https://doi.org/10.1364/JOSAB.3.000125
[12] Es-Soufi, H., Bih, L. (2021). Effect of TiO2 on the chemical durability and optical properties of Mo-based phosphate glasses. Journal of Non-Crystalline Solids, 558: 120655. https://doi.org/10.1016/j.jnoncrysol.2021.120655
[13] Li, X., Nie, Q., Dai, S., Xu, T., Lu, L., Zhang, X. (2008). Energy transfer and frequency upconversion in Ho3+/Yb3+co-doped bismuth-germanate glasses. Journal of Alloys and Compounds, 454(1-2): 510-514. https://doi.org/10.1016/j.jallcom.2007.02.143
[14] Baia, L., Stefan, R., Popp, J., Simon, S., Kiefer, W. (2003). Vibrational spectroscopy of highly iron doped B2O3–Bi2O3 glass systems. Journal of Non-Crystalline Solids, 324(1-2): 109-117. https://doi.org/10.1016/S0022-3093(03)00227-8
[15] Mott, N.F., Davis, E.A. (2012). Electronic processes in non-crystalline materials. Oxford University Press.
[16] Ersundu, A.E., Çelikbilek, M., Baazouzi, M., Soltani, M. T., Troles, J., Aydin, S. (2014). Characterization of new Sb2O3-based multicomponent heavy metal oxide glasses. Journal of Alloys and Compounds, 615: 712-718. http://dx.doi.org/10.1016/j.jallcom.2014.07.024
[17] Hasegawa, H., Stone, M., Imaoka, M. (1978). An X-ray diffraction study of the structure of vitreous antimony oxide. Phys. Chem. Glasses., 19(2): 28-33.
[18] Shannon, R.D. (1976). Revised effective ionic radii and systematic studies of interatomic distances in halides and chalcogenides. Acta Crystallographica Section A: Crystal Physics, Diffraction, Theoretical and General Crystallography, 32(5): 751-767. https://doi.org/10.1107/S056773947600155
[19] Saito, K., Ikushima, A.J. (2000). Absorption edge in silica glass. Physical Review B, 62(13): 8584. https://doi.org/10.1103/PhysRevB.62.8584
[20] Tauc, J. (1969). Optical properties and electronic structure of amorphous semiconductors. Optical Properties of Solids, 123-136. https://doi.org/10.1007/978-1-4757-1123-3_5
[21] Urbach, F. (1953). The long-wavelength edge of photographic sensitivity and of the electronic absorption of solids. Physical Review, 92(5): 1324. https://doi.org/10.1103/PhysRev.92.1324
[22] Suthanthirakumar, P., Marimuthu, K. (2016). Investigations on spectroscopic properties of Dy3+ doped zinc telluro-fluoroborate glasses for laser and white LED applications. Journal of Molecular Structure, 1125: 443-452. https://doi.org/10.1016/j.molstruc.2016.06.080
[23] Dimitrov, V., Sakka, S. (1996). Electronic oxide polarizability and optical basicity of simple oxides. I. Journal of Applied Physics, 79(3): 1736-1740. https://doi.org/10.1063/1.360962
[24] Dubois, B., Aomi, H., Videau, J.J., Portier, J., Hagenmuller, P. (1984). New oxyhalide glasses involving Sb2O3. Materials Research Bulletin, 19(10): 1317-1323. https://doi.org/10.1016/0025-5408(84)90194-6
[25] Som, T., Karmakar, B. (2009). Green and red fluorescence upconversion in neodymium-doped low phonon antimony glasses. Journal of Alloys and Compounds, 476(1-2): 383-389. https://doi.org/10.1016/j.jallcom.2008.09.006
[26] Toratani, H., Meissner, H.E., Izumitani, T., Stokowski, S.E. (1987). Phosphate laser glass of absorption loss of 10-4 cm-1. Journal of Non Crystalline Solids, 95: 701-708. https://doi.org/10.1016/S0022-3093(87)80671-3
[27] Jiang, Y., Rhonehouse, D., Wu, R., Myers, M.J., Myers, J.D. (1995). Effect of OH-on fluorescence lifetime and laser performance of Er3+ glass. Chinese Journal of Lasers B, 4: 307-312.
[28] Yan, Y., Faber, A.J., De Waal, H. (1995). Luminescence quenching by OH groups in highly Er-doped phosphate glasses. Journal of Non-Crystalline Solids, 181(3): 283-290. https://doi.org/10.1016/S0022-3093(94)00528-1
[29] Snoeks, E., Kik, P.G., Polman, A. (1996). Concentration quenching in erbium implanted alkali silicate glasses. Optical Materials, 5(3): 159-167. https://doi.org/10.1016/0925-3467(95)00063-1
[30] Markja I., Dhoska K., Elezi D., Moezzi R., Petru M. (2021). Effect of the grain sizes on the ultrasonic propagation and attenuation on different types of steels microstructure during non-destructive testing. Annales de Chimie-Sciences des Matériaux, 45(4): 329-344. https://doi.org/10.18280/acsm.450408
[31] Shahmir, N. G., Bhat, M. (2020) Structural and luminance properties of light transmitting concrete. Annales de Chimie-Sciences des Matériaux, 44(3): 185-190. https://doi.org/10.18280/acsm.440305