Ali Bougharouat* | Nassim Touka | Dalila Talbi | Kamel Baddari
© 2021 IIETA. This article is published by IIETA and is licensed under the CC BY 4.0 license (http://creativecommons.org/licenses/by/4.0/).
OPEN ACCESS
The adhesive characteristics of sol-gel copper oxide (CuO) film surfaces at annealing temperatures ranging from 350 to 550°C were examined in this work. Hydrophobic properties of these oxide film surfaces were studied by contact angle measurements. The surface energy was calculated from contact angle data using harmonic mean method. The structural, morphological and chemical analysis of the samples were characterized by X-ray diffraction (XRD), scanning electron microscopy (SEM) and Fourier transform infrared (FTIR). The increase in annealing temperature induces a reduction in the hydrophilic properties of the films (adhesive properties). The rise in the hydrophobicity of the CuO surface has been claimed to be explained by a change in interfacial tension. The FTIR spectroscopy analysis revealed that the increase in the annealing temperature eliminates activated neutral species (hydroxyl groups) reacting with the surface of the sample responsible for the wettability. SEM analysis showed that the morphology of the samples is nanostructured containing agglomerates of various forms, a few hundred nanometers in size, randomly dispersed across the surface. The enhanced roughness of the produced film is primarily responsible for the increased hydrophobicity of the films. The XRD data reveal that the films are highly textured and that increasing the annealing temperature induces better layer crystallization and confirms the development of copper oxide CuO.
CuO thin films, sol-gel spin coating method, surface energy, wettability, adhesive properties
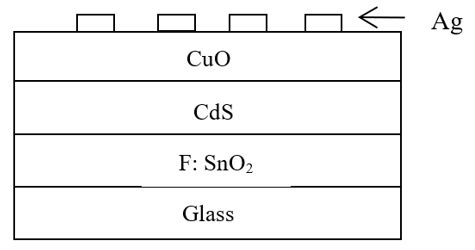
Due to their simplicity of fabrication and excellent efficiency, copper oxides have resurfaced as an important topic in low-cost solar cell applications (20 percent in Cu2O based cells). Because of the tiny band gap in its crystal structure, it has photocatalytic and photovoltaic capabilities [1-3]. According to recent studies, thin-film hetero-junction solar cells, such as Glass / F: SnO2 / CdS / CuO / Ag [2] or FTO / ZnO / Cu2O / Au [4], have shown increased solar energy conversion efficiency. Figure 1 depicts a framework used by Dolai et al. [2]. Condensation on solar cells prevents them from operating and drastically reduces power output. Super hydrophobic surfaces are useful for anti-corrosion and anti-fog applications in photovoltaic devices due to their water-removing properties [4, 5]. When exposed to the oxidant H2O2, a thin oxidized layer forms on the copper surface, altering the important characteristics. For example, the presence of copper oxide might result in high resistance and reliability concerns with the device. [5]. Because of the presence of hydroxyl groups M-OH, the surface of metallic oxide is often hydrophilic. Surface chemical groups can dissociate or interact with H+ and OH- ions from liquids. As a result, investigating the wettability of thin copper oxide films is critical. Although investigations of the adhesive capabilities of thin-film copper oxide surfaces have received minimal attention, more research is required to understand changes in the surfaces of these metal oxides. The two fundamental qualities that contribute to the formation of a hydrophobic layer are a rough micro or nanostructured surface roughness and non-polar surface chemistry. Surfaces have been created using a variety of techniques. They can be obtained as hydrophobic by operating in the liquid or vapor phases, as well as by physical or chemical procedures. The following are the most common liquid-route techniques: Chemical deposition in solution [6], electro-deposition via electrochemical synthesis [5], and the sol-gel method [7]. There is a distinction established by the vapor route between "PVD" physical methods and "CVD" chemical approaches.
Figure 1. Structure of Glass/F: SnO2/CdS/CuO/Ag hetero-junction solar cells [2]
In this study, copper oxide thin films prepared by the sol–gel method, have been deposed onto glass substrates by the spin coating technique. The wettability of the sol-gel oxide (CuO) film surfaces with varying annealing temperatures from350 to 550°C has been investigated. Hydrophobicity of these oxide film surfaces was studied by contact angle measurements. The surface energy of the oxide films was calculated from contact angle data using the harmonic mean method. Samples were characterized by scanning electron microscope (SEM), X-ray diffraction (XRD) and Fourier-transformed infrared (FTIR) spectroscopy methods.
2.1 Preparation of oxide (CuO) surfaces
2.1.1 Samples preparation
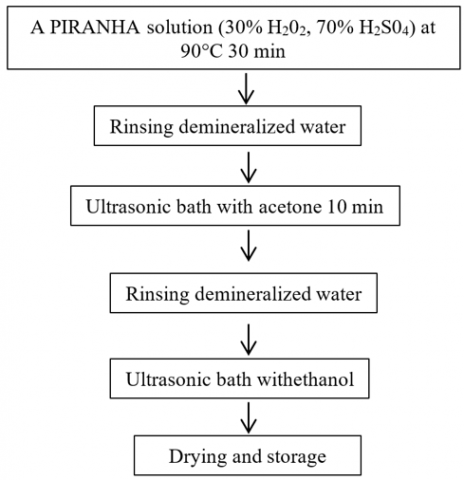
Copper oxide films were deposited on glass substrates by sol-gel spin coating process. Substrates shouldn’t include any grease, scratches and roughness to ensure wettability and uniform deposition thickness over all of their surfaces. The cleaning is done chemically by a selected process illustrated in Figure 2.
Figure 2. Substrate cleaning procedure
2.1.2 Sol–gel synthesis
To elaborate the thin films of pure CuO, two solutions have been prepared; for the first solution, in a 25 ml beaker, washed with distilled water and dried in an oven at 50℃, dissolved 2.5g of copper (II) chloride anhydrous (CuCl2) in 12 ml of methanol (CH4O), with constant magnetic stirring. Then, 190 μl of glycerol (C3H8O3) have been added to the solution. Another solution prepared with the dissolution in another beaker containing 12 ml of methanol and 880 μl of triethylamine (C3H9N) with 1 μl of HCl. The mixture of the two solutions should be stored for 24H at room temperature and under magnetic stirring. During the shaking, the beaker is covered to avoid any kind of contamination and evaporation of methanol.
2.1.3 Coating procedure
The solutions have been deposited on the glass substrate, which will spin at 3000 rpm for 50 sec using the spin coating apparatus. Drying is carried out immediately after deposition, in a branded oven Memmert UN55- 53L for 12 minutes at 110℃. After drying, the films are cooled in the open air. Finally, the films obtained must be placed in a Nabertherm P330 brand oven for annealing at 350, 450 and 550℃ for 1 hour.
2.2 Samples characterization
2.2.1 Contact angle
Contact angle measurements were performed at room temperature and atmospheric pressure using a sessile drop method. Two different liquids have been used: distilled water, and diiodomethane. The liquid drop (4 μl) was placed onto the copper oxide surface with a micro syringe. All contact angles data were averaged from five measurements with a standard deviation of approximately 5%.
2.2.2 Surface free energy and adhesion work
At thermodynamic equilibrium, the contact angle for a test liquid can be related to the surface free energy by Young's equation (Eq. (1)) [8]:
$\gamma_{l v} \cos \theta=\gamma_{s}-\gamma_{l s}$ (1)
where, γlv the surface free energy of the liquid, θ is the contact angle, γs is the surface free energy of the solid, and γls is the interfacial energy between solid–liquid. According to Fowkes’ theory, surface free energy (γs) is the sum of polar ($\gamma_{s}^{p}$) and apolar or dispersive ($\gamma_{s}^{d}$) interactions [3, 4, 8].
$\gamma_{s}=\gamma_{s}^{d}+\gamma_{s}^{p}$ (2)
The polar or dispersive component of surface energy which is attributed to London forces (dispersion, orientation and induction) [2, 9]. The polar component includes the orientation and induction forces of the dipoles which can be attributed to the formation of hydrogen bonds [2, 10]. There are different approaches for estimating the value of the solid-liquid interfacial energy (γls) from the measured contact angles. Here, we have chosen the Wu approach. Wu claimes that the harmonic means method is better suited for low energy surfaces [3, 11, 12]. This model allows us to obtain the polar component ($\gamma_{s}^{p}$) and the apolar component ($\gamma_{s}^{d}$) of the surface energy $\gamma_{s}=\gamma_{s}^{d}+\gamma_{s}^{p}$ by measuring the contact angles obtained on the thin film using two different liquids (θ1, θ2). We, then, solve the following system.
$\gamma_{l 1}\left(1+\cos \theta_{1}\right)=\frac{4 \gamma_{s}^{d} \gamma_{l 1}^{d}}{\gamma_{s}^{d}+\gamma_{l 1}^{d}}+\frac{4 \gamma_{s}^{p} \gamma_{i 1}^{p}}{\gamma_{s}^{p}+\gamma_{l 1}^{p}}$ (3)
$\gamma_{l 2}\left(1+\cos \theta_{2}\right)=\frac{4 \gamma_{s}^{d} \gamma_{l 2}^{d}}{\gamma_{s}^{d}+\gamma_{l 2}^{d}}+\frac{4 \gamma_{s}^{p} \gamma_{l 2}^{p}}{\gamma_{s}^{p}+\gamma_{l 2}^{p}}$ (4)
The surface energies of the liquids used in this work and their components are reported in Table 1.
Table 1. Surface tension of the test liquids
|
Liquid |
$\gamma _{l}^{d}\left( mJ.{{m}^{-2}} \right)$ |
$\gamma _{l}^{p}\left( mJ.{{m}^{-2}} \right)$ |
$\gamma _{l}^{{}}\left( mJ.{{m}^{-2}} \right)$ |
|
Distilled Water (H2O) |
21.8 |
51 |
72.8 |
|
Diiodométhane (CH2I2) |
50.42 |
0.38 |
50.8 |
The adhesion work or adhesion energy is defined by Eq. (5) [13]:
$W_{s l}=\gamma_{s v}+\gamma_{l v}-\gamma_{s l}$ (5)
Using Young's equation (Eq. (1)), the adhesion work can be expressed as follows:
$W_{s l}=\gamma_{l v}(1+\cos \theta)$ (6)
So, we have a direct relationship between the contact angle and the adhesion energy. The total wetting corresponds to the maximum of the adhesion work.
2.2.3 XRD, SEM and FTIR measurements
X-ray diffraction (XRD) patterns of the prepared thin films were recorded on a Bruker AXS D8 advance X-Ray diffractometer with Cu Kαanode (λ=1.5418 Å). The diffraction patterns were recorded over an angular range from 20 to 80°. The surface morphology of the films was analyzed by scanning electron microscopy (SEM) using a JEOL-6360 microscope. Infrared spectra were analyzed by infrared spectroscopy of type JASCO (USA); which allows recording IR spectra in the range of 4000-400 cm-1.
3.1 Wettability analysis: Contact angle, adhesion work and surface energy measurements
We will examine the effect of annealing temperature on the adhesive properties of thin films. For this purpose, we deposited CuO thin films on glass substrates. After depositing three layers and annealing for 1 hour, we performed a series of samples at three different annealing temperatures: 350℃, 450℃ and 550℃. In this section, we study the variation of contact angle (θ), work of adhesion (Wadh), and surface energy (γs) on these layers. Figure 3 represents the variation of the contact angle of the two liquids (water and diiodomethane) as a function of annealing temperature.
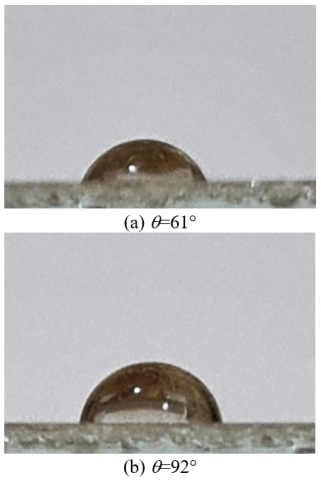
For both liquids, the results show that the variation of the contact angle for different annealing temperatures follows practically the same evolution. We notice that the contact angle increases with the increase of the annealing temperature until reaching a maximum value of 92° and 61° for water and diiodomethane, respectively. The rise in the contact angle of the two liquids as the annealing temperature rises is explained by the fact that the annealing temperature produces a change of the CuO surface, resulting in a decrease in the hydrophilic properties of the films (adhesive properties). A shift in interfacial tension has been postulated to explain CuO's hydrophobicity [13]. Indeed, increasing the annealing temperature reduces active neutral species that react with the sample's surface and cause wettability [14]. These species may be oxidizing in nature (O, OH...). They demonstrated that the annealing temperature alters the hydrophilic property of the developed films. Because the surrounding environment of the copper atoms at the surface is completely different from that of the interior mass, the copper oxide atoms are stable at the volume of the structure, unlike the interface [15]. With increasing surface roughness of these materials, the contact angle of a drop of water increases [1].
Figure 4 displays the difference between a photograph of a water drop deposited on a film elaborated with a 350℃ annealing temperature (a) and a photograph of a water drop deposited on a film elaborated with a 550℃ annealing temperature (b).
Figure 3. Variation in contact angle of CuO as a function of annealing temperature
Figure 4. Photo of a drop of water on the CuO surface (a) 350℃ annealing temperature, (b) 550℃ annealing temperature
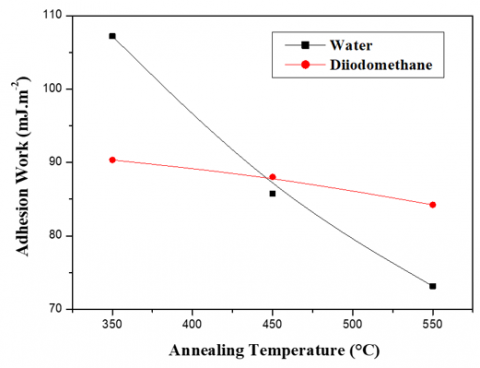
Figure 5 Illustrates the variation of the adhesion work of the two liquids as a function of the annealing temperature. Note that the adhesion work is calculated from the following formula: Wadh=γl(1+cosθ).
Figure 5. Variation in Adhesion work of CuO surface as a function of annealing temperature
When the annealing temperature increases, the adhesion work decreases significantly to reach a minimum value of about 73 mJ.m-2 for water (polar liquid). This means a degradation exceeding 40 times the one recorded at 350℃. On the other hand, this degradation is not stronger for diiodomethane (nonpolar liquid) which has a decrease in the adhesion work of about 15% at 550℃. This phenomenon is therefore linked to the disappearance of a polar component during processing [14, 16]. This suggests that the films are highly textured and that the increase in the annealing temperature causes a densification of the CuO copper oxide layer. This result is in good agreement with those recently reported by Al Armouzi et al. [17].
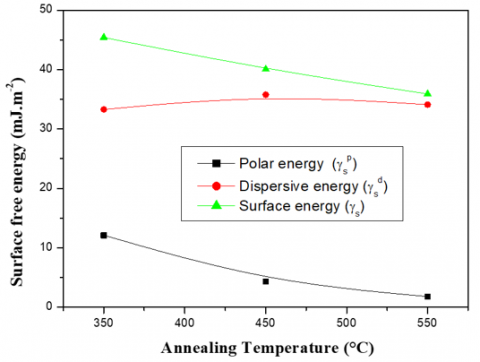
In the following section, the surface free energy and its components will be calculated numerically. Figure 6 depicts the harmonic mean approach for films created at various annealing temperatures.
Figure 6. Variation in surface energy and its components of CuO surface as a function of annealing temperature
The surface energy of a film elaborated with an annealing temperature of 550℃ has a value of γs=36.809 mJ.m-2 with a dispersive component $\gamma_{s}^{d}$= 34.24 mJ.m-2 and a polar component $\gamma_{s}^{p}$= 1.85 mJ.m-2. The polar component value reflects the film's low wettability and non-polarity. The dispersive component remains practically constant with the increase in the annealing temperature. This proves that the increase in the annealing temperature has no effect on the apolar component. The reduction in surface energy is mostly due to a decrease in the polar component, which is responsible for enhancing the wettability of the CuO surface. We can also explain this decrease by a deoxidation of the CuO film surface [14, 15] (see analysis by FTIR).
3.2 Morphological analysis
The influence of annealing temperature on the surface morphology of thin films has been studied using scanning electron microscopy (SEM). For this purpose, we compared the SEM images recorded on three samples for different annealing temperatures (Figure 7).
The SEM images allowed us to observe the texture and the surface state of our CuO layers elaborated by the Sol-Gel method. From these images we can observe that the morphology of the samples elaborated at 350℃ and 450℃ is nanostructured with agglomerates of different shapes, of the order of a few hundred nanometers randomly distributed on the surface. While the sample prepared at 550℃ exhibits a cloudy type formation. The increase in the annealing temperature leads to condensation of the agglomerates leading to a dense structure. The growth mechanism of agglomerates is a process of nucleation dependent on temperature. The first crystalline germs formed when Cu2+ reacted with O2- of the air to form the CuO molecules that are evenly distributed and then immediately agglomerated [7]. As a result, annealing improves the surface area of these layers. The increased roughness of the formed film can be attributed to the hydrophobicity behavior of the deposited layer at 550℃ [18]. Because of their high surface free energy, metal oxides have a hydrophilic character [19]. It is believed that the increase of hydrophobicity is mainly due to multi-scale roughness [1].
Figure 7. Surface state of CuO thin films at various annealing temperatures: (a) 350℃, (b) 450℃, (c) 550℃
3.3 FT-IR analysis
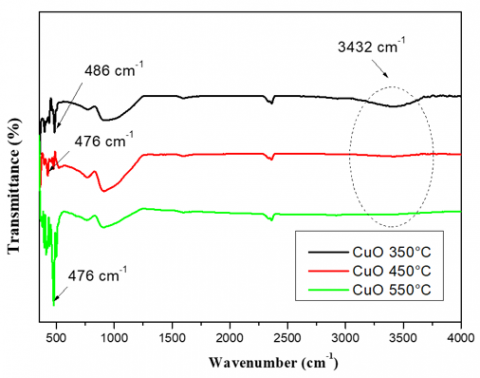
To better understand the influence of the annealing temperature on the composition of the elaborate material, the FTIR spectra of the films deposited with different annealing temperatures (350℃, 450℃ and 550℃) are shown in Figure 8. The FTIR spectra of the CuO thin films were recorded in the range of 400-4000 cm-1.
For an annealing temperature of 450℃, the FTIR spectrum of the CuO thin films shows that the broad absorption band at 3432 cm−1 corresponds to the hydroxyl (OH) functional groups. These groups are probably due to the oxidation of the thin film surface [20]. However, we notice in this same figure that when the annealing temperature increases, the intensities of the hydroxyl groups decrease. Indeed, the increase in the annealing temperature results in a decrease in the active species reacting with the surface of the CuO film. This is mainly due to deoxidation of the surface [19]. The layer therefore becomes hydrophobic in nature and not very sensitive to polar vapor. The decrease in the hydroxyl groups with the increase in the annealing temperature was retained to confirm the densification of the elaborate film [21]. In this case, the film presents a network structure due to the creation of constraints between the atoms of the film [22]. This leads to a growth of a highly cross-linked film [23, 24] and consequently a decrease in the number or section of pores in the deposited films. The absorption band at wavenumber range of 420–600 cm−1 are attributed to the vibration of metal-oxygen bond determining the presence of CuO in the system [7]. The band at roughly 477 cm-1 is shared by all three spectra and can be attributed to the vibrations of Cu (II)-O bonds [7].
Figure 8. Evolution of FTIR spectra of copper oxide thin film for different annealing temperatures
3.4 X-ray diffraction analysis
XRD patterns of the prepared films as a function of the annealing temperature are shown in Figure 9.
From these spectra, we notice that the XRD spectrum obtained in the films and elaborated at 350°C presents an appearance of 2 lines. The first line (2θ=35.496°) corresponds to the (002) plane and the second one (2θ=38.731°) corresponds to the (111) plane. This explains the beginning of the crystallization. We see an increase in the line relative to the (002) plane and an increase in the peak relative to the (111) plane when the temperature rises to 450°C.The films annealed at 550°C, on the other hand, show an increase in the two lines obtained at (2=35.496°) and (2=38.731°) according to planes (002) and (111), respectively, with a decrease in the full width at half-maximum (FWHM) of these two lines and the emergence of a third line (2=32.497°) corresponding to the (-110) plane. The appearance of this new peak can be explained by the influence of the annealing temperature on the growth kinetics. At higher temperatures, the precursors will have greater mobility which can promote growth along several directions. The decrease of (FWHM) indicates the improvement in the crystallinity of the film [25]. Based on this analysis, we can see that the intensity of the peaks in the XRD spectra increases as the annealing temperature rises. This rise in peak intensity is accompanied by a decrease in their (FWHM), which converts into an increase in grain size. We can explain this by the process of recrystallization and crystallite development due to a simple increase in annealing temperature [26, 27].
Figure 9. Evolution of X-ray diffraction spectra of CuO thin films for different annealing temperatures
This suggests that the films are highly textured and that the increase in annealing temperature causes a better crystallization of the layer and a confirmation of the formation of copper oxide CuO. The XRD spectra allowed us to determine the structure and size of copper oxide nanocrystals as a function of annealing temperature. This latter was calculated from the Scherrer equation (Eq. (6)):
$L=\frac{K \lambda}{\beta \cos (\theta)}$ (6)
where, L is the crystallite size, λ is the wave length of incident CuKα radiation (1.5406 A◦), K a constant equal to 0.94, β is the Full Width at Half Maximum (FWHM) and θ is the Bragg diffraction angle.
To determine the grain size the (002) plane was used as a reference plane, the results obtained are represented in Table 2:
Table 2. Values of crystallites size at different annealing temperatures
|
Temperature (℃) |
2θ(°) |
Crystallites size (nm) |
|
350 |
35.496 |
400.59 |
|
450 |
35.496 |
451.17 |
|
550 |
35.496 |
473.54 |
From this table, we note that the size of the crystallites increases with the rise in temperature [28, 29] and this confirms the previous results (the phenomenon of recrystallization and growth of the crystallites).
CuO thin films were successfully synthesized on glass substrates using a sol-gel spin-coating technique with various annealing temperatures. The hydrophobicity, morphological and structural of the samples was studied. The exploratory study of the surface wettability of CuO thin films revealed that increasing the annealing temperature causes an increase in the contact angle and, as a result, a decrease in surface energy due to a decrease in its polar component. Therefore, thin films become hydrophobic. The FTIR study shows that increasing the annealing temperature causes deoxidation of the CuO film's surface, resulting in changes in the surface's adhesive qualities. The SEM analysis showed that the morphology of the elaborated samples is nanostructured with agglomerates of different shapes, of the order of a few hundred nanometers randomly distributed on the surface. As the annealing temperature rises, these agglomerates condense, resulting in a thick and rough structure. According to DRX research, the copper oxide (CuO) films on our substrates are extremely textured. The DRX data also demonstrate that the size of the crystallites grows as the temperature rises, which verifies the earlier findings (the phenomenon of recrystallization and growth of crystallites).
|
$\gamma_{l v}$ |
Surface free energy of the liquid mJ.m-2 |
|
$\gamma_{s}$ |
Surface free energy of the solid mJ.m-2 |
|
$\gamma_{l s}$ |
Interfacial energy between solid–liquid mJ.m-2 |
|
$\gamma_{s}^{p}$ |
Polar interaction mJ.m-2 |
|
$\gamma_{s}^{d}$ |
Dispersive interaction mJ.m-2 |
|
$W_{a d h}$ |
Adhesion work mJ.m-2 |
|
Greek symbols |
|
|
$\theta$ |
The contact angle ° |
|
$\lambda$ |
Wave length of incident CuKα radiation |
|
$K$ |
Constant equal to 0.94 |
|
$L$ |
Crystallite size |
|
$\beta$ |
Full Width at Half Maximum (FWHM) |
[1] Xie, Y.Y., Hu, X.H., Zhang, Y.W., Wahid, F., Zhong, C. (2019). Development and antibacterial activities of bacterial cellulose/graphene oxide-CuO nanocomposite films. Carbohydrate Polymers, 229: 115456. https://doi.org/10.1016/j.carbpol.2019.115456
[2] Dolai, S., Dey, R., Hussain, S., Bhar, R., Pal, A.K. (2019). Photovoltaic properties of F: SnO2/CdS/CuO/Ag heterojunction solar cell. Materials Research Bulletin, 109: 1-9. https://doi.org/10.1016/j.materresbull.2018.09.022
[3] Tu, S.H., Wu, H.C., Wu, C.J., Cheng, S.L., Sheng, Y.J., Tsao, H.K. (2014). Growing hydrophobicity on a smooth copper oxide thin film at room temperature and reversible wettability transition. Applied Surface Science, 316: 88-92. http://dx.doi.org/10.1016/j.apsusc.2014.07.183
[4] Paul, D., Mangla, S., Neogi, S. (2020). Antibacterial study of CuO-NiO-ZnO trimetallic oxide nanoparticle. Materials Letters, 271: 127740. https://doi.org/10.1016/j.matlet.2020.127740
[5] Anvari, S., Hajfarajollah, H., Mokhtarani, B., Enayati, M., Sharifi, A., Mirzaei, M. (2016). Antibacterial and anti-adhesive properties of ionic liquids with various cationic and anionic heads toward pathogenic bacteria. Journal of Molecular Liquids, 221: 685-690. http://dx.doi.org/10.1016/j.molliq.2016.05.093
[6] Bououd, S., El-Aggadi, S., Kaichouh, G., Bouziane, K., El-Hourch, A., El-kacemi, K., Guessous, A. (2021). Electrodeposition route to synthesize nanocrystalline MnPO4. H2O thin films. Electrochimica Acta, 370: 137670. https://doi.org/10.1016/j.electacta.2020.137670
[7] Touka, N., Tabli, D., Badari, K. (2019). Effect of annealing temperature on structural and optical properties of copper oxide thin films deposited by sol-gel spin coating method. Journal of Optoelectronics and Advanced Materials, 21: 698-701.
[8] Klochko, N.P., Kopach, V.R., Tyukhov, I.I., Zhadan, D.O., Klepikova, K.S., Khrypunov, G.S., Petrushenko, S.I., Lyubov, V.M., Kirichenko, M.V., Dukarov, S.V., Khrypunova, A.L. (2018). Metal oxide heterojunction (NiO/ZnO) prepared by low temperature solution growth for UV-photodetector and semi-transparent solar cell. Solar Energy, 164: 149-159. https://doi.org/10.1016/j.solener.2018.01.054
[9] Bellel, A., Sahli, S., Ziari, Z., Raynaud, P., Segui, Y., Escaich, D. (2006). Wettability of polypropylene films coated with SiOx plasma deposited layers. Surface and Coatings Technology, 201(1-2): 129-135. https://doi.org/10.1016/j.surfcoat.2005.11.100
[10] Kreve, S., Dos Reis, A.C. (2021). Bacterial adhesion to biomaterials: What regulates this attachment? A review. Japanese Dental Science Review, 57: 85-96. https://doi.org/10.1016/j.jdsr.2021.05.003
[11] Naveena, D., Logu, T., Dhanabal, R., Sethuraman, K., Bose, A.C. (2019). Comparative study of effective photoabsorber CuO thin films prepared via different precursors using chemical spray pyrolysis for solar cell application. Journal of Materials Science: Materials in Electronics, 30(1): 561-572. https://doi.org/10.1007/s10854-018-0322-4
[12] Wang, G., Chen, L., Weng, D., Wang, J. (2020). Role of extracellular polymeric substances in the adhesion interaction of Streptococcus mutans on TiO2 and SiO2 surfaces with different wettability. Colloid and Interface Science Communications, 39: 100315. https://doi.org/10.1016/j.colcom.2020.100315
[13] Hashim, H., Samat, S.F.A., Shariffudin, S.S., Saad, P.S.M. (2018). Investigation of annealing temperature on copper oxide thin films using sol-gel spin coating technique. Materials Science and Engineering, 340: 012008. https://doi.org/10.1088/1757-899X/340/1/012008
[14] Awaja, F., Gilbert, M., Kelly, G., Fox, B., Pigram, P.J. (2009). Adhesion of polymers. Progress in Polymer Science, 34(9): 948-968. https://doi.org/10.1016/j.progpolymsci.2009.04.007
[15] Chang, F.M., Cheng, S.L., Hong, S.J., Sheng, Y.J., Tsao, H.K. (2010). Superhydrophilicity to superhydrophobicity transition of CuO nanowire films. Applied Physics Letters, 96(11): 114101. https://doi.org/10.1063/1.3360847
[16] Ghorannevis, Z., Hosseinnejad, M.T., Habibi, M., Golmahdi, P. (2015). Effect of substrate temperature on structural, morphological and optical properties of deposited Al/ZnO films. Journal of Theoretical and Applied Physics, 9(1): 33-38. https://doi.org/10.1007/s40094-014-0157-1
[17] Al Armouzi, N., Najih, Y., El Yagoubi, M. (2016). Effect of temperature on the wettability of CuO nanowires. Nourreeddine Kouider, Mustapha Mabrouki. IOSR-JESTFT. 10: 31-36. https://doi.org/10.9790/2402-1011013136
[18] Wang, G., Zhang, T.Y. (2012). Oxygen adsorption induced superhydrophilic-to-superhydrophobic transition on hierarchical nanostructured CuO surface. Journal of Colloid and Interface Science, 377(1): 438-441. http://dx.doi.org/10.1016/j.jcis.2012.03.035
[19] Long, J., Zhong, M., Zhang, H., Fan, P. (2015). Superhydrophilicity to superhydrophobicity transition of picosecond laser microstructured aluminum in ambient air. Journal of Colloid and Interface Science, 441: 1-9. http://dx.doi.org/10.1016/j.jcis.2014.11.015
[20] Abd-Elnaiem, A.M., Abdel-Rahim, M.A., Moustafa, S. (2020). Comparative investigation of electronic properties of As-70 at.% Te thin films: Influence of Ga doping and annealing temperature. Journal of Non-Crystalline Solids, 540: 120062. https://doi.org/10.1016/j.jnoncrysol.2020.120062
[21] Sandu, C.S., Teodorescu, V.S., Ghica, C., Canut, B., Blanchin, M.G., Roger, J.A., Brioude, A., Bret, T., Hoffmann, P., Garapon, C. (2003). Densification and crystallization of SnO2: Sb sol–gel films using excimer laser annealing. Applied Surface Science, 208: 382-387. https://doi.org/10.1016/S0169-4332(02)01412-5
[22] Kang, Y., Chen, Y., Wen, Y., Wu, B., Song, M. (2020). Effects of structural relaxation and crystallization on the corrosion resistance of an Fe-based amorphous coating. Journal of Non-Crystalline Solids, 550: 120378. https://doi.org/10.1016/j.jnoncrysol.2020.120378
[23] Estella, J., Echeverría, J.C., Laguna, M., Garrido, J.J. (2007). Silica xerogels of tailored porosity as support matrix for optical chemical sensors. Simultaneous effect of pH, ethanol: TEOS and water: TEOS molar ratios, and synthesis temperature on gelation time, and textural and structural properties. Journal of Non-crystalline Solids, 353(3): 286-294. https://doi.org/10.1016/j.jnoncrysol.2006.12.006
[24] Lillo-Ramiro, J., Guerrero-Villalba, J.M., Mota-González, M.D.L., Aguirre-Tostado, F.S., Gutiérrez-Heredia, G., Mejía-Silva, I., Carrillo-Castillo, A. (2021). Optical and microstructural characteristics of CuO thin films by sol gel process and introducing in non-enzymatic glucose biosensor applications. Optik, 229: 166238. https://doi.org/10.1016/j.ijleo.2020.166238
[25] Scheuermann, T.R., Camper, A.K., Hamilton, M.A. (1998). Effects of substratum topography on bacterial adhesion. Journal of Colloid and Interface Science, 208(1): 23-33. https://doi.org/10.1006/jcis.1998.5717
[26] Fujimoto, K., Oku, T., Akiyama, T., Suzuki, A. (2013). Fabrication and characterization of copper oxidezinc oxide solar cells prepared by electrodeposition. Journal of Physics: Conference Series 433: 012024. https://doi.org/10.1088/1742-6596/433/1/012024
[27] Wang, D., Chen, Z.Q., Wang, D.D., Gong, J., Cao, C.Y., Tang, Z., Huang, L.R. (2010). Effect of thermal annealing on the structure and magnetism of Fe-doped ZnO nanocrystals synthesized by solid state reaction. Journal of Magnetism and Magnetic Materials, 322(22): 3642-3647. https://doi.org/10.1016/j.jmmm.2010.07.014
[28] Benramache, S., Benhaoua, B. (2012). Influence of annealing temperature on structural and optical properties of ZnO: In thin films prepared by ultrasonic spray technique. Superlattices and Microstructures, 52(6): 1062-1070. http://dx.doi.org/10.1016/j.spmi.2012.08.006
[29] Rajalekshmi, E.S., Raj, A.M.E. (2021). Effect of substrate temperature on structural and morphological studies by spray pyrolysed ZnO thin films. Solid State Communications, 338: 114479. https://doi.org/10.1016/j.ssc.2021.114479