Hanlin Li | Zhiqiang Zhang* | Wei Yang
© 2021 IIETA. This article is published by IIETA and is licensed under the CC BY 4.0 license (http://creativecommons.org/licenses/by/4.0/).
OPEN ACCESS
Drawing on the theories of limit equilibrium and finite-element strength reduction, this paper explores the instability modes and stability change laws of the slope in zones E, W, and S of Jiajika spodumene mine, through rock mechanics tests, field survey, and numerical simulation. The results show that the sliding mode of the slope is circular arc sliding or circular arc + plane sliding. Overall, the final slope of the open-pit mine is generally stable under the current design, and the slope of the current steps is reasonable.
open-pit mine slope, limit equilibrium method, strength reduction method, stability analysis, finite-element method
The development of mineral resources is an important guarantee for the development of the national economy. Open-pit mining has been widely adopted in domestic and foreign mines, owing to its large production scale, high labor efficiency, and low production cost [1]. During open-pit mining, slope stability is critical to the work safety of the mine. With the continuous advancement of open-pit mining technology and the large-scale exploitation of surface resources, open-pit mines are witnessing the growth of mining depth and slope height [2]. The excavation of open-pit mines is shifting from shallow buried layers to deep open layers, and to underground layers in some cases [3]. The growing depth of open-pit mining inevitably pushes up the height of the open-pit mine slope, raising higher requirements for slope stability.
After years of exploration, there are systematic analysis approaches for the stability of open-pit mine slope, which mainly falls into qualitative analysis and quantitative analysis. Specifically, qualitative analysis approaches include geological history analysis, engineering geological analogy, and graphic method; quantitative analysis approaches include limit equilibrium method, numerical analysis, and reliability analysis. Among them, numerical analysis can be broken down into finite-element method (FEM), finite-difference method (FDM) [4], boundary element method (BEM) [5], discrete element method (DEM) [6], numerical manifold method (NMM) [7], element-free method (EFM) [8], discontinuous deformation analysis (DDA) for block systems [9], and fast Lagrangian analysis of continua (FLAC) [10, 11].
For its simplicity of mechanical modeling and ease of use, the limit equilibrium method has been extensively applied in engineering, creating lots of practical experience. Strength reduction method, a common approach for the finite-element analysis of slope stability, directly solves a safety factor through finite-element analysis. This method not only inherits the merits of the FEM in simulating complex problems, and boasts clear concepts and intuitive results. Hence, more and more projects have resorted to strength reduction method. As a result, this paper studies slope stability with limit equilibrium method and strength reduction method.
2.1 Basic principles of limit equilibrium method
According to the principle of mechanical equilibrium, the limit equilibrium method analyzes the stress state of the slope under various failure modes, and evaluates slope stability based on the relationship between the anti-sliding force and the sliding force [12-14].
The basic principle of the limit equilibrium method for rigid bodies is to assume that the rock mass will be on the verge of failure, if the shear parameters (friction coefficient tan $\varphi$ and cohesive force c) of the rock mass on the sliding surface are reduced by Fs times [15]. In this case, Fs is the safety factor for the stability of the rock slope, i.e., the ratio of the shear strength of the entire sliding surface to the actual shear stress of the sliding surface:
$F_{s}=\frac{T_{f}}{T}$ (1)
where, Tf is the shear strength; T is the actual shear stress.
Trial calculation is often adopted to compute the safety factor Fs of the sliding rock mass. Firstly, different sliding surface forms are selected for different rock masses, according to the actual engineering experience or experimental analysis results. Next, several different sliding surfaces are assumed, and the safety factor is calculated for each of the surfaces. Finally, the minimum safety factor is selected as the safety factor of the slope, and the corresponding sliding surface taken as the most probable sliding surface of the slope [16].
2.2 Basic principle of finite-element strength reduction method
The basic principle of the finite-element strength reduction method is to divide the shear strength indices (cohesive force c and internal friction angle $\varphi$) of the slope by a reduction factor Fs, producing a new set of strength parameters c` and $\varphi$`; the new strength parameters are then imported to the model for repeated trial calculations [17]. When the computation no longer converges, the Fs value is determined as the minimum safety factor for slope stability. In this case, the slope reaches the limit state and suffers shear failure. Hence, the failure sliding surface of the slope can be obtained. The shear strength reduction of the rock and soil mass can be calculated by:
$c^{'}=\frac{c}{F_{s}}$ (2)
$\varphi ^{'}=\arctan \left(\frac{\tan \varphi}{F_{s}}\right)$ (3)
where, c and c` are the cohesive forces of the soil before and after reduction, respectively; $\varphi$ and $\varphi$` are the internal friction angles of the soil before and after reduction, respectively; Fs is the reduction coefficient.
3.1 Mine overview
On the southeastern margin of Sichuan-Tibet Plateau, Jiajika spodumene mine is excavated by open-pit mining, coupled with highway transportation. The horizontal layers of the mine are exploited from the top to bottom. After the mining, the open-pit mine slope will be 30-90m tall in the east, west, and north, and 130m tall in the south. The mining mainly takes place in the strata of quartz schist and pegmatite. As part of the surrounding rock, quartz schist is relatively soft, and thin to medium-thick, with well-developed joints and fissures. The poor physical and mechanical properties of the rock is not conducive to the stability of the slope. From the angles of safety management and economic benefits, it is highly necessary to comprehensively evaluate the slopes in the mine.
3.2 Engineering geological zoning
The engineering geological zoning of the slope is based on the following elements: the shape and height of the slope, the lithology of the location, the occurrence of structural planes, the distribution features of engineering geological rock groups, and the condition of groundwater. The principle of zoning is to divide the areas with roughly the same elements into the same engineering geological zone [18].
According to the actual situation of the mine and the principle of zoning, the open-pit mine slope was divided into four engineering geological zones (N, S, E, and W), in reference to the elements of “the location and the height of the slope, the combination between slope and the occurrence of the dominant structural surface of the rock mass, and other factors affecting slope stability”, as well as the final planar drawing of the open-pit boundaries in the resource development and utilization scheme of the mine prepared by the design institute. The situation of the zones is illustrated in Figure 1.
Figure 1. Slope zoning
4.1 Rock mechanical properties
The rock mechanical properties were investigated through block density test, uniaxial compressive strength test, uniaxial compression deformation test, and tensile strength test. Two moisture conditions were considered in the tests: indoor natural state, and saturated state. The test indices include the density, tensile strength, uniaxial compressive strength, elastic modulus, and Poisson's ratio of the rock blocks. The test results are listed in Table 1.
4.2 Survey of structural plane occurrence
The structural plane survey targets the dominant lithology in the open-pit slope: quartz schist and pegmatite. The selected survey area has obvious and representative features of structural plane development, and ensures the safety of the surveyors. The final survey locations include the platforms at 4,420m, 4,430m, 4,440m, and the toe of the slope. According to the survey results, the Dips software was called to summarize the occurrence of the structural planes of the rock mass in the open-pit slope: quartz schist (surrounding rock) and pegmatite (ore). The survey results show that the mean interval and linear density of quartz schist (surrounding rock) were 0.73m/line, and 1.37 lines/m, respectively; the mean interval and linear density of pegmatite (ore) were 0.8m/line, and 1.25 lines/m, respectively.
4.3 Engineering geological quality evaluation of rock mass
Since the topography of the mining area is favorable for natural drainage, our quality evaluation of rock mass mainly considers the natural conditions of the rock, using the rock quality designation (RQD) measure [19]. According to the field survey results and RQD measure, the quartz schist (surrounding rock) and pegmatite (ore) both belonged to the relatively good level of Grade III.
4.4 Mechanical parameters of rock mass
The mechanical parameters of the rock mass can be determined by various methods. This paper explores these parameters with multiple strategies, including ΦuceHko’s method, M. Georigi’s method, empirical reduction method, the CSIR (Council for Scientific and Industrial Research) engineering geological classification method of jointed rock masses, and the rock mass friction angle conversion algorithm. On this basis, the physical parameters of the rock were selected compressively (as shown in Table 2).
Table 1. Physical and mechanical properties of ore-bearing rocks
|
Name of rock |
Block density (g/cm3) |
Tensile strength (MPa) |
Uniaxial compressive strength (MPa) |
Elastic modulus (GPa) |
Poisson’s ratio |
Internal friction angle $\varphi$ (°) |
Cohesive force c (MPa) |
|
Quartz schist (natural) |
27.1 |
10.59 |
53.71 |
4.56 |
0.26 |
42.1 |
11.9 |
|
Quartz schist (saturated) |
27.1 |
8.70 |
40.39 |
3.35 |
0.17 |
40.2 |
9.4 |
|
Pegmatite (natural) |
26.5 |
8.22 |
111.95 |
3.90 |
0.11 |
59.7 |
15.2 |
|
Pegmatite (saturated) |
26.5 |
6.39 |
72.19 |
3.39 |
0.14 |
56.9 |
10.7 |
Table 2. Mechanical parameters of the rock mass in the open-pit mine slope
|
Name of rock |
Bulk density γ (g/cm3) |
Tensile strength σct (MPa) |
Compressive strength σcm (MPa) |
Elastic modulus Em (GPa) |
Poisson’s ratio m |
Internal friction angle $\varphi$ (°) |
Cohesive force c(MPa) |
|
Quartz schist (natural) |
27.1 |
0.3 |
10.0 |
2.4 |
0.18 |
35.0 |
0.7 |
|
Quartz schist (saturated) |
27.1 |
0.2 |
7.8 |
2.0 |
0.21 |
32.0 |
0.3 |
|
Pegmatite (natural) |
26.5 |
2.0 |
12.0 |
3.4 |
0.16 |
40.0 |
0.8 |
|
Pegmatite (saturated) |
26.5 |
1.8 |
10.8 |
3.0 |
0.18 |
38.0 |
0.6 |
5.1 Limit equilibrium analysis
Based on the zones of the open-pit mine slope delineated for stability analysis in Section 3, two profiles were selected for limit equilibrium analysis of the slope, namely, P08 and P0A. Specifically, P0A was adopted to compute the stability of slope S; the southwestern and northern ends of P08 were employed to compute the stability of slopes E and W, respectively. The open-pit mine slope is 120m tall at the two profiles. The two profiles and three zones of the open-pit mine slope were analyzed under three conditions (I, II, and III), and the allowable safety factor [K] was determined for each of the three conditions:
I: Dead load + groundwater; [K]=1.20
II: Dead load + groundwater + blasting vibration; [K]=1.15
III. Dead load + groundwater + seismic force. [K]=1.10
The simplified Bishop method was chosen to analyze slope stability [20]. It is assumed that the force between the blocks remains in the horizontal direction, that is, the horizontal thrust is the only force, without considering the vertical shear between the blocks. In this case, the safety factor K of the stability of the arc sliding surface can be expressed as:
$K=\frac{\sum_{i}\left[c_{i} L_{i}+\left(W_{i} \sec \alpha_{i}-U_{i} L_{i}\right)\right] \frac{1}{1+\tan \varphi_{i} \tan \alpha_{i} / K}}{\sum_{i}\left(W_{i} \sin \alpha_{i}+Q_{i} \cos \alpha_{i}\right)}$ (4)
where, ci is the cohesive force of rock i (MPa); Li is the bottom side length of block i (kg); αi is the angle between the bottom side of block i and the horizontal plane of the coordinate axis (°); Ui is the horizontal force acting on block i (N); $\varphi$i is the internal friction angle of rock i (°); Qi is the horizontal force acting on block i (N).
Table 3 displays the results of limit equilibrium analysis of slope stability. It can be observed that the overall safety factors of the slope derived from the three zones under conditions I, II, or III always surpassed the allowable safety factors (1.20, 1.15, and 1.10), indicating that the slope is generally stable.
Table 3. Calculated safety factors of each profile in the slope
|
Profile |
Zone |
Condition |
Overall safety factor |
|
P08 E |
E |
Ⅰ |
1.519 |
|
Ⅱ |
1.253 |
||
|
Ⅲ |
1.240 |
||
|
P08 W |
W |
Ⅰ |
2.581 |
|
Ⅱ |
1.966 |
||
|
Ⅲ |
1.956 |
||
|
P0A S |
S |
Ⅰ |
1.598 |
|
Ⅱ |
1.304 |
||
|
Ⅲ |
1.288 |
5.2 Strength reduction method
According to the engineering geological features of the open-pit mine slope, the P0A and P08 profiles were selected for analysis, due to their typicality. Three finite-element analysis models E, S, and W were established for strength reduction calculation. The Canadian geotechnical engineering analysis software Phase 2.8.0 was selected as the analysis program.
The boundary conditions of the models were configured as follows: The slope is a free surface; the two end faces of the slope are fixed in the horizontal direction, and the bottom is fixed in the vertical direction; the original stress field of the rock mass is the dead load stress field. The maximum tensile stress criterion was combined with the Mohr-Coulomb yield criterion to determine the stress, displacement, and possible tensile-shear failure range of the slope after mining, such as to evaluate the stability of the open-pit mine slope of Jiajika spodumene mine.
During the analysis, the load was applied automatically in stages by the program. The Gaussian elimination method was employed to solve the equations. The maximum number of repetitions was set to 500, and the cumulative error was 0.001.
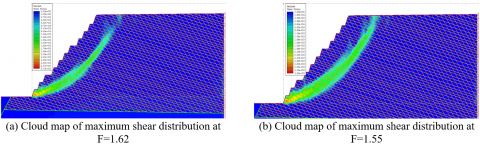
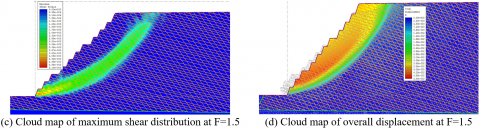
Figures 2(a)-(c) explain the calculation procedure of the safety factor for the slope E model by the strength reduction method. Through trail calculation, the strength reduction coefficient F was adopted as 1.5, 1.55, and 1.62, respectively. Judging by the development of the maximum shear stress and shear failure zone in the slope, there are shear failure zones at the top and the toe of the slope. With the increase of the reduction coefficient, the top shear failure zone gradually extended to the body of the slope, and the toe shear failure zone gradually moved upwards. When the reduction factor rose to 1.62, the shear failure zones penetrated in the middle of the slope, causing the overall failure of the slope. The sliding surface was approximately a circular arc, and the sliding mode is circular sliding. Figure 2(d) presents the cloud map of the displacement at the final failure.
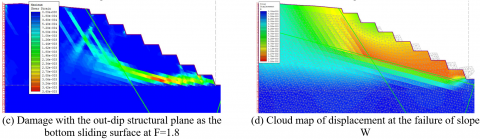
Figures 3(a)-(c) explain the calculation procedure of the safety factor for the slope W model by the strength reduction method. Since the simulated structural surface was relatively large, and an out-dip structural plane was configured near the slope toe, the shear stress was mainly concentrated on the steps. Hence, it is necessary to pay attention to the step stability during actual mining of slope W, and be aware of the plane sliding of steps in dip slopes. During the calculation of the safety factor for slope W model by strength reduction method, the overall failure mode is the plane sliding failure, with the gently dipping structural plane as the bottom sliding surface, and the steeply dipping out-dip structural plane in the rear as the rear cracking surface. Figure 3(d) presents the cloud map of the displacement at the final failure.
Figure 2. Calculation procedure of the safety factor for the slope E model by the strength reduction method
Figure 3. Calculation procedure of the safety factor for the slope W model by the strength reduction method
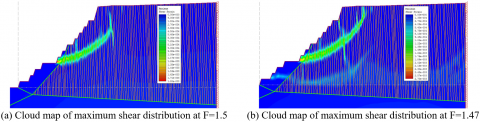
Figure 4. Calculation procedure of the safety factor for the slope S model by the strength reduction method
Figures 4(a)-(c) illustrate the calculation procedure of the safety factor for the slope S model by the strength reduction method. Through trail calculation, the strength reduction coefficient F was adopted as 1.45, 1.47, and 1.5, respectively. Judging by the development of the maximum shear stress and shear failure zone in the slope, there are shear failure zones at the top and the toe of the slope. With the increase of the reduction coefficient, the top shear failure zone gradually extended to the body of the slope, and the toe shear failure zone gradually moved upwards. When the reduction factor climbed to 1.5, the shear failure zones penetrated in the middle of the slope, causing the overall failure of the slope. The sliding surface was approximately a circular arc, and the sliding mode is circular sliding. The rear part of the sliding surface tracked the development of the structural surface, which conforms to the general law. Figure 4(d) presents the cloud map of the displacement at the final failure.
This paper evaluates the slope stability of Jiajika spodumene mine by limit equilibrium method and finite-element strength reduction method. The main conclusions are as follows:
(1) Through field engineering geological survey, indoor rock tests, and quality evaluation of engineering geological rock masses, it was concluded that the overall quality of quartz schist and pegmatite both belong to Grade III, indicating that the two are medium rock masses.
(2) According to the four major elements of “the location and the height of the slope, the combination between slope and the occurrence of the dominant structural surface of the rock mass, and other factors affecting slope stability”, four engineering geological zones were delineated in the open-pit boundaries of the mine for slope stability analysis: E, W, S, and N. The results show that shear failure exists on the top and toe of slopes E and S; For slope W, the shear stress is mainly concentrated on the steps, making it necessary to pay attention to the step stability during actual mining of that slope.
(3) The two profiles and three zones of the open-pit mine slope were analyzed under three conditions, using limit equilibrium method and strength reduction method. The results show that the sliding mode of the slope is circular arc sliding or circular arc + plane sliding. Overall, the final slope of the open-pit mine is generally stable under the current design, and the slope of the current steps is reasonable.
[1] Ji, C.S. (2008). On development of surface coal mining systems in China. Journal of Mining & Safety Engineering, 3: 297-300.
[2] Li, X.S., Luo, L., Wang, Y.M., Geng, J.B. (2021). Slope angle effect on overburden strata response during transition from open pit to underground mining. Mining and Metallurgy Project, 41(4): 33-37. https://doi.org/10.3969/j.issn.0253-6099.2021.04.008
[3] Guo, Y.L., Liu, Y.Z., Huang, S.B., Hu, B., Li, K.B., Li, W. (2019). Study on synergistic optimization of final slope angle and mining depth in open-pit mine. Metal Mine, 5: 37-42. https://doi.org/10.19614/j.cnki.jsks.201905007
[4] Zhang, T., Lin, Z.H., Lin, C., Liang, L., Fan, C.M. (2021). Numerical simulation of the time-dependent mild-slope equation by the generalized finite difference method. Pure and Applied Geophysics, 1-24.
[5] Li, C., Hu, B., Hu, Z.J., Niu, Z.R. (2021). Analysis of 2-D orthotropic potential problems using fast multipole boundary element method with higher order elements. Chinese Journal of Theoretical and Applied Mechanics, 53(4): 1038-1048. https://doi.org/10.6052/0459-1879-20-455
[6] Zhao, L., Liu, X., Mao, J., Shao, L., Li, T. (2019). Three-dimensional distance potential discrete element method for the numerical simulation of landslides. Landslides, 17(2): 361–377.
[7] Liu, Z., Guan, Z., Zhang, P., Sun, C., Liu, F., Lin, S. (2021). Explicit edge-based smoothed numerical manifold method for transient dynamic modeling of two-dimensional stationary cracks. Engineering Analysis with Boundary Elements, 128: 310-325.
[8] Shah, K., Gadade, A.M. (2020). Comparative study of moving least square and point interpolation meshless technique for layered composite beam subjected to transverse loading. Mathematical Modelling of Engineering Problems, 7(2): 309-314. https://doi.org/10.18280/mmep.070218
[9] Li, L. (2007). Application of limit equilibrium method and DDA method in stability analysis of high rock slope. Central South University.
[10] Chen, X., Zhang, L., Chen, L., Li, X., Liu, D. (2019). Slope stability analysis based on the Coupled Eulerian-Lagrangian finite element method. Bulletin of Engineering Geology and the Environment, 78(6): 4451-4463.
[11] Li, Y., Cao, Y.F., Chang, X.J., Zhang, Y.J. (2013). The analysis of stability of mine’s tailing dam based on the FLAC3D. Applied Mechanics and Materials, 353-356: 650–653.
[12] Kang, Y.M., Yang, M.C., Hu Y.X. (2006). Mixed Analysis on slope sability by limit equilibrium method and finite element method. China Mining Magazine, 15(3): 74-77. https://doi.org/10.3969/j.issn.1004-4051.2006.03.021
[13] Li, C.H., Liu, T.P., Wang, H.Y., Xie, Y.J. (2020). Research progress and prospect on slope stability analysis method. Northeast Water Resources and Hydropower, 38(2): 63-65.
[14] Zhou, Z., Zhang, J.M., Ning, F.L., Luo, Y., Wang, J.L. (2020). Temporal and spatial characteristics of moisture migration and instability mechanism of cracked soil slope under rainfall infiltration. https://doi.org/10.19818/j.cnki.1671-1637.2020.04.008
[15] Liu, Y.R., He, Z., Leng, K.D., Huang, Y.Q., Yang, Q. (2013). Dynamic limit equilibrium analysis of sliding block for rock slope based on nonlinear FEM. Journal of Central South University, 20(8): 2263-2274.
[16] Zhou, Z.B., Zhang, Q., Wu, F. (2003). Mixed analysis on slop stability by finite elements and general limit equilibrium method. Journal of Anhui Institute of Architecture & Industry (Natural Science Edition), 11(3): 5-8. https://doi.org/10.3969/j.issn.1006-4540.2003.03.002
[17] Jia, L., Liang, R. (2021). Dynamic stability analysis of reinforced retaining wall based on strength reduction method. Journal of Lanzhou University of Technology, 47(2): 122-126.
[18] Zhirov, D., Soharev, V., Rybin, V., Klimov, S. (2015). Geotechnical zoning of the Zhelezny mine (Joint stock company Kovdor GOK) for management of slopes stabilization. International Multidisciplinary Scientific GeoConference Surveying Geology and Mining Ecology Management, SGEM, 2(1): 367-374.
[19] Deere. D.U. (1964). Technical description of rock cores for engineering purpose. Rock Mechanics and Engineering Geology, 1(1): 17-22.
[20] Yang, Y.Y. (2021). Influence of basalt fiber-reinforced cement-based composite on slope stability. Revue des Composites et des Matériaux Avancés-Journal of Composite and Advanced Materials, 31(2): 93-100. https://doi.org/10.18280/rcma.310204