Thinesh Babu Thiagarajan* | Sengottuvel Ponnusamy
© 2021 IIETA. This article is published by IIETA and is licensed under the CC BY 4.0 license (http://creativecommons.org/licenses/by/4.0/).
OPEN ACCESS
In this work, an attempt was made to identify the optimised parameter combination in cold metal transfer (CMT) cladding process of AISI 316 L austenitic stainless steel. cladding process was carried out using stellite 6 filler wire. Experiments were carried out based on L31 central composite design (CCD). Cladding was done with current, Voltage, torch angle and travel speed as input parameters. Quality of the clad was analysed by measuring depth of penetration, weld area, hardness of the clad surface, corrosion rate and clad interface thickness. Grey relation analysis was used to identify the optimised parameter combination. Trial number 18 was identified as the optimised parameter combination. The optimised input parameters are Welding Current 200 Amps, Voltage 19 V, Torch Angle 70⁰ and Welding Speed 150 m/min. ANOVA was used to identify the most influencing parameters on the overall multi-objective function and it was understood that the combined effect of torch angle, travel speed had a significant influence on the clad quality. Further investigation was carried out through an optimised set of parameters. The cladding experiment was conducted and their surface was investigated through clad profile, hardness of the cladded area, interface thickness of cladding region and corrosion rate.
CMT Cladding, AISI 316 L, Stellite filler wire, GRA, ANOVA
The CMT technology is a digital, microprocessor-controlled welding process that differs from the traditional gas metal arc welding (GMAW) process by using electrode short circuits and precise control of filler wire for material transfer. Fronius has developed a relatively new and advanced fusion welding technology name it is called cold metal transfer (CMT) which would be a revolutionary alternative to the conventional welding processes [1]. Stellite 6 is a type of cobalt-based alloy which is widely used for wear-resistant, galling and corrosion and also retain similar properties at high temperatures. Their exceptional wear resistance, because due to the hard carbide phase dispersed in a CoCr alloy matrix.
CMT technology has the most revolutionized method and how fusion welding is done and also how process development will continue with respect to material, application-based and also dependent with respect to them both. The choice of welding variables is unique for depends on the types and thickness of the material, weld design and weld geometry. Therefore, the selection of welding variables for process development and optimization must be done using a proven and reliable method. Design of experiment (DOE) provides a scientific/statistical approach for evaluating process variables. Many DOE methods are based on the full factorial design, which is not developed to account for the effects of curvature [2-4]. However, DOE methods that account for linear, interaction, and quadratic effects are more accurate and more desirable. DOE methods that account for response surfaces as part of the initial design have the advantage of a possible reduction in the number of experiments required for establishing relationships between input and output parameters [5, 6].
Coating techniques are widely used to enrich the mechanical properties, corrosion resistance, increase wear and repair damaged components. Laser cladding is an efficient method rather than the other existing conventional methods like thermal spraying techniques, diffusion coating, electrodeposition, chemical and physical vapour deposition due to its strong metallurgical bonding with the substrate. Also, the conventional methods have some limitations like more processing time, requires heat resistant substrate, requires a high vacuum, the deposition rate is low and is used to produce only thin coating layers [1].
The cladding process parameter optimization was used based on a greater number of cladding process experiments that can be gradually accumulated for further processing experience, which had a heavy workload and high cost. Sun and Hao [7], Marzban et al. [8], and Chen et al. [9] have been used as a designed orthogonal experiment with the help of the Taguchi method and also laser cladding process parameters were optimized using response surface methodology (RSM), the technique for order preference by similarity to an ideal solution (TOPSIS) and also analysis of variance (ANOVA), respectively for obtained the improved quality of the cladding coating. However, when we are planning to carry out the experiments could be considered for many factors are involved in orthogonal experiments design. It is difficult to determine the change rule of experimental data and the optimal result is usually a combination of experimental parameters that can neither predict the coating quality nor obtain the best process parameters. To solve these problems, some researchers have been used optimization algorithms to optimize process parameters based on the design of the orthogonal experiment using the optimization techniques.
Przybylowics and Kusinski [10] have studied the laser cladding process of WC on Ni-base alloy which was used laser processing parameters and to identify porosity, cracks and micro-hardness in the laser cladding process. The results found that fused carbides are obtained an increased growth rate which was due to a reduction in laser scanning speed.
Ola and Doern [11] have focused on the microstructural and geometrical characteristics of cold metal transfer (CMT) clads in nickel-base INCONEL 718 superalloy. In this work, analysis of variance (ANOVA) was used to test the adequacy of the regression models, which are useful indicators for optimizing the cladding parameters. They have conducted mechanical tests that would be helpful to correlate and ensure the proper specification of the cladding layer surface.
Yu et al. [12] and Mondal et al. [13] have used a central composite design (CCD) and response surface methodology (RSM) and they were developed a mathematical model. Based on the developed model it was observed that the low level of laser power and high level of laser scanning speed can produce good quality and bonding coatings. However, confirmation experiments have been carried out in the optimum setting of parameters and other related properties of the cladding layer were examined to ensure the quality and bonding mechanism happened in the cladding surface. Moreover, a few researchers have been used the Taguchi method to optimize the cladding process parameters.
Kattire et al. [14] performed the coating (CPM 9V steel powder) over the H13 tool steel substrate using a CO2 laser. The hard VC was responsible for the clad hardness of 800 HV, which is four times superior to the base metal hardness. Vanadium carbide particles surrounded by retained austenite and martensite were found from the microstructural analysis. Marzban et al. [8] studied the relationship between the laser cladding parameters like laser beam power, the feed rate of clad powder and scan speed are the most responsible for clad profile formation. Norhafzan et al. [15] performed the coating on the H13 steel substrate by the laser cladding process with nickel-titanium powder, and surface properties were modified. Good metallurgical bonding between the base metal and clad zone were found. High hardness was obtained due to the grain refinement and agglomerated NiTi particles in the clad zone. Skumavc et al. [16] implemented the coating over H13 steel with tungsten alloy WNi28Fe15 using GTA welding in which the tungsten alloy is in the shape of a welding rod and act as a filler material. The reference H13 steel was compared with the cladded sample in which the thermal fatigue resistance of the cladded sample was superior to H13 steel. Ley et al. [17] have concentrated on CrMoTaWZr (CCA) complex alloy was deposited on H13 steel substrate using Nd:YAG laser source with a wavelength of (1064nm). The life span of the die was increased by coating the die with CrMoTaWZr alloy. The hardness value shows that the clad H13 steel was superior to the reference H13 steel. The laser fluencies were the most responsible factor for reducing the hardness. Şimşek et al. [18] TiC nanoparticles were deposited on the H13 tool steel using CO2 laser, performed under N2 atmosphere in which the crack-free and homogenous coating were obtained, and the hardness of the clad layer was three times improved when compared to the substrate.
Kim et al. [19] have been used the grey relational approach to optimize the welding parameters for laser arc hybrid welding of an aluminium alloy and compared their results with those obtained from Taguchi methods. The ultimate tensile stress, width and penetration were chosen as the optimization criteria. They are observed that the results obtained from the optimization are much improved than the initial set of parameters.
Based on the existing literature review we found that most of the researchers have been focused on laser-based cladding with the deposition of different varieties of powders and filler wires. There is no visible cladding process parameter optimization using stellite 6 as a filler wire with a substrate of AISI 316 L austenitic steel. Hence, the present work is focused on the cold metal transfer (CMT) cladding process of AISI 316 L austenitic stainless steel using stellite 6 filler wire. A design of experiment (DOE) method based on a rotatable 3D central composite design (CCD) was used to systematically establish relationships between independent cladding process parameter variables and their resultant output variables of the CMT cladding process. Grey relation analysis was used to identify the optimised parameter combination. ANOVA was used to identify the most influencing parameters on the overall multi-objective function.
Cold metal transfer welding is an advanced version of GMAW which incorporates filler wire feed drive into closed-loop feedback control. This advanced joining method yields an extremely stable arc, incorporating filler wire feed drive, ease of joining a different kind of metals, lower joule heat input and sprinkle free molten metal transfer facilitates. The cobalt-based alloy satellite-6 (chemical composition in weight: 1.15% C, 28% Cr, 4% W, 1.3% Fe, 1.1% Si, 0.06% Mn and cobalt is remaining) was used as a cladding metal in the form of filler wire size of 1.2 mm diameter. Stellite-6 is excellent in erosion, corrosion and wears properties. The substrate metal used was an AISI 316 L austenitic stainless steel with the dimension of 420 mm length and 20 mm width. The chemical composition of substrate material AISI 316 L austenitic stainless steel is shown in Table 1.
AISI 316L plates of dimension 500x100x10mm were drawn into required length 500x10x10mm strips using MW250 is a high-precision micro wire EDM machine. Base material (As received) microstructure is shown in Figure 1. A typical photographic view of the cladded plate is shown in Figure 2. The substrate material AISI 316Laustenitic stainless steel is cleaned with a wire brush and followed by acetone to remove the dirt particles.
2.1 Design of experiments
The experiment design is an out-turned pedagogy for designing and conduction the experiments using minimum resources available. In this experimental work, CCD is utilized to set parameters for cladding to test the efficiency of the cladded bonding surfaces. Based on the clad weld bead, it is showing smooth bead appearance and it is ensured that defect-free clads through the X-ray diffraction inspection method. The clad quality was determined through careful sorting of process parameters for the CMT process. The cladding parameters are used in this experimental work and their levels are presented in Table 2. The experiments were conducted as per the rotatable central composite design (CCD) and their corresponding parameter values are shown in Table 3.
Table 1. Chemical composition of substrate material AISI 316 L austenitic stainless steel
|
C |
Cr |
Mn |
Ni |
Si |
Mo |
P |
S |
N |
Fe |
|
0.03 |
17.2 |
2.0 |
12.6 |
0.75 |
2.7 |
0.045 |
0.03 |
0.1 |
Bal. |
Figure 1. As received AISI 316 L metal microstructure
Figure 2. Typical photographic view of cladded plate
Table 2. CMT cladding parameters and their levels
|
Parameters |
Notation |
-2 |
-1 |
0 |
+1 |
+2 |
|
Welding Current (Amps) |
I |
120 |
140 |
160 |
180 |
200 |
|
Voltage (v) |
V |
15 |
17 |
19 |
21 |
23 |
|
Torch Angle (deg) |
TA |
50 |
60 |
70 |
80 |
90 |
|
Welding Speed(m/min) |
TS |
100 |
125 |
150 |
175 |
200 |
Table 3. Experimental parameter values with based on CCD
|
Exp. no. |
I (Amps) |
V (V) |
TA (deg) |
TS (m/min) |
Exp. no. |
I (Amps) |
V (V) |
TA (deg) |
TS (m/min) |
Exp. no. |
I (Amps) |
V (V) |
TA (deg) |
TS (m/min) |
|
1 |
140 |
17 |
60 |
125 |
12 |
180 |
21 |
60 |
175 |
24 |
160 |
19 |
70 |
200 |
|
2 |
180 |
17 |
60 |
125 |
13 |
140 |
17 |
80 |
175 |
25 |
160 |
19 |
70 |
150 |
|
3 |
140 |
21 |
60 |
125 |
14 |
180 |
17 |
80 |
175 |
26 |
160 |
19 |
70 |
150 |
|
4 |
180 |
21 |
60 |
125 |
15 |
140 |
21 |
80 |
175 |
27 |
160 |
19 |
70 |
150 |
|
5 |
140 |
17 |
80 |
125 |
16 |
180 |
21 |
80 |
175 |
28 |
160 |
19 |
70 |
150 |
|
6 |
180 |
17 |
80 |
125 |
17 |
120 |
19 |
70 |
150 |
29 |
160 |
19 |
70 |
150 |
|
7 |
140 |
21 |
80 |
125 |
18 |
200 |
19 |
70 |
150 |
30 |
160 |
19 |
70 |
150 |
|
8 |
180 |
21 |
80 |
125 |
19 |
160 |
15 |
70 |
150 |
31 |
160 |
19 |
70 |
150 |
|
9 |
140 |
17 |
60 |
175 |
20 |
160 |
23 |
70 |
150 |
|
|
|
|
|
|
10 |
180 |
17 |
60 |
175 |
22 |
160 |
19 |
90 |
150 |
|
|
|
|
|
|
11 |
140 |
21 |
60 |
175 |
23 |
160 |
19 |
70 |
100 |
|
|
|
|
|
Table 4. Process parameter levels and experimental tested values
|
Exp. No |
Input Parameters |
Output Parameters |
|||||||
|
I (Amps) |
V (v) |
TA (deg) |
TS (m/min) |
Depth of Penetration (mm) |
Weld Area (mm2) |
Hardness of the clad (HV) |
C R (mm/yr) |
Interface Thickness (mm) |
|
|
1 |
140 |
17 |
60 |
125 |
2.744 |
31.618 |
351 |
0.000781 |
0.079 |
|
2 |
180 |
17 |
60 |
125 |
1.625 |
19.605 |
349 |
0.004582 |
0.05 |
|
3 |
140 |
21 |
60 |
125 |
2.2 |
27 |
354 |
0.02085 |
0.1 |
|
4 |
180 |
21 |
60 |
125 |
2.886 |
32.81 |
357 |
0.009385 |
0.071 |
|
5 |
140 |
17 |
80 |
125 |
2.271 |
25.361 |
358 |
0.01071 |
0.092 |
|
6 |
180 |
17 |
80 |
125 |
2.9 |
34.4 |
321 |
0.009029 |
0.1 |
|
7 |
140 |
21 |
80 |
125 |
2.1 |
27.9 |
323 |
0.003396 |
0.1 |
|
8 |
180 |
21 |
80 |
125 |
2.713 |
29.119 |
351 |
0.002063 |
0.071 |
|
9 |
140 |
17 |
60 |
175 |
2.46 |
26.252 |
340 |
0.00306 |
0.079 |
|
10 |
180 |
17 |
60 |
175 |
3.17 |
40.387 |
328 |
0.008682 |
0.057 |
|
11 |
140 |
21 |
60 |
175 |
2.624 |
55.018 |
335 |
0.006776 |
0.114 |
|
12 |
180 |
21 |
60 |
175 |
2.028 |
21.026 |
352 |
0.08392 |
0.051 |
|
13 |
140 |
17 |
80 |
175 |
2.114 |
22.766 |
348 |
0.001388 |
0.07 |
|
14 |
180 |
17 |
80 |
175 |
1.704 |
28.289 |
342 |
0.02868 |
0.085 |
|
15 |
140 |
21 |
80 |
175 |
2.437 |
28.12 |
368 |
0.004546 |
0.087 |
|
16 |
180 |
21 |
80 |
175 |
2.574 |
30.47 |
355 |
0.01922 |
0.108 |
|
17 |
120 |
19 |
70 |
150 |
2.318 |
23.249 |
358 |
0.06475 |
0.108 |
|
18 |
200 |
19 |
70 |
150 |
2.31 |
24.609 |
379 |
0.001156 |
0.051 |
|
19 |
160 |
15 |
70 |
150 |
2.693 |
28.599 |
332 |
0.08614 |
0.076 |
|
20 |
160 |
23 |
70 |
150 |
2.42 |
27.511 |
335 |
0.001234 |
0.068 |
|
21 |
160 |
19 |
50 |
150 |
2.335 |
25.45 |
365 |
0.02806 |
0.061 |
|
22 |
160 |
19 |
90 |
150 |
1.875 |
19.656 |
348 |
0.001157 |
0.102 |
|
23 |
160 |
19 |
70 |
100 |
2.096 |
21.083 |
351 |
0.000853 |
0.048 |
|
24 |
160 |
19 |
70 |
200 |
1.926 |
25.028 |
358 |
0.004695 |
0.07 |
|
25 |
160 |
19 |
70 |
150 |
2.234 |
27.199 |
355 |
0.004209 |
0.076 |
|
26 |
160 |
19 |
70 |
150 |
1.944 |
24.757 |
318 |
0.004381 |
0.191 |
|
27 |
160 |
19 |
70 |
150 |
1.977 |
24.174 |
330 |
0.001919 |
0.048 |
|
28 |
160 |
19 |
70 |
150 |
1.994 |
22.036 |
343 |
0.003621 |
0.085 |
|
29 |
160 |
19 |
70 |
150 |
1.755 |
24.456 |
354 |
0.04853 |
0.054 |
|
30 |
160 |
19 |
70 |
150 |
1.995 |
24.445 |
344 |
0.000427 |
0.136 |
|
31 |
160 |
19 |
70 |
150 |
1.858 |
30.346 |
336 |
0.004062 |
0.054 |
2.2 Optimization using grey relational analysis
To optimise the CMT parameters using GRA, the experimental data were normalised by assigning the values between 0 and 1. Subsequently, the grey relation coefficient was calculated, which shows the interconnection between the desired and obtained experimental data. Furthermore, the problem was converted to a single objective function by calculating the grey relational grade, which is the average grey relation coefficient. The combination of parameters with the highest value of grey relational grade will be the optimal solution. In the case of CMT cladding, the prime objective will be to increase the depth of penetration and hardness as well as minimise the weld area, corrosion rate and interface thickness.
The procedure for Grey Relational Analysis are as follows:
The experiments were conducted in accordance with the CCD orthogonal array assigning different levels values to the process parameters and the final results for depth of penetration, weld area, Hardness, corrosion rate and interface thickness are shown in Table 4.
3.1 Implementation of Grey Relational Analysis
The GRA is one of the multivariate data analyzing techniques that are widely employed to identify the optimum parameter combination in most manufacturing processes. GRA involves the following steps:
3.1.1 Normalization of output responses
Normalization for higher the better case is calculated using Eq. (1).
$W_{n}^{\circ}(Q)=\frac{w_{n}(Q)-\min w_{n}(Q)}{\max w_{n}(Q)-\min w_{n}(Q)}$ (1)
where, n=1…z
Q = 1, 2, 3…y
Z = no. of test data
Y = no. of characteristics
wn (Q) = original progression
wₒ(Q) = value after GRG
Normalization for lower the better case is calculated using Eq. (2).
$W_{n}^{\circ}(Q)=\frac{\operatorname{maxw}_{n}(Q)-w_{n}(Q)}{\operatorname{maxw}_{n}(Q)-\min w_{n}(Q)}$ (2)
In the present work, microhardness and depth of penetration come under the first case and the remaining output responses such as weld cross-section area, corrosion rate and interface thickness fall under minimization criteria.
The normalized values of all the output values are present in Table 5.
3.1.2 Sequential normalization
Sequential normalization value is calculated by subtracting the normalized value from 1. The sequential normalization values for all the output responses are calculated and the same is presented in Table 5.
3.1.3 GRC (Grey Relational Coefficient)
Grey relation coefficient values for all the output responses were calculated using Eq. (3).
$\varphi_{n}(Q)=\frac{\Delta \min +\gamma \cdot \Delta \max }{\Delta_{o j}(t)+\gamma \cdot \Delta \max }$ (3)
where,
$\varphi_{n}(Q)=$ GRC,
Δmax=greatest value of Δoj(t),
Δmin= minimum value of Δoj (t)
γ= Distinctive coefficient (Presumed to be 0.5)
GRC values of all the output responses are shown in Table 6.
3.1.4 Grey Relational Grade (GRG)
GRG for all the output responses was calculated using Eq. (4).
$\beta_{n}=\frac{1}{u} \sum_{1}^{Z} n(Q)$ (4)
where,
Z= Aggregate number of responses
u= Number of studied responses
The GRG (βn) denotes the relation quantity between the ideal or reference progression and the relative progression. The GRG ‘n’ represents the level of relationship between the reference or ideal sequence and the comparative sequence. If larger GRG is obtained for the equivalent set of process parameters compared to other sets, it is considered as the most favourable optimal setting.
The calculated GRG values are presented in Table 6. From Table 6, it is understood that trial number 18 is having the highest GRG value of 0.839. Hence based on the GRG value, it can be concluded that trail number 18 is the optimised parameter combination. The corresponding input and output responses for trial number 18 are as follows. The input parameters are Welding Current 200 Amps, Voltage 19 V, and Torch Angle 70° and Welding Speed 150 m/min. The corresponding output parameters are Depth of Penetration 2.31 mm, Weld Area 24.609 mm2, Hardness of the clad 379 Hv, Corrosion Resistance 0.00156 mm/yr. and Interface Thickness 0.051 mm.
3.1.5 ANOVA
ANOVA is a method of computation that significantly assesses the contribution of each parameter variation made by the overall response variation. It is used to determine the significance of input parameters. The statistical software Minitab 16.0 is employed to investigate the significance of CMT cladding parameters, namely welding current, voltage, torch angle and welding speed. ANOVA is calculated using GRG for analyzing the importance of the process parameters. The outcomes of ANOVA are shown in Table 7. Analysis of variance was carried out to identify the most influencing factor on the overall objective.
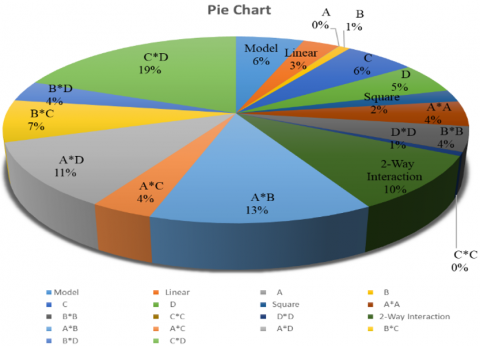
The ANOVA tabulated values for the individual parameters and interaction parameter effects are shown in the Pareto chart is presented in Figure 3. From ANOVA results obtained from the experimental results (Table 7) and Pareto chart is shown in Figure 3 & 4, it is understood that there are no individual effects of the cladding parameters.
Table 5. Normalized & sequential normalization values
|
Exp. No |
Normalized values |
Sequential Normalization values |
||||||||
|
Depth of Penetration (mm) |
Weld Area (mm2) |
Hardness of the clad (HV) |
C R (mm/yr) |
Interface Thickness (mm) |
Depth of Penetration (mm) |
Weld Area (mm2) |
Hardness of the clad (HV) |
C R (mm/yr) |
Interface Thickness (mm) |
|
|
1 |
0.7242 |
0.6607 |
0.5409 |
0.9958 |
0.7832 |
0.2757 |
0.3392 |
0.4590 |
0.0041 |
0.2167 |
|
2 |
0 |
1 |
0.5081 |
0.9515 |
0.9860 |
1 |
0 |
0.4918 |
0.0484 |
0.0139 |
|
3 |
0.3721 |
0.7911 |
0.5901 |
0.7617 |
0.6363 |
0.6278 |
0.2088 |
0.4098 |
0.2382 |
0.3636 |
|
4 |
0.8161 |
0.6271 |
0.6393 |
0.8954 |
0.8391 |
0.1838 |
0.3728 |
0.3606 |
0.1045 |
0.1608 |
|
5 |
0.4181 |
0.8374 |
0.6557 |
0.8800 |
0.6923 |
0.5818 |
0.1625 |
0.3442 |
0.1199 |
0.3076 |
|
6 |
0.8252 |
0.5822 |
0.0491 |
0.8996 |
0.6363 |
0.1747 |
0.4177 |
0.9508 |
0.1003 |
0.3636 |
|
7 |
0.3074 |
0.7657 |
0.0819 |
0.9653 |
0.6363 |
0.6925 |
0.2342 |
0.9180 |
0.0346 |
0.3636 |
|
8 |
0.7042 |
0.7313 |
0.5409 |
0.9809 |
0.8391 |
0.2957 |
0.2686 |
0.4590 |
0.0190 |
0.1608 |
|
9 |
0.5404 |
0.8123 |
0.3606 |
0.9692 |
0.7832 |
0.4595 |
0.1876 |
0.6393 |
0.0307 |
0.2167 |
|
10 |
1 |
0.4131 |
0.1639 |
0.9036 |
0.9370 |
0 |
0.5868 |
0.8360 |
0.0963 |
0.0629 |
|
11 |
0.6466 |
0 |
0.2786 |
0.9259 |
0.5384 |
0.3533 |
1 |
0.7213 |
0.0740 |
0.4615 |
|
12 |
0.2608 |
0.9598 |
0.5573 |
0.0259 |
0.9790 |
0.7391 |
0.0401 |
0.4426 |
0.9740 |
0.0209 |
|
13 |
0.3165 |
0.9107 |
0.4918 |
0.9887 |
0.8461 |
0.6834 |
0.0892 |
0.5081 |
0.0112 |
0.1538 |
|
14 |
0.0511 |
0.7547 |
0.3934 |
0.6703 |
0.7412 |
0.9488 |
0.2452 |
0.6065 |
0.3296 |
0.2587 |
|
15 |
0.5255 |
0.7595 |
0.8196 |
0.9519 |
0.7272 |
0.4744 |
0.2404 |
0.1803 |
0.0480 |
0.2727 |
|
16 |
0.6142 |
0.6931 |
0.6065 |
0.7807 |
0.5804 |
0.3857 |
0.3068 |
0.3934 |
0.2195 |
0.4195 |
|
17 |
0.4485 |
0.8970 |
0.6557 |
0.2495 |
0.5804 |
0.5514 |
0.1029 |
0.3442 |
0.7504 |
0.4195 |
|
18 |
0.4433 |
0.8586 |
1 |
0.9914 |
0.9790 |
0.5566 |
0.1413 |
0 |
0.0085 |
0.0209 |
|
19 |
0.6912 |
0.74602 |
0.2295 |
0 |
0.8041 |
0.3087 |
0.2539 |
0.7704 |
1 |
0.1958 |
|
20 |
0.5145 |
0.7767 |
0.2786 |
0.9905 |
0.8601 |
0.4854 |
0.2232 |
0.7213 |
0.0094 |
0.1398 |
|
21 |
0.4595 |
0.8349 |
0.7704 |
0.6776 |
0.9090 |
0.5404 |
0.1650 |
0.2295 |
0.3223 |
0.0909 |
|
22 |
0.1618 |
0.9985 |
0.4918 |
0.9914 |
0.6223 |
0.8381 |
0.0014 |
0.5081 |
0.0085 |
0.3776 |
|
23 |
0.3048 |
0.9582 |
0.5409 |
0.9950 |
1 |
0.6951 |
0.0417 |
0.4590 |
0.0049 |
0 |
|
24 |
0.1948 |
0.8468 |
0.6557 |
0.9502 |
0.8461 |
0.8051 |
0.1531 |
0.3442 |
0.0497 |
0.1538 |
|
25 |
0.3941 |
0.7855 |
0.6065 |
0.9558 |
0.8041 |
0.6058 |
0.2144 |
0.3934 |
0.044 |
0.1958 |
|
26 |
0.2064 |
0.8545 |
0 |
0.9538 |
0 |
0.7935 |
0.1454 |
1 |
0.0461 |
1 |
|
27 |
0.2278 |
0.8709 |
0.1967 |
0.9825 |
1 |
0.7721 |
0.1290 |
0.8032 |
0.0174 |
0 |
|
28 |
0.2388 |
0.9313 |
0.4098 |
0.9627 |
0.7412 |
0.7611 |
0.0686 |
0.5901 |
0.0372 |
0.2587 |
|
29 |
0.0841 |
0.8630 |
0.5901 |
0.4387 |
0.9580 |
0.9158 |
0.1369 |
0.4098 |
0.5612 |
0.0419 |
|
30 |
0.2394 |
0.8633 |
0.4262 |
1 |
0.3846 |
0.76051 |
0.1366 |
0.5737 |
0 |
0.6153 |
|
31 |
0.1508 |
0.6966 |
0.2950 |
0.9575 |
0.9580 |
0.8491 |
0.3033 |
0.7049 |
0.0424 |
0.0419 |
Table 6. Grade relation coefficient values & grey relational grades
|
Exp. No |
Grade Relation Coefficient values |
Grey Relational Grades |
|||||
|
Depth of Penetration |
Weld Area |
Hardness of the clad |
C R |
Interface Thickness |
GRG |
Rank |
|
|
Units |
mm |
mm2 |
HV |
mm/yr |
mm |
||
|
1 |
0.6445 |
0.5957 |
0.5213 |
0.9918 |
0.6975 |
0.690215803 |
10 |
|
2 |
0.3333 |
1 |
0.5041 |
0.9116 |
0.9727 |
0.74437441 |
3 |
|
3 |
0.4433 |
0.7053 |
0.5495 |
0.6772 |
0.5789 |
0.590895762 |
26 |
|
4 |
0.7311 |
0.5728 |
0.5809 |
0.8271 |
0.7566 |
0.693736152 |
9 |
|
5 |
0.4621 |
0.7546 |
0.5922 |
0.8064 |
0.6190 |
0.646920636 |
19 |
|
6 |
0.7410 |
0.5447 |
0.3446 |
0.8328 |
0.5789 |
0.608442748 |
23 |
|
7 |
0.4192 |
0.6809 |
0.3526 |
0.9352 |
0.5789 |
0.593401303 |
25 |
|
8 |
0.6283 |
0.6504 |
0.5213 |
0.9632 |
0.7566 |
0.703999847 |
6 |
|
9 |
0.5210 |
0.7270 |
0.4388 |
0.9421 |
0.6975 |
0.665333897 |
16 |
|
10 |
1 |
0.4600 |
0.3742 |
0.8384 |
0.8881 |
0.712193751 |
4 |
|
11 |
0.5858 |
0.3333 |
0.4093 |
0.8709 |
0.52 |
0.543918415 |
31 |
|
12 |
0.4034 |
0.9257 |
0.5304 |
0.3391 |
0.9597 |
0.631713019 |
20 |
|
13 |
0.4224 |
0.8485 |
0.4959 |
0.9780 |
0.7647 |
0.701941366 |
7 |
|
14 |
0.3450 |
0.6709 |
0.4518 |
0.6026 |
0.6589 |
0.545912114 |
29 |
|
15 |
0.5131 |
0.6752 |
0.7349 |
0.9123 |
0.6470 |
0.696539924 |
8 |
|
16 |
0.5644 |
0.6197 |
0.5596 |
0.6951 |
0.5437 |
0.596547133 |
24 |
|
17 |
0.4755 |
0.8293 |
0.5922 |
0.3998 |
0.5437 |
0.568134453 |
27 |
|
18 |
0.4732 |
0.7796 |
1 |
0.9832 |
0.9597 |
0.83917356 |
1 |
|
19 |
0.6182 |
0.6631 |
0.3935 |
0.3333 |
0.7185 |
0.545374872 |
30 |
|
20 |
0.5073 |
0.6913 |
0.4093 |
0.9815 |
0.7814 |
0.674209248 |
14 |
|
21 |
0.4805 |
0.7518 |
0.6853 |
0.6079 |
0.8461 |
0.674382325 |
13 |
|
22 |
0.3736 |
0.9971 |
0.4959 |
0.9832 |
0.5697 |
0.683935081 |
11 |
|
23 |
0.4183 |
0.9229 |
0.5213 |
0.9901 |
1 |
0.770568581 |
2 |
|
24 |
0.3830 |
0.7655 |
0.5922 |
0.9094 |
0.7647 |
0.682999464 |
12 |
|
25 |
0.4521 |
0.6998 |
0.5596 |
0.9189 |
0.7185 |
0.669826606 |
15 |
|
26 |
0.3865 |
0.7746 |
0.3333 |
0.9155 |
0.3333 |
0.548670345 |
28 |
|
27 |
0.3930 |
0.7948 |
0.3836 |
0.9663 |
1 |
0.707584339 |
5 |
|
28 |
0.3964 |
0.8792 |
0.4586 |
0.9306 |
0.6589 |
0.664802584 |
17 |
|
29 |
0.3531 |
0.7849 |
0.5495 |
0.4711 |
0.9225 |
0.616276573 |
22 |
|
30 |
0.3966 |
0.7853 |
0.4656 |
1 |
0.4482 |
0.619183928 |
21 |
|
31 |
0.3705 |
0.6224 |
0.4149 |
0.9218 |
0.9225 |
0.650476009 |
18 |
Table 7. Analysis of variance
|
Source |
DF |
Adj SS |
Adj MS |
F-Value |
P-Value |
% Value |
|
Model |
14 |
0.101431 |
0.007245 |
2.65 |
0.032 |
5.6072789 |
|
Linear |
4 |
0.015623 |
0.003906 |
1.43 |
0.27 |
3.0258146 |
|
A |
1 |
0.000067 |
0.000067 |
0.02 |
0.878 |
0.0423191 |
|
B |
1 |
0.001218 |
0.001218 |
0.45 |
0.514 |
0.9521794 |
|
C |
1 |
0.007588 |
0.007588 |
2.78 |
0.115 |
5.8823529 |
|
D |
1 |
0.006749 |
0.006749 |
2.47 |
0.136 |
5.2264071 |
|
Square |
4 |
0.010785 |
0.002696 |
0.99 |
0.443 |
2.0947948 |
|
A*A |
1 |
0.005684 |
0.005684 |
2.08 |
0.169 |
4.4011849 |
|
B*B |
1 |
0.005498 |
0.005498 |
2.01 |
0.175 |
4.2530681 |
|
C*C |
1 |
0.000025 |
0.000025 |
0.01 |
0.926 |
0.0211595 |
|
D*D |
1 |
0.00088 |
0.00088 |
0.32 |
0.578 |
0.6771054 |
|
2-Way Interaction |
6 |
0.075023 |
0.012504 |
4.58 |
0.007 |
9.6910707 |
|
A*B |
1 |
0.017024 |
0.017024 |
6.23 |
0.024 |
13.182395 |
|
A*C |
1 |
0.004743 |
0.004743 |
1.74 |
0.206 |
3.6817605 |
|
A*D |
1 |
0.014617 |
0.014617 |
5.35 |
0.034 |
11.320355 |
|
B*C |
1 |
0.009389 |
0.009389 |
3.44 |
0.082 |
7.2788828 |
|
B*D |
1 |
0.004581 |
0.004581 |
1.68 |
0.214 |
3.5548032 |
|
C*D |
1 |
0.024668 |
0.024668 |
9.03 |
0.008 |
19.107067 |
|
Error |
16 |
0.043718 |
0.002732 |
|
|
|
|
Lack-of-Fit |
10 |
0.029164 |
0.002916 |
1.2 |
0.428 |
|
|
Pure Error |
6 |
0.014554 |
0.002426 |
|
|
|
|
Total |
30 |
0.145149 |
|
47.26 |
|
100 |
Figure 3. Pareto chart of the standardized effects
Figure 4. Pie chart for ANOVA results
The maximum contribution occurred when the two parameters interact with each other. Interaction parameter has shown a higher percentage of contribution than the individual contribution of the parameters. Hence the interaction effect of CD has more influences on the overall multi-objective function followed by the combined effect of AB, AD and BC for all the output responses were calculated using Eq. (4).
3.2 Characterization of optimised set of parameters
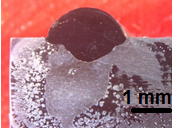
Based on the results obtained from the preliminary experimental work was conducted as per the CCD and their results were taken for the optimization. Based on the GRA optimization techniques, 18 sets of parameters were obtained as an optimised set of parameters. The optimised set of parameters are: welding current 200 Amps, voltage 19 V, torch angle 70°and welding speed 150 m/min. Cladding is performed with optimised parameters. Clad profiles were obtained by sectioning and polishing with suitable abrasive and diamond paste. Clad samples were etched with a suitable electrolytic to state and to increase the contrast of the clad zone with the base metal. The macrograph of the clad bead profile is shown in Figure 5.
A macroscope was used to analyse the profile picture of the cladded sample and is also useful to measure the clad bead geometry and their measured values are depth of penetration 2.310 mm, bead width 7.379 mm and bead height 2.763 mm. Interface region microstructure is shown in Figure 6 and interface thickness (0.051 mm) was also measured with the help of optical microscopy.
The microstructure of optimised clad metal is shown in Figure 7. Figure 7 shows the optical micrograph of the optimised clad layer with deposition of satellite-6 filler wire of 1.2 mm diameter. Figure 6 consists of a dendritic hard structure with a Co-rich phase is found. Finer grain size has appeared on the clad surface. Grains are uniformly distributed to the entire clad surface. A Vickers microhardness tester (Make: Wilson Hardness 402 MVD) was used to find the hardness in the clad zone by applying a test load of 500 gf for a dwell time of 10 s. At an equal interval hardness measurement was taken on the entire clad zone with an intermediate distance of 50 μm to avoid coalescence of indentation and a mean hardness value was determined. The average Microhardness value is 379 Hv. The maximum hardness value is obtained, due to the very fine grain structure that occurred in the clad zone. And also, high current can resist the hardness property of the base metal by softening the surface during the cladding process. For corrosion analysis, the sample of dimension 10 x 10 x 3 mm was extracted from the clad zone for testing and analysis. Before testing, a sample was mechanically polished with SiC paper to 4000 grit finish and washed in distilled water. In order to determine the corrosion behaviour of processed clad, a potentiodynamic polarization test was conducted at ambient temperature in an IVIUM Electrochemical workstation. The electrodes were immersed in an aqueous solution containing 3.5% NaCl which has a pH range of 7 to 8, which is similar to seawater. The experiment was conducted from -1 V/SCE to +1 V/SCE at the scan rate of 1 mV/s.
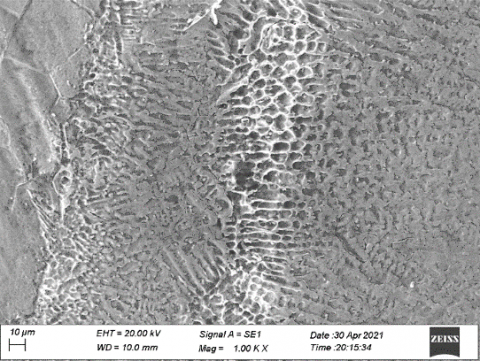
The elemental and microstructural features of a clad zone of the corroded surface were studied under SEM analysis. Corrosion rate per year is 0.001156mm/yr. SEM corroded clad zone is shown in Figure 8. From Figure 8, it is observed that minimum corrosion attack is happening in grains and also grain boundary. Cobalt rich phase could help to retain the corrosion resistance of the clad surface. And also it was understood that the Co-rich phase and the low content of element oxygen are important and resist the corrosion on the specimen.
Figure 5. Macrograph of the clad profile
Figure 6. Microstructure of interface region
Figure 7. Microstructure of the clad metal
Figure 8. SEM microstructure of corroded surface
In this work, Stellite 6 filler wire is successfully cladded on the AISI 316 L austenitic stainless steel substrate by CMT process and the clad bead profiles were measured. The individual and interactions effects of the CMT process parameter like the current, voltage, torch angle and welding speed were studied. The following conclusions are drawn as follows:
|
Amps |
Amphere |
|
V |
Voltage |
|
Hv |
Vicker hardnes |
[1] Ayakumar, K., Senthil Kumar, T., Shanmugarajan, B. (2015). Review study of laser cladding processes on ferrous substrates. International Journal of Advanced Multidisciplinary Research, 2(6): 72-87.
[2] Campana, G., Fortunato, A., Ascari, A., Tani, G., Tomesani, L. (2007). The influence of arc transfer mode in hybrid laser-MIG welding. Journal of Materials Processing Technology, 191(1-3): 111-113. https://doi.org/10.1016/j.jmatprotec.2007.03.001
[3] Kim, I.S., Son, K.J., Yang, Y.S., Yaragada, P.K.D.V. (2003). Sensitivity analysis for process parameters in GMA welding processes using a factorial design method. International Journal of Machine Tools and Manufacture, 43(8): 763-769. https://doi.org/10.1016/S0890-6955(03)00054-3
[4] Ola, O.T., Doern, F.E. (2013). Understanding the effect of welding parameters in laser-GMA hybrid welding of an aluminium alloy using full factorial design, materials science and technology (MS&T). Light Metals for Transportation, Montreal, pp. 1363-1374.
[5] Moradi, M., Salimi, N., Ghoreishi, M., Abdollahi, H., Shamsborhan, M., Frostevarg, J. (2014). Parameter dependencies in laser hybrid arc welding by design of experiments and by a mass balance. Journal of Laser Applications, 26(2): 022004-1-022004-9. https://doi.org/10.2351/1.4866675
[6] Benyounis, K.Y., Olabi, A.G., Hashmi, M.S.J. (2008). Multi-response optimization of CO2 laser-welding process of austenitic stainless steel. Optics & Laser Technology, 40(1): 76-87. https://doi.org/10.1016/j.optlastec.2007.03.009
[7] Sun, Y., Hao, M. (2012). Statistical analysis and optimization of process parameters in Ti6Al4V laser cladding using Nd: YAG laser. Optics and Lasers in Engineering, 50(7): 985-995. https://doi.org/10.1016/j.optlaseng.2012.01.018
[8] Marzban, J., Ghaseminejad, P., Ahmadzadeh, M.H., Teimouri, R. (2015). Experimental investigation and statistical optimization of laser surface cladding parameters. The International Journal of Advanced Manufacturing Technology, 76(5-8): 1163-1172. https://doi.org/10.1007/s00170-014-6338-x
[9] Chen, T., Wu, W., Li, W., Liu, D. (2019). Laser cladding of nanoparticle TiC ceramic powder: Effects of process parameters on the quality characteristics of the coatings and its prediction model. Optics & Laser Technology, 116: 345-355. https://doi.org/10.1016/j.optlastec.2019.03.048
[10] Przybyłowicz, J., Kusiński, J. (2001). Structure of laser cladded tungsten carbide composite coatings. Journal of Materials Processing Technology, 109(1-2): 154-160. https://doi.org/10.1016/S0924-0136(00)00790-1
[11] Ola, O.T., Doern, F.E. (2014). A study of cold metal transfer clads in nickel-base INCONEL 718 superalloy. Materials & Design, 57: 51-59. https://doi.org/10.1016/j.matdes.2013.12.060
[12] Yu, D., Wang, C., Cheng, X., Zhang, F. (2008). Optimization of hybrid PVD process of TiAlN coatings by Taguchi method. Applied Surface Science, 255(5): 1865-1869. https://doi.org/10.1016/j.apsusc.2008.06.204
[13] Mondal, S., Paul, C.P., Kukreja, L.M., Bandyopadhyay, A., Pal, P.K. (2013). Application of Taguchi-based gray relational analysis for evaluating the optimal laser cladding parameters for AISI1040 steel plane surface. International Journal of Advanced Manufacturing Technology, 66: 91-96. https://doi.org/10.1007/s00170-012-4308-8
[14] Kattire, P., Paul, S., Singh, R., Yan, W. (2015). Experimental characterization of laser cladding of CPM 9V on H13 tool steel for die repair applications. Journal of Manufacturing Processes, 20: 492-499. https://doi.org/10.1016/j.jmapro.2015.06.018
[15] Norhafzan, B., Aqida, S.N., Chikarakara, E., Brabazon, D. (2016). Surface modification of AISI H13 tool steel by laser cladding with NiTi powder. Applied Physics A, 122(4): 384-389. https://doi.org/10.1007/s00339-016-9937-6
[16] Skumavc, A., Tušek, J., Nagode, A., Klobčar, D. (2016). Thermal fatigue study of tungsten alloy WNi28Fe15 cladded on AISI H13 hot work tool steel. Surface and Coatings Technology, 285: 304-311. https://doi.org/10.1016/j.surfcoat.2015.09.044
[17] Ley, N., Joshi, S.S., Zhang, B., Ho, Y.H., Dahotre, N.B., Young, M.L. (2018). Laser coating of a CrMoTaWZr complex concentrated alloy onto a H13 tool steel die head. Surface and Coatings Technology, 348: 150-158. https://doi.org/10.1016/j.surfcoat.2018.02.038
[18] Şimşek, T., Izciler, M., Ozcan, Ş., Akkurt, A. (2019). Laser cladding of hot work tool steel (H13) with TiC nanoparticles. Turkish Journal of Engineering, 3(1): 25-31. https://doi.org/10.31127/tuje.419531
[19] Kim, H.R., Park, Y.U., Lee, G.Y., Lee, M.H., Jeong, U., Kim, S.H. (2006). Optimizing welding parameters of laser-arc hybrid welding onto aluminum alloy via grey relational analysis. In Proceedings of the KWS Conference, pp. 253-255. https://doi.org/10.1179/174329307X249423